Abstract
The effects of reduced pressure and casting design on mold filling for thin wall aluminum alloy castings in the expendable pattern casting (EPC) process were investigated experimentally. Thin wall aluminum alloy plates were cast by the EPC process using several coats with different permeabilities. The fluidity length and melt velocity were measured. The application of the reduced pressure condition in the flask led to a larger melt velocity and longer melt fluidity length. There was no significant difference in the melt velocity depending on the casting design. However in the high coat permeability region, the melt fluidity length in top pouring was longer than that in bottom pouring. The distances of melt flow stop were predicted based on the heat transfer from the molten metal to the mold through the coat using measured melt velocities. Except with top pouring in the high coat permeability region, the predicted values more or less agreed with experimental fluidity length values.
This Paper was Originally Published in Japanese in J. JFS 93 (2021) 121–127.
1. Introduction
The expendable pattern casting (EPC) process is very attractive, particularly for the thin-wall castings with complex shapes such as automobile parts,1,2) because near net shape castings are obtained. In the EPC process, the mold filling takes place along with the thermal decomposition of the expendable polystyrene (EPS) pattern and discharge of the pyrolysate through the coat layer, which complicates the mold filling mechanism, and the melt velocity is much lower than that for a cavity mold.3,4) In particular, in the EPC process of aluminum alloy castings, the melt temperature is lower than that of cast iron, resulting in a lower thermal decomposition rate of the EPS pattern and lower melt velocity. Therefore, especially with thin wall castings, a misrun can easily occur due to temperature drop at the melt surface.5,6)
Recently, a relatively large number of investigations have been conducted on the mold filling for the EPC process, such as the research by Maruyama et al.7,8) on molten cast iron. However, almost no studies have been reported on the melt fluidity in thin wall castings. Moreover, there are few mold filling analysis systems that can exactly simulate the EPC process.9) Therefore, it is necessary to accumulate experimental data for a basis of accurate mold filling analysis.
In this study, the research on the mold filling in the EPC process has been conducted for aluminum alloy thin wall plate castings. Table 1 lists several previous major reports on this study. The effect of the coat permeability on the melt velocity was examined by conducting casting experiments using several coats with different permeabilities (Ref. 10) in Table 1).10) Furthermore, the effects of the reduced pressure and casting design on the melt velocity were also considered (Ref. 11) in Table 1).11) However, in these reports, because the mold filling was completed in almost all conditions, no consideration has been discussed on the melt fluidity length.
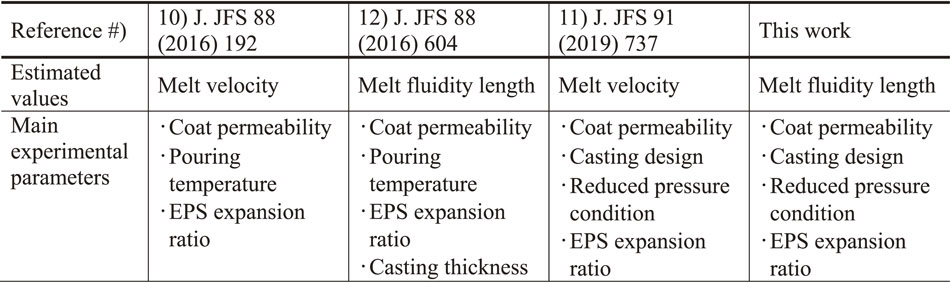
Table 1 List of previous studies on mold filling in EPC process and this study.
In previous studies,12,13) the effects of the coat permeability, pouring temperature, and expansion ratio of the EPS pattern on the melt fluidity length were examined experimentally. The relationship between the melt fluidity length and melt velocity was discussed. Additionally, solidification analyses were carried out using the measured melt velocity values. During mold filling, the apparent melt viscosity increases with increasing the solid fraction owing to a temperature drop at the melt surface. As a result, the melt flow stops. The distance of melt flow stop was predicted by considering the above mentioned critical solid fraction for melt fluidity. Furthermore, the calculated values were compared with experimental values of the melt fluidity length. When the coat permeability was larger than approximately 2, the melt velocity increased very little even with increasing the coat permeability. Therefore, the increase in the melt fluidity length was small.12) In addition, the effect of heat insulating coat on the melt fluidity length was not significant.13)
In this study, the effects of the reduced pressure in the flask and casting design on the melt fluidity length in thin wall castings, which have not been examined previously, were studied experimentally. Furthermore, as in the previous study, the melt fluidity length values were predicted and compared with the experimental results. In the previous reports12,13) and this report for the EPC process of aluminum alloy plate castings, the condition of the casting thickness of 5 mm at which a misrun had occurred under many conditions, was used to define thin wall castings.
2. Experimental Procedure
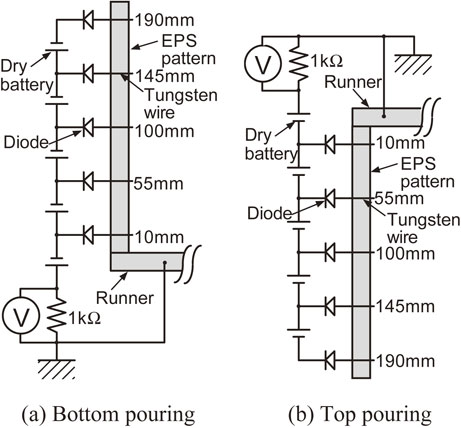
Figure 1 shows a schematic of the casting apparatus used in this study, which is similar to that used in previous studies.12,13) The steel molding flask was a cylindrical vessel with an inside diameter of 200 mm and depth of 300 mm. The EPS pattern shown in Fig. 1 has a plate shape with a width, height, and thickness of 70, 200, and 5 mm, respectively, with a depth direction length of 70 mm. The cluster of the bottom pouring system was assembled with the EPS pattern, as shown in Fig. 1(a). The cluster of the top pouring system was also assembled using the EPS pattern of the same size, as shown in Fig. 1(b). The EPS pattern with expansion ratio of 60 times (density = 18 kg·m−3) was mainly used. The EPS pattern with expansion ratio of 100 times (density = 11 kg·m−3) was also used for experiments on the effect of the casting design.

The runner is a plate EPS with a cross section of 35 × 10 mm and length of 135 mm, which has an expansion ratio of 60 times. The cross section of the ingate is 35 × 10 mm. A ceramic tube (inside diameter and outside diameter of 25 and 35 mm, respectively) was used as a sprue from the pouring basin to the runner. The length of the sprue was 300 mm for the bottom pouring (Fig. 1(a)) and 100 mm for the top pouring (Fig. 1(b)). The pouring basin is an insulating sand mold with an inside diameter, depth, and thickness of 80, 80, and 15 mm, respectively. JIS No. 6 silica sand with a mode diameter of approximately 0.15 mm (AFS grain fineness number 62) was poured into the flask.
As shown in Table 2, ten kinds of coats consisting of three mica base coats (A, B, and D) and seven kinds of silica base coats (C, and E–J) were used. The values of coat permeability are in the range of 0.13–45, and are in accordance with JIS mold permeability (JIS Z2603).14) These values were determined from the slopes of inter-coat differential pressures plotted as a function of the air flow rate through the coat layer.10) The coat layer of mica base coats (coats A, B, and D) generally has a high heat insulation characteristics not only a low permeability. After the EPS pattern was coated using a dipping method, it was dried for 24 h in a drying furnace at 323 K. The coat thickness after drying was approximately 1 mm.
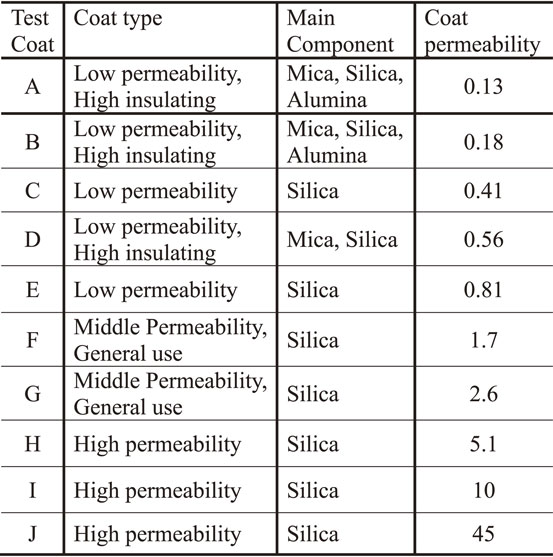
Table 2 Test coats used in experiments.
An aluminum alloy JIS AC2A (A319 equivalent) was used as the casting material. It was melted in a high frequency electric induction furnace, after which it was cast directly from the furnace. The pouring temperature was set at approximately 973 K. During the pouring process, the distance from the bottom of the pouring basin to the melt surface was maintained at approximately 50 mm. The pouring operation was continued until the height of the melt surface in the basin changed, either due to the complete mold filling or melt flow stop. As a result, the melt head during mold filling exhibits similar values under each experimental condition in both casting designs. During mold filling, the melt head at the melt surface decreases from approximately 350 to 150 mmAl with the bottom pouring, whereas it increases from approximately 150 to 350 mmAl with the top pouring. An atmospheric pressure and reduced pressure of 13.3 kPa (differential pressure with respect to atmospheric pressure) were applied in the flask during the pouring process and mold filling. However, when the coat permeability was 0.41 (coat C) and 1.7 (coat F), experiments were carried out in detail under five different reduced pressure conditions (0, 3.3, 6.7, 10, and 13.3 kPa). The pressure in the flask was reduced by aspiration using a suction port on the flask side. A plastic film was used to cover the top of the flask and maintain the reduced pressure in the flask.
In this study, the melt fluidity was evaluated by measuring the melt fluidity length. In order to measure the melt arrival time in the flow direction, five touch sensors7,8) for the molten metal were inserted into the EPS pattern at distances of 10, 55, 100, 145, and 190 mm from the ingate, as shown in Figs. 2(a) and 2(b) for both bottom and top pourings. The touch sensors are tungsten wires with diameters of 0.5 mm, which passed through the center of the 70 mm wide EPS pattern. The voltage across the resistance in Fig. 2 increases in a stepwise fashion, every time the molten metal contacts a touch sensor. The melt arrival time was defined as the voltage rise time in this voltage-time chart. The average melt velocity was defined with respect to the time when the molten metal reached the touch sensor finally.
3. Analytical Procedure12,13)
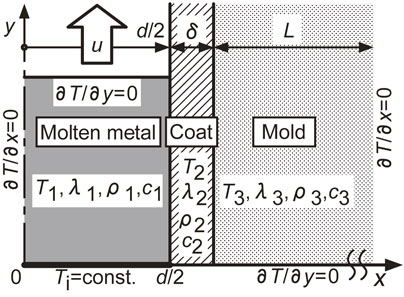
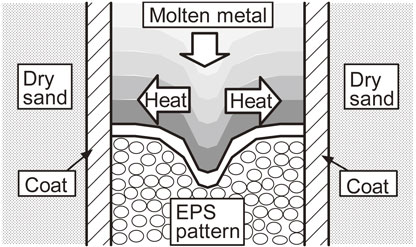
The case where the molten aluminum alloy replaces in the EPS pattern of a semi-infinite plate using the bottom pouring system as shown in Fig. 3, was considered. In this analysis, the melt velocity was assumed to be constant. Furthermore, the heat release from molten metal was assumed to be the only heat transfer to the dry sand mold through the coat layer. In Fig. 3, x is the distance from the center of the molten metal in the thickness direction, and y is the distance from the inlet of the molten metal. In this case, the conductive heat transfer from the molten metal to the mold through the coat, can be formulated as:
| \begin{equation}
\text{Molten metal:}\quad \rho_{1}c_{1}\frac{\partial T_{1}}{\partial t} = \lambda_{1}\left(\frac{\partial^{2}T_{1}}{\partial x^{2}} + \frac{\partial^{2}T_{1}}{\partial y^{2}}\right)
\end{equation}
| (1) |
| \begin{equation}
\text{Coat:}\qquad \rho_{2}c_{2}\frac{\partial T_{2}}{\partial t} = \lambda_{2}\left(\frac{\partial^{2}T_{2}}{\partial x^{2}} + \frac{\partial^{2}T_{2}}{\partial y^{2}}\right)
\end{equation}
| (2) |
| \begin{equation}
\text{Mold:}\qquad \rho_{3}c_{3}\frac{\partial T_{3}}{\partial t} = \lambda_{3}\left(\frac{\partial^{2}T_{3}}{\partial x^{2}} + \frac{\partial^{2}T_{3}}{\partial y^{2}}\right)
\end{equation}
| (3) |
where
t is the time,
T is the temperature, λ,
c, and ρ are the thermal conductivity, specific heat, and density, respectively. For numerical calculations, the finite differential method was used. The temperature recovery method
15) was used to deal with the latent heat of solidification. The linear approximation between the solid fraction
fS and temperature of melt
T, can be written as follows:
15)
| \begin{equation}
T = T_{L} - (T_{L} - T_{S})f_{S}
\end{equation}
| (4) |
where
TL and
TS are the liquidus and solidus temperatures, respectively. The melt flow stop was determined from the time when the solid fraction at the center of melt surface was 0.52.
16) The flow length under this condition was defined as the distance of melt flow stop.
Table 3 shows the main physical properties used for calculations. The JIS AC2A values
17) were used for the physical properties of the molten aluminum alloy. The values previously measured by authors were used for the thermal conductivity and bulk density of the dry sand packed bed.
18) The literature data
18) was used for the specific heat of the sand mold. The values measured by authors
12,13) were used for thermal conductivities of the coat layer.
19) The heat transfer coefficient at the molten metal-coat interface was assumed
h = 350 W·m
−2·K
−1.
5,6) The correlation line of the measured melt velocity in this work was used for the melt velocity at the ingate. During mold filling until melt flow stop, a constant value of the melt velocity was used.
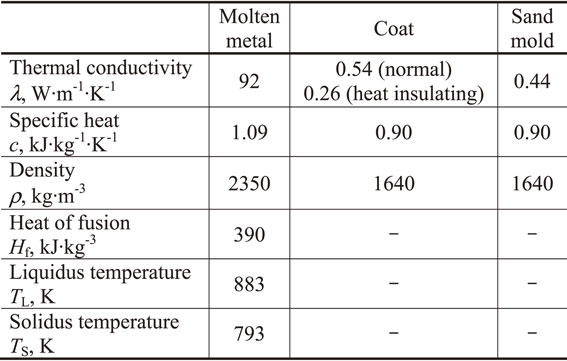
Table 3 Physical properties used in calculations.
4. Experimental Results and Discussion
Figure 4 shows the experimental values of the melt fluidity length for a bottom pouring. These values are shown as a function of the coat permeability, with the degree of reduced pressure as a parameter. As shown in Table 2, heat insulating coats are included in the low coat permeability region. However, a previous report13) showed that the effect of heat insulating coat on the melt fluidity length was not significant. Therefore, these experimental values were shown without distinction from normal coats. A fluidity length of 200 mm, shown as the dotted line in Fig. 3, indicates completed mold filling. The use of a high permeability coat or reduced pressure condition led to a higher melt fluidity length. At a reduced pressure condition of 13.3 kPa, when the coat permeability is larger than approximately 2 (K > 2), the mold filling is completed. Therefore, the effect of the coat permeability on the fluidity length cannot be examined. With the non-reduced pressure condition, even when the coat permeability is larger than approximately 2 (K > 2), the melt fluidity length does not increase significantly with increasing coat permeability. The rate of increase in the melt fluidity length decreases compared to the low coat permeability region (K < 2). It is considered that the melt flow stop depends on the increase in the solid fraction due to the temperature drop at the melt surface. Furthermore, the temperature drop at the melt surface is dependent on the melt velocity, which in turn is related to the heat release time during mold filling. The relationship between the melt fluidity length and melt velocity was examined in the following.
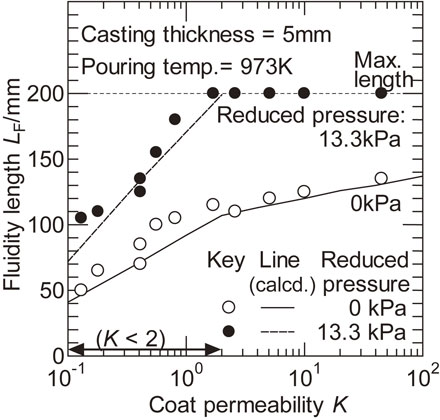
Figure 5 shows the experimental values of the melt velocity u obtained when measuring the melt fluidity length as shown in Fig. 4. These values are shown as a function of the coat permeability K, with the degree of reduced pressure as a parameter. The melt velocity increases with increasing coat permeability. The use of a reduced pressure condition led to higher melt velocities. As the melt velocity increases, the heat release time of the melt becomes shorter, resulting in a lower temperature drop at the melt surface. This result qualitatively agrees with the result of the melt fluidity length shown in Fig. 4. Under the non-reduced and reduced conditions, respectively, when the coat permeability is less than approximately 2 (K < 2), the melt velocity increases relatively monotonously with increasing coat permeability. However, when the coat permeability is larger than approximately 2 (K > 2), the rate of increase in the melt velocity is reduced. This result also qualitatively agrees with the consideration that the melt fluidity length depends on melt velocity, as described above.
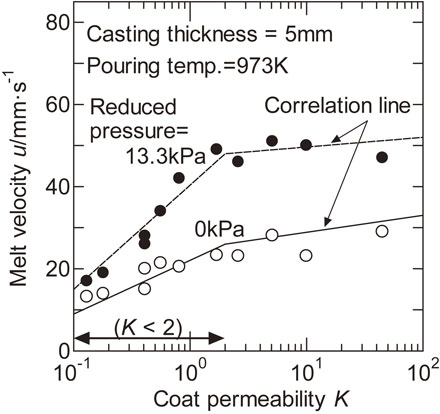
The solid and dashed lines in Fig. 4 represent the calculated distances of melt flow stop. For this calculation, the value of the melt velocity u is required. Therefore, the experimental values of the melt velocity u shown in Fig. 5, were divided into two regions, namely, the region for which the coat permeability is less than 2 (K < 2) and that with (K > 2). The linear approximations in each region were used for the melt velocity u. The solid and dashed lines in Fig. 5 represent the correlation lines of the melt velocity for the non-reduced and reduced pressure conditions, respectively. As described above, since the effect of the heat insulating coat on the melt fluidity length was not significant,13) the calculated values of melt flow stop distance were not distinct from those for normal coats. Except under the reduced pressure condition and region where the coat permeability is larger than approximately 2 (K > 2), the experimental values of melt fluidity length more or less agree with the calculated values. As a result, when the melt velocity is known, the melt fluidity length can be estimated. The effect of the reduced pressure on the melt fluidity length seems to be examined almost quantitatively using the change in the melt velocity.
Figure 6 shows the experimental values of the melt fluidity length for a bottom pouring, as a function of the degree of reduced pressure, with the coat permeability of K = 0.41 and 1.7. The use of a high permeability coat or reduced pressure condition increases the melt fluidity length, similar to the results in Fig. 4. The melt fluidity length increases almost linearly with increasing the degree of reduced pressure.
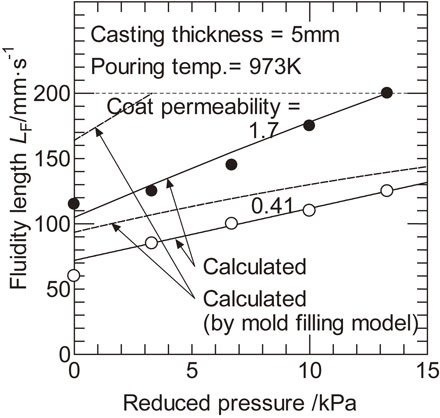
Figure 7 shows the experimental values of the melt velocity u obtained when measuring the melt fluidity length as shown in Fig. 6, as a function of the degree of reduced pressure, with the coat permeability of K = 0.41 and 1.7. The melt velocity u increases almost linearly with increasing the degree of reduced pressure. As a result, it may be considered that the melt fluidity length shown in Fig. 6 also increased almost linearly with respect to the degree of reduced pressure. The solid lines in Fig. 6 represent the calculated values of the melt flow stop distance. As values of the melt velocity u were required for this calculation, the values derived from the linear approximations of the measured melt velocities in Fig. 7, were used. The calculated values of the melt flow stop distance are more or less in agreement with the experimental values of the melt fluidity length. The dashed lines in Fig. 7 represent the calculated values of melt velocity based on the mold filling model4) in a previous study, which are larger than the experimental values. Therefore, the values of the melt fluidity length calculated using the mold filling model shown by the dashed lines in Fig. 6, are larger than the experimental values.

Figure 8 shows the experimental values of the melt fluidity length for a non-reduced pressure condition. These values are shown as a function of the coat permeability, with the casting design as a parameter. When the coat permeability is less than approximately 2 (K < 2), the melt fluidity length increases with increasing the coat permeability. However, the effect of the casting design on the melt fluidity length is not significant. On the other hand, when the coat permeability is larger than approximately 2 (K > 2), the melt fluidity length for a top pouring is larger than that for a bottom pouring. Furthermore, the mold filling for a top pouring is completed under the conditions in this work.
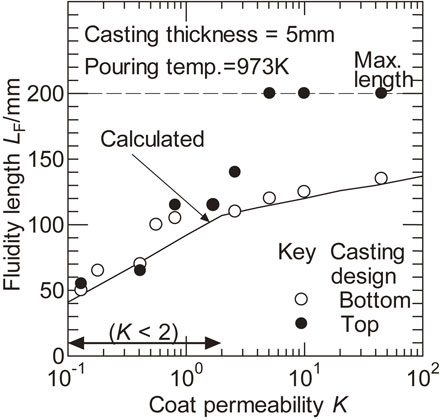
Figure 9 shows the experimental values of the melt velocity u obtained when measuring the melt fluidity length as shown in Fig. 8. These values are shown as a function of the coat permeability K, with the casting design as a parameter. In the range of coat permeability in this experiment, the effect of the casting design on the melt velocity is not significant. In contrast to this result, when the coat permeability is larger than approximately 2 (K > 2), the melt fluidity length for the top pouring is larger than that for the bottom pouring, as shown in Fig. 8. The discussion for this phenomenon may be as follows.

Figure 10 shows examples of the castings appearance with the bottom pouring and top pouring. This figure shows the difference in the melt surface shape at the melt flow stop with respect to the casting design. The casting with the bottom pouring has a flat melt surface as shown in Fig. 10(a). However, with the top pouring, a local melt preceding flow was observed in many castings, as shown in Fig. 10(b).
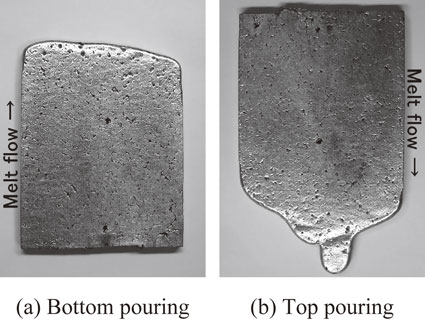
Figure 11 shows a schematic diagram of the mold filling with the top pouring, which shows a local melt preceding flow as shown in Fig. 10(b). In this case, the heat transfer occurs perpendicular to the melt flow as shown in Fig. 11, which results in an increase in the melt surface temperature in a different position from where the melt flow preceded. As a result, it seems that the melt fluidity length increases. With increasing the coat permeability, since the melt velocity increases, the turbulence of the melt flow also increases. Thus, the heat transfer perpendicular to the melt flow seems to be more remarkable.
The line in Fig. 8 represents the calculated melt flow stop distances. In this calculation, the melt velocity used was derived from the linear approximation of measured melt velocities in Fig. 9. With the bottom pouring, the calculated values of the melt flow stop distance more or less agree with the experimental values of the melt fluidity length. When the coat permeability is larger than approximately 2 (K > 2), the measured values of the melt fluidity length with the top pouring were larger than those with the bottom pouring. Therefore, these measured values are also larger than the calculated values of the melt flow stop distance.
Figure 12 shows the experimental values of the melt fluidity length for a non-reduced pressure condition and EPS expansion ratio of 100 times. These values are shown as a function of the coat permeability, with the casting design as a parameter. When the coat permeability is larger than approximately 2 (K > 2), with both the bottom and top pouring, the mold filling is completed under the conditions in this experiment. Therefore, the effect of the casting design on the melt fluidity length cannot be examined in this region. When the coat permeability is less than approximately 2 (K < 2) and larger than approximately 0.4 (K > 0.4), the melt fluidity length for the top pouring is larger than that for the bottom pouring, and the mold filling is completed. This is similar to the result with an EPS expansion ratio of 60 times and coat permeability of above approximately 2 (K > 2), as shown in Fig. 8. It seems that the melt fluidity length increased due to the local melt preceding flow, as shown in Fig. 10(b). Because the melt velocity with an EPS expansion ratio of 100 times is higher than that with an expansion ratio of 60 times, the melt fluidity length seems to have increased in the lower coat permeability region.
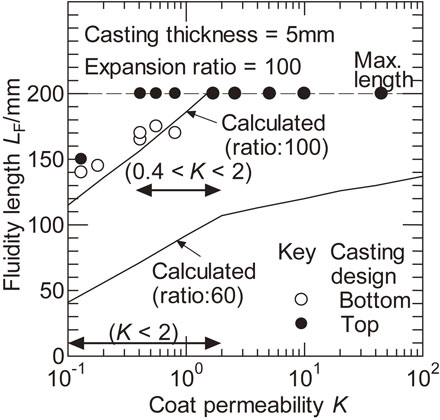
Figure 13 shows the experimental values of the melt velocity u obtained when measuring the melt fluidity length as shown in Fig. 12. These values are shown as a function of the coat permeability K, with the casting design as a parameter. The effect of the casting design on the melt velocity is not so significant. In Fig. 13, the correlation line of the melt velocity for an EPS expansion ratio of 60 times shown in Fig. 9, is included for comparison. The melt velocity for an EPS expansion ratio of 100 times is considerably higher than that for expansion ratio of 60 times.
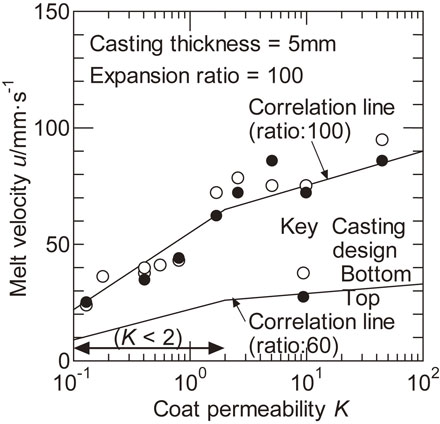
The line shown in Fig. 12 represents the calculated values of the melt flow stop distance. The melt velocity used in this calculation was derived from the linear approximation of measured melt velocities in Fig. 13. When the coat permeability is larger than approximately 2 (K > 2), the calculated values of the melt flow stop distance are also larger than 200 mm. Therefore, the calculated and measured values of the melt fluidity length were compared in the region where the coat permeability is less than approximately 2 (K < 2). With the bottom pouring, the calculated values of the melt flow stop distance more or less agree with the experimental values of the melt fluidity length. However, with the top pouring, the measured values of the melt fluidity length were longer than that with the bottom pouring. Therefore, the measured values of the melt fluidity length also longer than the calculated values of the melt flow stop distance. In Fig. 12, the calculated values of the melt flow stop distance for an EPS expansion ratio of 60 times shown in Fig. 8, are also included for comparison. When the coat permeability is limited to less than approximately 2 (K < 2), the melt fluidity length for an EPS expansion ratio of 100 times is considerably larger than that for a ratio of 60 times. This result seems to be because the melt velocity shown in Fig. 13 is considerably higher than that for an EPS expansion ratio of 60 times.
5. Conclusion
The effects of the reduced pressure and casting design on the mold filling for thin wall aluminum alloy castings in the EPC process were investigated. Aluminum alloy plates were cast using several kinds of coats with different permeabilities. The melt fluidity lengths and melt velocities were measured. The following conclusions were obtained under the conditions in this work.
-
(1)
The use of a reduced pressure condition led to a higher melt velocity and melt fluidity length.
-
(2)
There was no significant difference in the melt velocity with respect to the casting design. However in the high coat permeability region, the melt fluidity length in top pouring was longer than that in bottom pouring.
-
(3)
Except with the top pouring in the high coat permeability region, the predicted values of the melt flow stop distance more or less agreed with experimental values of the melt fluidity length.
REFERENCES
- 1) A.T. Speda: Mod. Cast. (2001) 29.
- 2) General Motors Asia Pacific Japan: SOKEIZAI (1994) 5.
- 3) F. Sonnenberg: LOST FOAM casting made simple, (American Foundry Society, Schaumburg, 2008).
- 4) S. Koroyasu: J. JFS 81 (2009) 377–383.
- 5) S. Koroyasu and A. Ikenaga: Mater. Trans. 53 (2012) 224–228.
- 6) S. Koroyasu and M. Matsuda: J. JFS 76 (2004) 687–694.
- 7) T. Maruyama, K. Katsuki and T. Kobayashi: J. JFS 78 (2006) 53–58.
- 8) T. Maruyama, N. Goto and T. Kobayashi: J. JFS 81 (2009) 117–122.
- 9) for example, F. Kinoshita: J. JFS 86 (2014) 927–930.
- 10) S. Koroyasu: J. JFS 88 (2016) 192–197.
- 11) S. Koroyasu: J. JFS 91 (2019) 737–742.
- 12) S. Koroyasu: J. JFS 88 (2016) 604–609.
- 13) S. Koroyasu: J. JFS 91 (2019) 743–746.
- 14) EPC Process Technical Meeting: Characteristic and Standardization of Coat for EPC Process (Kansai Branch of JFS, 1996) 18.
- 15) I. Ohnaka: Computer Den-netsu Gyoukokaiseki Nyumon, (Maruzen, Tokyo, 1990) p. 202.
- 16) S. Kashiwai, J.D. Zhu and I. Ohnaka: J. JFS 73 (2001) 592–597.
- 17) Japan Foundry Engineering Society: Tyuzoukougaku Binran, (Maruzen, Tokyo, 2002) p. 450.
- 18) S. Koroyasu and M. Matsuda: J. JFS 68 (1996) 949–955.
- 19) I. Ohnaka: Computer Den-netsu Gyoukokaiseki Nyumon, (Maruzen, Tokyo, 1990) p. 326.