Abstract
To solve the problem in joining dissimilar metals caused by intermetallic compound, dissimilar lap joining of SUS304 and A5083 was examined using a spot forge-welding method. The tensile shear load reached approximately 4.5 kN with a short bonding time of less than 0.1 s. Fatigue data were also acquired to confirm practical strength. The reaction layer of the bonded interface was approximately 10 nm thick, consistent with the calculated value. A high-strength dissimilar joining process that provides a highly productive and virtually intermetallic compound-free interface was established.
1. Introduction
In the production of automobile bodies, where multi-materials are used to drastically reduce vehicle weight, the management of dissimilar joining of iron (Fe) and aluminum (Al) is important for assembly welding. However, this is difficult because of the potential for intermetallic compound (IMC) formation, which often generates Al5Fe2 and Al3Fe. These compounds have a crystal structure with a poor slip system or growth defects, so the bonding strength generally decreases significantly when the thickness exceeds around 1 µm.1,2) To suppress IMC formation, various joining methods, such as friction stir spot welding,3,4) laser brazing,5,6) friction stir blazing7) and friction welding8) have been used. However, these methods are not sufficient in terms of productivity or compatibility with current assembly lines. While, a recent approach for improving the conventional resistance spot welding process exploits a eutectic reaction that occurs when combining an Al alloy with zinc (Zn)-plated steel.9) By discharging an aluminum oxide film from the bonding interface, a new surface is formed at the bonding interface. Furthermore, by controlling the energization over a short period, growth of the reaction layer (RL) is suppressed.10) However, improvements to the conventional resistance spot welding method are limited in terms of the grades of plating materials, and the thickness of the Fe–Al RL is restricted to approximately 1–2 µm. Therefore, a method that can directly bond Fe with Al and control the RL in a mesoscopic region of several nanometers to several tens of nanometers is needed.
Previous studies11,12) have described an innovative dissimilar spot-joining method, spot forge-welding, to address the above problems. Contaminated layers (i.e., oxides) at the bonding interface are removed by plastic flow, and diffusion bonding occurs rapidly on the new surface. The RL at the bonding interface can be confined to a mesoscopic region where brittleness is not evident. Using an articulated robot and a single-axis actuator (e.g., a C-type arm), the configuration and usability of the dissimilar spot-joining method can be similar to those of resistance spot welding, for high compatibility with current assembly lines. Furthermore, the dissimilar spot-joining method promotes high productivity and strength, and also guarantees joint quality. Thus, it may serve as a next-generation method that overcomes barriers to multi-materialization.
The bondability of stainless steel (SUS) to Al has not yet been clarified. In this study, SUS/Al processing conditions and productivity were investigated, as were the fatigue characteristics and practical strength of the joint. Furthermore, the estimated and actual thickness of the RL were compared. The findings demonstrated that the dissimilar spot-joining method constitutes an innovative approach to dissimilar joining, especially in terms of the suppression of IMC formation.
2. Experimental
Rolled sheets of JIS-SUS304 and JIS-A5083 were used for the experiments. The chemical composition and mechanical properties of the materials are given in Table 1 and 2, respectively. Each test piece had dimensions of 30 × 100 × 1 mm3. All bonding tests were conducted after preheating. The A5083 was preheated on a hot plate at 673 K (400°C) for 60 s, and the SUS304 was preheated in an electric furnace at 1,023 K (750°C) for 30 s. The Fe plate was placed on top of the Al plate. The overlap was approximately 30 mm × 65 mm, and the center of the overlapping part was forge-welded by a SKD61 round-column jig press (punch diameter (D): 5, 8, and 10 mm, abbreviated herein as D5, D8, and D10, respectively; thickness: 5 mm; hardness: HRC 52). Spot forge-welding was performed with the pressing jig and by means of hammering with a 2,000-kN class alternating current servo press (model H1F200-2; Komatsu Industries Corp.). Figure 1(a) shows an illustration of the spot forge-welding process. The pressing machine, of which shots per minutes (SPM) is 50, was operated with 50% override under displacement control. The override referred to here is a function that adjusts the rated operating speed of the press in the range of 0 to 100%. The temperature of the bonding interface immediately before processing was approximately 703 K (430°C). The slide position varied among three different punch D, and the effects of reduction ratio R and peak pressure on the tensile shear strength of the joint were investigated, and the relationship between R and the peak pressing load was also investigated. The optimal weld conditions (D, R) were determined from these tests. The R was obtained by dividing the plate thickness before joining by that at the center point of the joint, thereby indicating the degree of plastic flow at the joint interface. The peak pressure is an apparent surface pressure obtained by dividing the peak pressing load by the area of pressing jig. As an example, Fig. 1(b) and (c) show the variations in slide stroke, slide velocity, and pressing load during spot forging and the appearance of the welded joint obtained when the punch diameter is D8 and the reduction ratio R is 2.0, respectively. The pressurization time was less than 0.1 s.

Table 1 Chemical composition of the materials (mass%).

Table 2 Mechanical properties of the materials.
Furthermore, in order to confirm the durability of the joint under the optimal weld conditions, load as a function of the number of cycles to failure Nf was obtained under load-controlled conditions. The load was cyclic, the stress ratio tension was 0, and the frequency was 20 Hz.
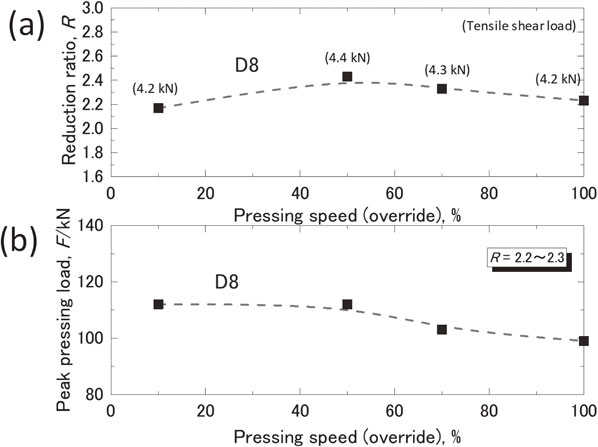
Apart from the above tests conducted with the fixed override of 50%, to assess the processing productivity, the override was varied from 10% to 100%, and the effects on the R and peak pressing load were examined.
To confirm the bonding mechanism and interface quality, the fracture surface was observed by scanning electron microscopy (SEM) equipped with an energy dispersive spectrometer (EDS), and the structure and chemical composition of the central cross-section of the joint under optimal conditions were determined by optical microscopy (OM), electron backscattering diffraction (EBSD) pattern obtained using a field-emission scanning electron microscopy, electron probe microanalysis (EPMA), and transmission electron microscopy (TEM). The estimated and actual thickness of the Fe/Al reaction-diffusion layer were then compared.
3. Results and Discussion
Figure 2(a) and (b) show the effects of the R and peak pressure on the tensile shear load of the Fe/Al dissimilar joint at various punch D, respectively. In both graphs, the filled markers show the fracture of the base metal (BM) and the blank markers show the fracture at the bonded interface (BI). In the case of BM breakage, plug fracture of the Al alloy was observed. The joint strength tended to increase sharply from certain point with increasing the R and peak pressure, and the fracture mode transitioned from BI to BM fracture. This transition point corresponded to R ≥ 1.7 with a pressure of 1,300–1,500 MPa. Considering the correlation between these parameters and the joint strength, the joint strength can be arranged with less variation when evaluated by R. Based on R, strength could be determined at all measurement points on the joint by comparing the wall thickness before and after welding. In the R range tested in this experiment, the maximum joint strength was obtained when the R was 1.8–2.4 at D8 and D10, and the maximum tensile shear load was approximately 4.5 kN. While, with a relatively small punch D, i.e., D5, the joint strength tended to increase in a parabolic manner as the R increased, and the maximum tensile shear load reached approximately 4 kN when the R was 3.8.

The joint strength behaviors of the D8 and D10 in Fig. 2(a) can be roughly divided into an increasing region (R < 1.8), a stable region (1.8 ≤ R ≤ 2.4) and a decreasing region (2.4 < R) with respect to the increase of R. In the F-increasing region (R < 1.8), the formation of new surfaces due to plastic flow increases and the sound joint area increases, which is thought to improve the strength. When the strength of the bonded surface exceeds the strength of the stress concentration in the Al BM, the transition to BM fracture (Al plug fracture) occurs. The strength increases to some extent even after the transition to BM, which is considered to be due to the increase in the effective bonding area, i.e., the increase in the diameter of the plug fracture.12) In the F-stable region (1.8 ≤ R ≤ 2.4), the effective bonding area increases as R increases, but on the other hand, the thickness of the Al alloy becomes thinner, so these effects are considered to be balanced. For the F-reduced region (2.4 < R), the effect of the reduced wall thickness of the Al alloy is considered to be dominant. On the other hand, in the D5, unlike the D8 and D10, there was only a region where F increased in the range of R tested; in fact, there was a clear tendency for the plug fracture diameter of the Al alloy to increase as R increased. This behavior differs from that of SPFC980/A5083,12) which showed almost no difference in behavior between forged diameters. To investigate this discrepancy, detailed cross-sectional observations of the effects of punch D are needed, in addition to numerical analysis of plastic flow.
According to the current strength standard for resistance spot welding (JIS Z3140, 2017), the tensile shear load between A5083 O materials with a thickness of 1 mm is approximately 2 kN under the strictest A class standard. Therefore, using this joining method, the Fe/Al dissimilar joints fully meet the criteria with R ≥ 1.7, regardless of punch D. In addition, the plug fracture mode is compatible with the requirements of the automobile industry.
Figure 2(c) shows the relationship between R and the peak pressing load at each punch D. The filled markers show the fracture of the BM and the blank markers show the fracture at the BI. At D8 and D10, the R that could be expected to provide the maximum strength of 4.5 kN was approximately 2 (Fig. 2(a)), and the pressing loads were approximately 80 kN and 170 kN, respectively. Therefore, D8 and an R of around 2 represented the optimal conditions. To further reduce the pressing load, the punch D can be decreased, although this will be in combination with the joint strength.
Figure 3 shows the SEM reflection electron images and EDS analysis charts of a fracture surface on SUS304 side of the BI fractured joint (D10, R1.6). The tensile shear load of this joint was 2.0 kN. The bright area in the image is SUS304 with a little Al alloy adhered. This fracture surface was relatively smooth and no dimples were observed. On the other hand, the dark area is the Al alloy, indicating the fracture is Al alloy BM. Dimples were formed on the fracture surface and elongated in the tensile direction, indicating that at least in this fracture area, the material strength of the Al alloy itself was exerted to fracture. In general, the closer to the center, the more Al tended to adhere. However, the presence of the adhesive varies over a wide area and is not uniform even locally. In order to systematically understand the state of the bonding interface during the transition from BI fracture to BM fracture, it is necessary to investigate the relationship between R, the area ratio and distribution of the dimples, and the strength of the BI fractured joints as future work.

Figure 4 shows the load as a function of the number of cycles to failure of the D8 joint adjusted to an R of 1.9–2.4. The maximum tensile shear load (i.e., the 107 fatigue limit) was approximately 1.2 kN. Plug fracture of the Al alloy occurred in the low cycle region (Nf < 400,000 cycles), while BM fracture with Al alloy as the starting point was seen in the high cycle region (Nf > 400,000 cycles). The plug fracture in the low cycle region was probably because the fracture mode was similar to the static test due to the high loading. Under the optimal processing conditions, the joint did not undergo BI fracture and the strength of the BM was demonstrated. For future research, it is necessary to check how the fatigue strength changes compared to other D and R conditions and whether the fatigue strength is maximized at the optimum static strength condition.

Figure 5(a) and (b) show the effects of pressing speed, that is the override, on the R and peak pressing load, respectively. The values in parentheses in Fig. 5(a) indicate the maximum tensile shear load of joint. Since it is a displacement control, the pressing speed barely affects R, and has almost no effect on joint strength. While, the peak pressing load tended to decrease slightly as the pressing speed increased (Fig. 5(b)). Since it is a crank motion, the slide speed is almost zero at the bottom dead center, when is the peak load. Thus, it is thought that there was no significant difference in the load for such the thin plates. The reason for the decreasing trend is not clear, but what is clear is that the pressing speed of crank motion had almost no effect on the R, which controls the joint strength and strongly affects the peak pressing load. In this experiment, the optimal conditions (D, R) were determined by fixing the override 50%, but in actual production, the processing speed can be increased by strictly controlling the R.
Since this bonding mechanism is a diffusion bonding, the interfacial reaction proceeds depending on the bonding temperature and its holding time. However, as a preliminary step, the most important factor in this bonding process is how to efficiently and reliably create an appropriate bonding surface, i.e., new surface, through plastic flow. R is a direct indicator of plastic deformation. Therefore, R has a strong influence on the transition point to BM fracture. In this study, the simple flat punch shape was used, but it is thought that the plastic flow is not uniform within the bonding interface. In the future, optimization of the punch shape through plastic flow and stress analyses will be considered in order to obtain better joint strength, for example, to obtain BM fracture even at low R. In addition, to improve the strength of the joint at the BM fracture, measures to reduce the stress concentration, such as flatting the welding point by re-pressing it after joining, can be considered.
Figure 6(a) shows an OM image of the joint cross-section, obtained under the optimal conditions (D8, R1.9) with the override of 50%. The cross-sectional shape was similar to the previous results of SPCC/A508311) and SPFC980/A5083.12) A metallurgical surface joint, never a clinching mechanism, was seen and the joint edge was relatively thinned by edge load. There were no defects such as tears or cracks. Since the amount of indentation is transferred to the height of the pressing jig (Fig. 1(c)), it would be possible to make a flat plate by changing the height of the jig or by using a pressure mechanism that applies back pressure after joining. Figure 6(b) and (c) show an inverse pole figure (IPF) with image quality (IQ) maps of SUS304 and A5083 obtained by EBSD, respectively, before joining. Figure 6(d) and (e) show an IPF with IQ map and the kernel average misorientation (KAM) map, respectively, after forge welding. The EBSD measurement pitch for the before and after welding were 1 µm and 0.5 µm, respectively. In the KAM map, confidence index lower than 0.1 are displayed in black. In SUS304, grains became finer with increasing proximity to the bonding interface. In A5083, grains became finer with increasing proximity to the bonding interface and back surface. The progression of this dynamic recrystallization is illustrated by the KAM map. As described above, plastic flow is greater at the bonding interface. With this method, removal of the contaminated layer, which is indispensable for solid-phase bonding, can be done efficiently on the bonding surface.

Figure 7(a) shows a SEM backscattered electron image of the center cross-section of the bonded interface. In contrast to ordinary steel11) and high-tensile strength steel,12) iron oxide with a thickness on the order of micrometers is not present. Figure 7(b) and (c) show elemental mappings and concentration profiles of the boundary, obtained by EPMA. There is almost no O peak at the boundary. For SUS, soundness of the bonding interface can easily be ensured, including during bonding via preheating. Moreover, an RL (i.e., an IMC on the order of micrometers) is not formed at the bonded interface.

Figure 8(a) shows a TEM bright-field image of the bonded interface. An RL with a thickness of approximately 10 nm was observed, is similar to that reported previously with Fe/Al spot forge-welding.11,12) A very thin and relatively uniform RL provides the high-strength bonding that characterizes this method. The growth of the reaction-diffusion layer in Fe/Al can be described by the following parabolic law:13)
| \begin{equation}
d = \sqrt{Kt}
\end{equation}
| (1) |
| \begin{equation}
K = K_{0}\exp \left(\frac{-Q}{RT}\right)
\end{equation}
| (2) |
Here,
d is the thickness of the reaction-diffusion layer (i.e., IMC),
t is the heating time,
K is the reaction rate constant,
K0 is the frequency factor (5.68 × 10
−2 m
2/s for Fe/A5052),
14) Q is the activation energy (176 kJ/mol for Fe/A5052),
14) R is the gas constant, and
T is the bonding interface temperature. A temperature of 703 K (430°C) was used in this experiment; the other bonding temperatures were 873 K (600°C; i.e., approximate melting point of Al alloy) and 1,073 K (800°C).
Figure 8(b) shows the growth of the IMC by bonding time. The IMC grew by approximately 19 nm under the experimental conditions. This value is roughly in agreement with the observed RL thickness. The IMC causes a large decrease in Fe/Al strength. The time until the IMC grows to critical thickness of 1 µm was 0.07 s at 1,073 K and 0.6 s at 873 K. In contrast, a temperature of 703 K was maintained for approximately 330 s, which is several orders of magnitude greater than the other calculated values. Conventional method, such as resistance spot welding, requires greater heat input because it do not produce a new surface like the forge welding. Therefore, IMC growth is rapid and difficult to suppress. The method in this study is a relatively low temperature process, where a large load is applied to form a new surface on the bonding interface by plastic flow. It is clear that this process has a very large time margin for controlling the IMC. The current findings indicate that, due to good control of IMC formation, spot forge-welding is a nearly IMC-free bonding method.
15,16)
4. Conclusions
In summary, SUS304 and A5083 sheets were lap-bonded using the spot forge-welding method, and high-strength bonding was achieved via an extremely rapid, high-productivity process (bonding time less than 0.1 s). The effects of R and pressure on the tensile shear load of the joint were investigated for three different punch D, and the optimal conditions were determined. Using this method, the tensile shear load of the joint reached 4.5 kN, and the BM experienced fatigue fracture. A new surface was formed at the bonding interface due to plastic flow, and an extremely thin (approximately 10 nm) and uniform RL was observed. The mesoscopic region had a much thinner RL than that produced by other methods currently under investigation, with no reduction in strength. The theoretical verification of the Fe/Al reaction-diffusion layer also demonstrated the utility of RL suppression. A high-quality surface formed rapidly at low temperature, thus providing a high-quality interface. By reproducing this bonding mechanism at the bonding interface, next-generation solid-phase bonding can be achieved, allowing for multi-materialization of transportation vehicles.
Acknowledgement
This work was supported by JSPS KAKENHI Grant Number JP20K05110.
REFERENCES
- 1) A. Hirose, H. Imaeda, M. Kondo and K.F. Kobayashi: Mater. Sci. Forum 539–543 (2007) 3888–3893.
- 2) K. Martinsen, S.J. Hu and B.E. Carlson: CIRP Ann. Manuf. Technol. 64 (2015) 679–699.
- 3) Y.F. Sun, H. Fujii, N. Nakata and Y. Okitsu: Mater. Des. 47 (2013) 350–357.
- 4) J.M. Piccini and H.G. Svoboda: Procedia Mater. Sci. 9 (2015) 504–513.
- 5) J. Sun, Q. Yan, W. Gao and J. Huang: Mater. Des. 83 (2015) 120–128.
- 6) Y. Zhang, G. Guo, F. Li, G. Wang and H. Wei: J. Mater. Process. Technol. 246 (2017) 313–320.
- 7) G. Zhang, W. Su, J. Zhang and Z. Wei: Metall. Mater. Trans. A 42 (2011) 2850–2861.
- 8) E.H. Kim, H. Fujii, J.H. Kim and K.H. Song: Mater. Trans. 59 (2018) 503–506.
- 9) K. Ueda, T. Ogura, S. Nishiuchi, K. Miyamoto, T. Nanbu and A. Hirose: Mater. Trans. 52 (2011) 967–973.
- 10) K. Tanaka, Y. Sugimoto and K. Nishiguchi: Mazda Tech., Rep. 33 (2016) 124–129.
- 11) H. Yamagishi: Mater. Lett. 278 (2020) 128412.
- 12) H. Yamagishi: Metall. Mater. Trans. A 52 (2021) 741–752.
- 13) K. Shibata, S. Morozumi and N. Kouda: J. Japan Inst. Met. Mater. 30 (1966) 382–388.
- 14) H. Oikawa, T. Saitou, T. Nagata and T. Kiriyama: Tetsu-to-Hagané 83 (1997) 641–646.
- 15) H. Yamagishi: Pat./Mar./JP2020/2020057748.
- 16) H. Yamagishi: Pat./Jan./PCT/JP2021/003018.


