Engineering Materials and Their Applications
Effect of Area Ratio on the Galvanic Corrosion of AZX611 Magnesium Alloy/A6N01 Aluminum Alloy Joint
2021 Volume 62 Issue 12 Pages 1764-1770
Details
2021 Volume 62 Issue 12 Pages 1764-1770
Galvanic corrosion at the joint of AZX611 magnesium (anode) and A6N01 aluminum (cathode) in 1 mass% NaCl solution with different cathode/anode area ratios was evaluated. The galvanic potential was different depending on the area ratio. The anode galvanic current density increased with increasing the area ratio. Anode and cathode weight loss corrosion rates, and the average of anode current densities, were linearly related to the logarithm of the area ratio with different slopes. Scanning vibration electrode technology (SVET) has exhibited the presence of anode current spots that increased with the area ratio. Surface profile of the galvanic joint was in good agreement with the SVET results. The obtained effect of cathode/anode area ratio was analyzed by the mixed potential theory. Finally, the compatibility of magnesium/aluminum joint was compared with other dissimilar metal joints.
This Paper was Originally Published in Japanese in J. JILM 71 (2021) 82–88.

Fig. 4 Effect of area ratio of AZX611/A6N01 joint A on the corrosion rates of AZX611 and A6N01, and the average galvanic current density to AZX611 in 1 mass% NaCl solution.
Mg alloys are chemically active materials susceptible to corrosion. However, under an atmospheric exposure environment, a stable oxide film containing carbonate is formed, which decreases the corrosion rate (approximately 0.01 to 0.02 mmy−1).1) With the development of various surface technologies for further corrosion resistance, Mg alloys have been widely applied to housings for mobile devices and automobile components. Although such adequate resistance is ensured if they are used stand-alone, Mg alloys tend to suffer severe galvanic corrosions owing to their lower corrosion potentials compared to other metals (>500 mV), in which Mg alloys act as anodes.2,3)
One of the measures to reduce the galvanic corrosion is to select compatible materials. Al alloys are lightweight metals next to Mg alloys. The difference in corrosion potential from Mg is smaller than that of steel, which is preferable as a counterpart for Mg alloys. However, as the corrosion potential of Al alloys is decreased by contact with Mg alloys (usually beneficial for most metals as a cathodic protection), Al alloys tend to provoke “cathodic corrosion”, accompanied by hydrogen gas generation, as a result of the increasing surface pH due to the cathode reaction.4–6) Simultaneously, Mg alloys start to dissolve with a phenomenon referred to as negative difference effect (NDE) under anodic polarization conditions with the accelerated hydrogen generation reaction.7–10) In summary, Mg alloy/Al alloy galvanic corrosion undergoes a unique phenomenon in which the dissolution of the two alloys is accelerated, accompanied by hydrogen gas evolution on both surfaces. We investigated the effect of NaCl concentration on the galvanic corrosion of AZX611 magnesium alloy/6005C (A6N01) aluminum alloy joints using electrochemical methods, including a scanning vibration electrode technique (SVET).11) The AZX611 alloy corroded locally, whereas the A6N01 alloy exhibited a uniform corrosion. The critical chloride concentration, which is an index of the passivation-active corrosion of the AZX611 alloy, largely affected the galvanic behavior.
In galvanic corrosion, the cathode/anode area ratio is as important as the selection of joint metals.3,12–14) A larger area ratio leads to a more significant corrosion at the anode, which leads to problems when corrosion prevention measures such as painting at the fastening part are incomplete. Few studies have been carried out regarding the effect of the area ratio on the galvanic corrosion of magnesium. Song et al.13) investigated the effect of the area ratio on the galvanic corrosion of an AZ91D magnesium alloy with zinc, Al380 aluminum alloy, and 4150 steel under a 5% salt spray environment (up to three times the area ratio for the Al380 alloy). The corrosion acceleration due to the increase in area ratio was lower in the Al380 alloy than in the 4150 steel. Banjade et al.14) measured the galvanic potential/current of a 99.95% Mg hollow cylinder/steel rod with area ratios of 5.5, 14.4, and 26.8 in a 5-mass% NaCl solution for 10 min. The dissolution rate of Mg was accelerated at higher area ratios.
In this study, we evaluated the galvanic corrosion behavior of an AZX611 alloy/A6N01 alloy joint in a 1-mass% NaCl solution by varying the area ratio in the range of 0.1–9. By comparing the results obtained with conventional galvanic corrosion studies, including steel/aluminum, the unique nature of the present corrosion system was demonstrated.
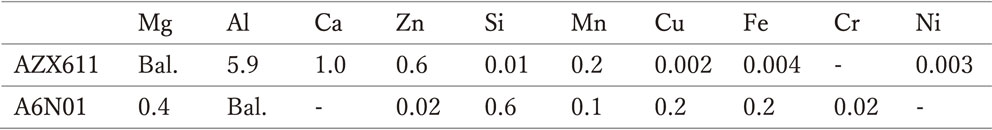
An AZX611 magnesium alloy and A6N01 aluminum alloy, both extruded to a thickness of 3 mm, were used as test samples. Hereinafter, the former is referred to as anode, while the latter as cathode. The chemical compositions are listed in Table 1. Two types of joints, denoted as Joint A and Joint B, shown in Fig. 1, were used in this study. For joint A, the sample surface was polished with a SiC paper up to No. 1000, rinsed with pure water, and degreased with ethanol. The testing area was regulated to 1, 3.14, and 9 cm2 using a Teflon sample holder or adhesive tape. The cathode area (Sc)/anode area (Sa) ratio was selected to be 0.11, 0.32, 1.00, 3.14, and 9.00, by combining an appropriate counterpart, face to face with a distance of 5 mm. In joint B, the test samples had a common length of 20 mm, while the width was set as 4, 7, 10, 13, and 16 mm so that the total testing width was fixed at 20 mm. The ratio Sc/Sa was set to 0.25, 0.54, 1.00, 1.86, and 4.00. A silicon insulating sheet with a width of 0.1 mm was sandwiched between the joints and electrical codes were attached to the back surfaces. The joint was then embedded in a setting resin, followed by treatment of the test surface in the same manner as for joint A.

Schematic diagram of experimental setup.
The test solution was prepared by dissolving an analytical-grade NaCl in pure water to a 1-mass% solution. The pH was adjusted to approximately 10 by dissolving an analytical-grade Mg (OH)2. The conductivity (ρ) of the solution was 1.76 S m−1. The total amount of the test solution in the cell was 400 mL (for the evaluation with joint A) or 800 mL (for the evaluation with joint B).
The galvanic current (Igal) between the anode and cathode and galvanic potential (Egal) were measured with a zero-resistance ammeter and electrometer (both equipped in Princeton Applied Research VersaSTAT3), respectively. For the measurement of Egal, silver/silver chloride (Ag/AgCl) was used as a reference electrode, which was inserted in the gap of joint A using a capillary. The measurements were performed for 24 h. The average (Igal.ave) was calculated by the time integral of the measured Igal.
After the test, the corrosion products of each alloy were removed according to JIS Z 2371 (2015). For joint A, the average corrosion rates (icorr.a, icorr.c) of the anode and cathode were calculated by the amount of weight loss according to the Faraday’s law, assuming that Mg in the AZX611 alloy dissolves in divalent and that Al in the A6N01 alloy dissolves in trivalent. To simulate the galvanic corrosion behavior, a potentiostatic measurement of the current response (ip) of the anode and cathode held at a potential (Ep) in the range of Egal was carried out.
A commercial SVET system (Princeton Applied Research VersaSCAN) was used for the SVET study. Joint B was placed horizontally, 5 mm below the test solution level. The SVET probe consisted of an insulated platinum wire with a tip diameter of approximately 20 µm positioned 100 µm above the sample surface. The Sc + Sa (= 400 mm2) region was scanned in 0.5 × 0.5 mm2 steps with a vibrating amplitude of 40 µm. For details of the measurement and calibration, please refer to the previous study.11) During the 24-h experimental period, SVET measurements were carried out every 3 h. The duration of the measurements was 75 min. After removing the corrosion products of joints A and B, the profiles of the galvanic joint surfaces were measured using a three-dimensional optical profiler (Keyence VR-5200).
All experiments were carried out at an ambient temperature of 21 ± 2°C. The solution was not stirred. Each test was repeated at least twice to ensure reproducibility. Hereinafter, when current is mentioned, anode current is positive, while cathode current is negative.
Figure 2 shows the time change in the galvanic potential Egal of joint A. At the initial stage of immersion, a larger Sc/Sa led to a nobler Egal. After 24 h, the values became stable in the range of −1.43 to −1.47 V and the correlation with the area ratio became weaker. Figure 3 shows the current density Igal/Sa obtained by dividing the galvanic current by Sa. It was smallest at Sc/Sa = 0.11 and increased with Sc/Sa. All of them tended to decrease after reaching their maxima within 1–2 h from the start of the testing. A larger Sc/Sa led to a shorter time to reach the maximum and faster Igal/Sa decrease.

Time evolution of the galvanic potential of AZX611/A6N01 joint A with different area ratio in 1 mass% NaCl.

Time evolution of the galvanic current to AZX611 at AZX611/A6N01 joint A with different area ratio in 1 mass% NaCl.
Figure 4 presents the area ratio dependence of the weight loss corrosion rates of the anode and cathode, icorr.a, icorr.c, and Igal.ave/Sa, which is the average of the galvanic current divided by the anode area Sa. icorr.a and icorr.c changed monotonically with the change in Sc/Sa. The area ratio affected the corrosion rate of both cathode and anode. All parameters exhibited a linear relationship with the logarithm of the area ratio, with a correlation coefficient R2 of 0.95 or higher. Although it is not shown in the figure, Igal.ave/Sc obtained by dividing the galvanic current by the cathode area also exhibited a linear relationship with a negative gradient.

Effect of area ratio of AZX611/A6N01 joint A on the corrosion rates of AZX611 and A6N01, and the average galvanic current density to AZX611 in 1 mass% NaCl solution.
As shown in Fig. 2, the galvanic potential Egal after 24 h is within the range of −1.43 to −1.47 V in most cases. The current responses ip when the anode or cathode was held at the constant potential Ep of −1.43, −1.45, and −1.47 V were then measured. The results are shown in Fig. 5. At the anode, ip reached a maximum within 1 h, and then decreased, with a trajectory similar to that of the galvanic current in Fig. 3. A higher Ep led to a larger current after 10 h. ip at Ep = −1.47 V continued to decrease over time and had a negative value after 18 h. At the cathode, ip reached a maximum at 2–5 h after the start of the test. A higher Ep led to a smaller ip. However, the decrease at Ep = −1.47 V to −1.45 V was approximately 100 µA cm−2, while it reached approximately 300 µA cm−2 at Ep = −1.45 V to −1.43 V. At Ep = −1.45 V, both anode and cathode exhibited |ip| = 400–500 µA cm−2. This value is almost equal to Igal/Sa at Sc/Sa = 1.00, as shown in Fig. 3.

Evolution of current response with time of AZX611 and A6N01 for 24 h potentiostatic polarization at different potentials in 1 mass% NaCl; (a) AZX611, (b) A6N01.
Figure 6 shows the time change in the SVET current at Sc/Sa = 1.86. The colored part with red indicates the anode region, while the colored part with blue indicates the cathode region, shown together with their isocurrent density lines. In both cases, higher current densities are observed at the boundary. In contrast to the relatively uniform distribution at the cathode, there are regions that reach 2000 µA cm−2 locally at the anode. Moreover, its position changed over time. During the test, the sample surface was observed to determine the hydrogen gas generated on the entire surface of the cathode, whereas filiform-type corrosion was observed at the anode with hydrogen gas generated at the tip of the filament. Wang et al.15) evaluated the filiform corrosion of a Mg–Zn alloy in a 2.5-mM NaCl solution by SVET and reported that the tip of the filament is the anode. After 24 h, a region exhibiting white or its opposite color was generated on both anode and cathode, suggesting that the polarity involved in galvanic corrosion has changed in this section.

SVET current map of AZX611/A6N01 joint B with area ratio of 1.86 in 1 mass% NaCl after; (a) 6 h, (b) 12 h, and (c) 24 h. Electrodes are separated by an insulator located at X = 13 mm. Blue and red colors denote the positive and negative current, respectively.
Figure 7 shows the SVET current distribution after 24 h of joint B, where Sc/Sa was changed to 0.25, 1.00, and 4.00. The anode current at Sc/Sa = 0.25 is concentrated near the boundary. The region where white or light blue current is hardly detected occupies the outside. However, there is still a local region with a current density of 2000 µA cm−2. At Sc/Sa = 4.00, where the cathode occupies a large proportion, the entire anode is red, but no region where the current density exceeds 3000 µA cm−2 is observed.

SVET current map of AZX611/A6N01 joint B in 1 mass% NaCl after 24 h with area ratio of; (a) 0.25, (b) 1.00, and (c) 4.00. Electrodes are separated by an insulator located at X = 4, 10, 16 mm, respectively. Blue and red colors denote the positive and negative current, respectively.
Figure 8 shows the surface profile of joint B after the test at Sc/Sa = 0.25, 1.00, and 4.00. The color tone corresponds to the depth. The minimum at the scale indicates the maximum corrosion depth of the test material. The distribution of corrosion depth corresponds well with the results of the SVET measurement in Fig. 7. At Sc/Sa = 0.25, a local corrosion area was observed even in a region slightly distant from the cathode/anode boundary. Ten cross-sectional profiles at intervals of 2 mm perpendicular to the joint surface were measured. Their average values are shown in Fig. 9. The largest anode corrosion depth was obtained at Sc/Sa = 1.00. The joint with Sc/Sa = 4.00 exhibits a smaller value than that at Sc/Sa = 1.00, regardless of its high area ratio. The depth at the cathode section was approximately 0.03–0.07 mm, indicating a uniform dissolution.

Surface profile of AZX611/A6N01 joint B in 1 mass% NaCl after 24 h with area ratio of; (a) 0.25, (b) 1.00, and (c) 4.00. Arrows indicate the position of an insulator.

Average depth profiles of AZX611/A6N01 joint B in 1 mass% NaCl after 24 h with different area ratio. Arrow indicates the position of an insulator.
The values of Egal and Igal at the area ratio Sc/Sa = 1 are approximately located at the intersection of the experimentally obtained anode and cathode polarization curves.11) Mansfeld12) classified the effect of area ratio on galvanic corrosion into three cases based on the fundamental mixed potential theory. Case 1 represents the state in which only the anode reaction occurs on the anode and only the cathode reaction occurs on the cathode, both of which exhibit the Tafel behavior. In case 2, the anode is slightly polarized from its corrosion potential. In this case, the cathode reaction on the anode cannot be ignored and Igal/Sa ≠ icorr.a. The corrosion potential of AZX611 in the 1-mass% NaCl solution is approximately −1.52 V,11) while the difference from Egal shown in Fig. 2 is approximately 0.07 V, which meets the conditions of case 2. According to Mansfeld, the galvanic current Igal/Sa and anode corrosion rate icorr.a have the following relationship with the area ratio Sa/Sc,
| \begin{equation} \log I_{\textit{gal}}/S_{a} = \log i_{\textit{corr.a}} - \log(1 + i_{\textit{oc.a}}\cdot S_{a}/i_{\textit{oc.c}}\cdot S_{c}), \end{equation} | (1) |
| \begin{equation} i_{\textit{corr.a}}/(I_{\textit{gal}}/S_{a}) = 1 + (i_{\textit{oc.a}}/i_{\textit{oc.c}}) \times (S_{a}/S_{c}). \end{equation} | (2) |
We analyze the results in Fig. 4. According to eq. (1), Igal/Sa is a logarithmic function of the term (1 + Sa/Sc), including the area ratio, but it also depends on icorr.a. According to the mixed potential theory, icorr.a and icorr.c are a function of the difference between each standard electrode potential and galvanic potential and Tafel slope.12) As shown in Fig. 2, the initial Egal depends on Sa/Sc, but it changes with time. Furthermore, the current densities in Fig. 4 are the time integrals for 24 h. Although Sa/Sc influences Igal.ave/Sa and icorr.a in a complex manner, the resultant linear relationship shown in Fig. 4 is valid not only for Igal.ave/Sa and icorr.a, but also for icorr.c and Igal.ave/Sc in the cathodic corrosion.
The substitution of the results of Igal.ave/Sa and icorr.a in Fig. 4 into eq. (2) yields the linear behavior shown in Fig. 10. The ioc.a/ioc.c ratio was calculated to be 0.24. Seri et al.16) reported that ioc associated with the reduction reaction of water in the A1050 alloy in a 0.1-mol dm−3 NaCl solution was 3–4 µA cm−2. Frankel et al.17) reported ioc of 4 µA cm−2 in a 0.1-mol dm−3 NaCl solution of 99.99% Mg. By substituting these values, ioc.a/ioc.c = 1–1.3 is calculated. Considering that ioc depends on the alloy constituent, there is a good consistency with eq. (2). There seem to be few cases of galvanic corrosion corresponding to case 2 other than magnesium.18) To the best of our knowledge, the results in Fig. 10 are the first example to demonstrate that eq. (2) is valid in the galvanic corrosion system of case 2.

Relation between the surface area ratio and the weight loss corrosion rate of AZX611 divided by galvanic current to AZX611.
Mansfeld discussed case 3 (catchment area principle) in detail. In this case,
| \begin{equation} i_{\textit{corr.a}} = i_{L}{}^{\text{O}_{2}} (1 + S_{c}/S_{a}) \end{equation} | (3) |
Generally, the effect of the area ratio on the galvanic corrosion appears as a change in galvanic current/potential. In the case of the present corrosion system, the impact on Egal was observed in the initial stage of immersion. After 24 h, all values of Egal were within the range of −1.43 to −1.47 V, regardless of the area ratio. As shown in Fig. 5, the anode and cathode currents changed significantly within this potential range. The large potential dependence of the anode is explained as magnesium is a non-polarizable metal10) (the Tafel gradient ba is extremely small). However, the negative ip after 10 h at Ep = −1.47 V is unusual, considering that the corrosion potential is −1.52 V. Other studies8,9,16) demonstrated that the anode current exhibits a maximum at the initial stage of immersion, as shown in Fig. 3, and that polarity reversal occurs with time when the anode is polarized at a constant potential, similar to the results in Fig. 5(a). These phenomena are interpreted by an increase in the number of cathode sites. The content of Fe-based impurities in the magnesium alloy is considered to increase once they are dissolved, following the reduced precipitation on the magnesium surface, which act as new local cathodes. In addition, the magnitude of the maximum depends on the potential and type of anions/cations in the solution. The stability of the Mg (OH)2 film on the surface is also influential.9)
At the cathode, the change in the constant potential Ep from −1.45 to −1.43 V caused a large decrease in the current |ip| from 315 to 45 µA cm−2. The gradient obtained from these values is −24 mV/decade, which is significantly different from the cathodic Tafel gradient (bc) of −110 mV/decade11) for A6N01. Ogle et al.6) reported that excess hydroxide ions (OH−) or electrode potential lower than −1.4 V are required to cause cathodic corrosion of Al. This suggests a threshold potential in the cathodic corrosion of Al and its alloys. The increase in Sc/Sa increases Egal, which approaches the threshold and suppresses the cathodic corrosion. This behavior is quite different from the galvanic behavior in case 3, in which the cathode reaction attains the limiting diffusion current of O2 and leads to a constant value of $i_{L}{}^{\text{O}_{2}}$ even if Egal fluctuates.
The average corrosion depth of the anode attains the maximum at Sc/Sa of 1 (Fig. 9). Although not shown in this article, the galvanic current Igal in joint B was also measured, yielding the same result. When Sc/Sa > 1, Egal increases to suppress the above-mentioned cathodic corrosion. Furthermore, because of the non-polarizable nature of the anode, Egal does not change considerably even when Sc/Sa < 1; hence, the acceleration of the cathodic corrosion by the reduction in the potential is limited. In addition, the initial occurrence of cathode sites did not reduce Egal to the level of the corrosion potential. This helps understand the effect of the area ratio on the corrosion behavior in a qualitative manner, whereas the reason for the maximum at Sc/Sa = 1 cannot be identified. This phenomenon occurs only, if in the configuration of joint B (Sa + Sc is constant), the Tafel slopes of the anode and cathode are equal (ba = |bc|) in the Mansfeld’s classification (case 1). As the present corrosion system does not belong to case 1 or ba ≠ |bc|, this should be further investigated.
The galvanic corrosion of Mg alloys in contact with Al alloys does not cause a severe damage, in contrast to carbon steels. This can be explained by their relatively close corrosion potentials and values of ioc.a/ioc.c close to 1, indicating that the cathode characteristics are similar. Thus, the Al alloy is a compatible material for the Mg alloy. However, as the cathode reaction that constitutes the galvanic corrosion is the hydrogen generation reaction, it is always necessary to consider the possibility that the corrosion would be largely accelerated by the chloride concentration and temperature.
This paper is based on the results obtained from a future pioneering program (innovative structural materials project) commissioned by the New Energy and Industrial Technology Development Organization (NEDO).