Abstract
The standard Gibbs energies of formation, ΔfGo, of CrB4, CrB2, Cr3B4, Cr5B3, and CrBO3 existing along the oxidation path of Cr–B binary alloy were determined using the electromotive forces of galvanic cell composed of the ZrO2–Y2O3 solid electrolyte. The electromotive force showed plateaus and decreases in the process that CrB4–CrB2 two-phase alloy used for the cell materials were oxidized via two- and three-phase regions along its oxidation path. From the plateaus of electromotive forces corresponding to the cell materials in the three-phase regions, the values of ΔfGo(CrB4), ΔfGo(CrB2), ΔfGo(Cr3B4), ΔfGo(Cr5B3), and ΔfGo(CrBO3) in the temperature range from 1273 to 1346 K were determined as follows:
ΔfGo(CrB4)/J (mol of compd.)−1 = 167500 − 261.2 T ± 7200
ΔfGo(CrB2)/J (mol of compd.)−1 = −21020 − 79.22 T ± 2100
ΔfGo(Cr3B4)/J (mol of compd.)−1 = −173400 − 95.47 T ± 2500
ΔfGo(Cr5B3)/J (mol of compd.)−1 = −318900 + 20.64 T ± 5800
ΔfGo(CrBO3)/J (mol of compd.)−1 = −958800 + 59.24 T ± 4100
The ΔfGo values determined in the present study satisfied the phase equilibria in the Cr–B binary system. Using the determined ΔfGo values, the composition-oxygen partial pressure diagram of the Cr–B–O system was constructed under the conditions at 1300 K and a total pressure of 1 bar (100 kPa). It is useful to understand the oxidation property of the Cr–B binary alloys.
1. Introduction
The Cr–B binary system is a fundamental system of the Ni-based corrosion and heat resistance alloys composed of Ni, Cr, Fe, Mo, W, Si, B, and so on.1–5) To evaluate the structure of the high-temperature oxidation films over the Cr–B binary alloy from the viewpoint of chemical thermodynamics, it is useful to construct the composition-equilibrium partial oxygen pressure, $p_{\text{O}_{2}}$, diagram which visualizes the relationships between the phases existed on the oxidation path and their $p_{\text{O}_{2}}$ values.6,7) In our previous studies, the composition-$p_{\text{O}_{2}}$ diagrams of the Ni–B–O,8) Mo–B–O,9) and W–B–O10) ternary systems were constructed on the basis of the standard Gibbs energies of formation, ΔfGo, determined by the electromotive force (EMF) measurements using the ZrO2–Y2O3 solid electrolyte. In the present study, the ΔfGo values of the intermediate compounds in the Cr–B–O ternary system were determined to construct the composition-$p_{\text{O}_{2}}$ diagram of the Cr–B–O ternary system.
There exist six stoichiometric compounds, namely, CrB4, CrB2, Cr3B4, CrB, Cr5B3, and Cr2B in the Cr–B binary system,11) Cr2O3 in the Cr–O binary system,12) B2O3 in the B–O binary system,13) and CrBO3 in the Cr–B–O ternary system14,15) at the experimental conditions in the present study. The thermodynamic properties of Cr2O316,17) and B2O318,19) are listed on the thermodynamic tables, however, those for the Cr–B binary system are limited. Barin20) listed the heat capacities, the third law enthalpies, and the ΔfGo values of CrB and CrB2 in the thermodynamic tables, however, the information regarding how and why the values were selected was not provided. Topor and Kleppa21) used high-temperature drop solution calorimetry to determine the standard enthalpies of formation of CrB2 at 298 K, ΔfHo298(CrB2), by allowing the borides to react with Pt, Pd, or Ni to form liquid alloys: ΔfHo298(CrB2) = −119.4 ± 3.4 kJ (mol of compd.)−1. Liao and Spear22) assessed the phase diagram of the Cr–B binary system based on the invariant points, crystal structure, and lattice parameter data of Andersson and Lundstrom,23) Portnoi et al.,24,25) and Guy and Uraz,26) and calculated the phase diagram by using the optimized ΔfGo values of chromium borides and the realistic empirical expression for the excess Gibbs energy of the liquid phase, not describing which data were used to optimize. The optimized value of ΔfHo(CrB2) = −124.2 kJ (mol of compd.)−1 by Liao et al. was in good agreement with the experimental value by Topor and Kleppa21) mentioned above and the estimated value by Brewer and Haraldsen:27) ΔfHo(CrB2) = −126 kJ (mol of compd.)−1. There is little experimental information for the ΔfGo values of chromium borides.
In our recent study,15) the phase relationships for the Cr–B–O ternary system were clarified experimentally to conduct the electromotive force (EMF) measurement using a ZrO2–Y2O3 solid electrolyte and the ΔfGo values of Cr3B4, CrB2, and CrB4 in the boron-rich side of the Cr–B binary system were determined. According to the phase relationships, the Cr–B binary alloy is oxidized via two- and three-phase regions alternately along the oxidation path. In the EMF method used in our previous studies,9,10,15,28,29) the EMFs derived from the $p_{\text{O}_{2}}$ values of the cell materials in the three-phase region involving the target substances were measured under the well-deoxidized argon atmosphere. The EMF measurement for determining the ΔfGo value of target substance is reasonable as long as the cell materials remain within the initial three-phase region. In other words, the life time of the cell is until the cell materials are oxidized to the subsequent two-phase region. When the $p_{\text{O}_{2}}$ is low or the activation energy of oxidation of the cell materials is low, it makes the oxidation rate of cell materials high and shortens the life time of the cell. However, it may be possible to obtain the EMF information on materials with high oxidation rates by measuring the change in EMF corresponding to the oxidation process of the cell materials. In the present EMF measurement, the oxidation process of the Cr–B binary alloy used in the cell materials was measured as the change in EMF and $p_{\text{O}_{2}}$ with time. In the present study, the ΔfGo values of CrB4, CrB2, Cr3B4, Cr5B3, and CrBO3 in the Cr–B–O ternary system were determined on the basis of the change in EMF with time for the oxidation process of the Cr–B binary alloy, and the composition-$p_{\text{O}_{2}}$ diagrams of the Cr–B–O ternary system were constructed.
2. Experimental Procedure
2.1 Preparation of cell materials
Figure 1 shows the phase relationships for the Cr–B–O ternary system at 1273 K determined in our previous study.15) There are following 11 three-phase equilibria in the Cr–B–O ternary system: CrB2–CrB4–B2O3; Cr3B4–CrB2–B2O3; CrB–Cr3B4–B2O3; Cr5B3–CrB–B2O3; Cr5B3–CrBO3–B2O3; Cr2B–Cr5B3–CrBO3; Cr2B–Cr2O3–CrBO3; Cr–Cr2B–Cr2O3; CrB4–B–B2O3; CrBO3–B2O3–O2; CrBO3–Cr2O3–O2. The oxidation path of the 25.0 mol%Cr–75.0 mol%B binary alloy (CrB2–CrB4 two-phase alloy) are shown as a dotted line in Fig. 1. The CrB2–CrB4 two-phase alloy is oxidized to CrBO3 and B2O3 via two- and three-phase regions in the following order: (1) CrB2–CrB4–B2O3, CrB2–B2O3, (2) Cr3B4–CrB2–B2O3, Cr3B4–B2O3, (3) CrB–Cr3B4–B2O3, CrB–B2O3, (4) Cr5B3–CrB–B2O3, Cr5B3–B2O3, (5) Cr5B3–CrBO3–B2O3. To measure the EMF corresponding to the oxidation of CrB2–CrB4 two-phase alloy, the following galvanic cell was constructed:
| \begin{equation}
\text{Cell: W $|$ CrB$_{2}$, CrB$_{4}$, B$_{2}$O$_{3}{}|$ YSZ(8) $|$ O$_{\text{2 in air}}{}|$ Pt},
\end{equation}
| (1) |
where YSZ(8) is one end-closed tube composed of ZrO
2 solid electrolyte stabilized by 8 mol% Y
2O
3 (outer diameter: 13 mm, inner diameter: 9 mm, length: 300 mm, ZR–8Y, Nikkato Corp., Sakai-shi Osaka Japan). The CrB
2–CrB
4 two-phase alloy was prepared by arc melting using a tungsten electrode and a water cooled copper hearth in an argon atmosphere for the compressed compact of the mixtures of Cr (purity: 99.9 mass%, High Purity Chemical Institute Co., Ltd., Sakado-shi Saitama Japan) and B (purity: 99.5 mass%, High Purity Chemical Institute Co., Ltd., Sakado-shi Saitama Japan) powders in the composition of 25.0 mol%Cr–75.0 mol%B. The two-phase alloy was heat-treated at 1373 K for 1.2 Ms under vacuum and were crushed to fine powders in a mortar with a pestle made of tungsten carbide. The formation of CrB
2–CrB
4 two-phase alloy was confirmed by X-ray diffractometer (Ultima IV, Rigaku Co.). The alloy powders were mixed with 2.5 mol% B
2O
3 (purity: 99.99 mass%, High Purity Chemical Institute Co., Ltd., Sakado-shi Saitama Japan), and used as the cell materials.
2.2 Measurement of electromotive force
Figure 2 shows a schematic diagram of the cell used for the EMF measurement. The total weight of 1.4 g of the cell materials, which was equivalent to the amount that the height of the cell materials in the YSZ(8) tube was approximately 10 mm, was used for the measurement. A tungsten wire (purity: 99.95 mass%, diameter: 0.25 mm, The Nilaco Co., Tokyo Japan) was inserted to the cell materials so that its tip was located in the center of cell materials, and the YSZ(8) tube was sealed with a silicon rubber stopper. The boundary face between the tungsten wire and the cell materials were sealed with the heat-resistant inorganic adhesive (TOAGOSEI Co., Ltd., Tokyo Japan) except for the tip of wire. A platinum wire (purity: 99.98 mass%, diameter: 0.25 mm, The Nilaco Co., Tokyo Japan) was attached to the outer bottom of the YSZ(8) tube using platinum paste (No. 8105, TOKURIKI HONTEN Co., Ltd., Tokyo Japan), and the contact point was placed between the YSZ (8) tube and the porcelain tube and fixed with springs. The cell was vacuumed at 473 K for 60 minutes and heated up to experimental temperature, and filled with argon gas at a flow rate of 30 mL min−1 (ntp) deoxidized and dehydrated by concentrated sulfuric acid, silica gel, and molecular sieve (pore diameter: 0.3 nm, Merck KGaA, Darmstadt Germany). The argon gas replacement was conducted once in the heating process of the cell without careful deoxidation by using titanium mentioned in our previous studies.9,10) The EMF, which was derived from the difference in the oxygen partial pressures between the cell materials and the reference (O2 gas in air), was measured every 5 minutes by a digital multimeter (R6551, ADVANTEST Co., Tokyo Japan) using the tungsten wire and the platinum wire as lead wires, and recorded on a PC connected by the GP-IB interface. The measured EMF values were corrected by subtracting the thermoelectric force generated between tungsten and platinum wires, measured before experiments. The temperature was measured with a platinum/platinum-rhodium thermocouple located at the outer bottom of the YSZ(8) tube. The thermocouple was corrected by measuring the melting points of pure gold and pure aluminum.

According to Schmalzried,30) the value of EMF, E, of the cell using solid electrolyte is expressed as follows:
| \begin{equation}
E = (RT/4F) \ln[p_{\text{O${_{2}}$ in air}}/p_{\text{O${_{2}}$}}]
\end{equation}
| (2) |
where
R,
T,
F, and
$p_{\text{O}_{2}\ \text{in air}}$ are the gas constant, the absolute temperature, the Faraday constant, and the partial oxygen pressure in air, 0.21226 bar (21226 Pa),
31) respectively. Therefore, the values of
$p_{\text{O}_{2}}$ can be known by measuring
E of the cell at the constant temperature.
The cell materials in the cell shown in eq. (1) are oxidized via the following three-phase equilibria in this order along the oxidation path: (1) CrB2–CrB4–B2O3, (2) Cr3B4–CrB2–B2O3, (3) CrB–Cr3B4–B2O3, (4) Cr5B3–CrB–B2O3, (5) Cr5B3–CrBO3–B2O3. These three-condensed phases are in equilibrium with oxygen gas as known from the total cell reactions eqs. (3) through (7) described later in the section “2.4 Calculation Principle of Gibbs Energy of Formation”. According to the phase rule,32) the activity of oxygen, that is, the partial oxygen pressure of the cell materials is invariant at the constant temperature. Therefore, the value of E is constant when the cell materials are in the three-condensed phases.
2.4 Calculation principle of Gibbs energy of formation
When the cell materials are in (1) CrB2–CrB4–B2O3, (2) Cr3B4–CrB2–B2O3, (3) CrB–Cr3B4–B2O3, (4) Cr5B3–CrB–B2O3, and (5) Cr5B3–CrBO3–B2O3 three-phase regions, the total cell reactions of the cell are shown as follows:
| \begin{equation}
\text{(2/3) CrB$_{4}$} + \text{O$_{\text{2 in air}}$} = \text{(2/3) CrB$_{2}$} + \text{(2/3) B$_{2}$O$_{3}$},
\end{equation}
| (3) |
| \begin{equation}
\text{2 CrB$_{2}$} + \text{O$_{\text{2 in air}}$} = \text{(2/3) Cr$_{3}$B$_{4}$} + \text{(2/3) B$_{2}$O$_{3}$},
\end{equation}
| (4) |
| \begin{equation}
\text{(4/3) Cr$_{3}$B$_{4}$} + \text{O$_{\text{2 in air}}$} = \text{4 CrB} + \text{(2/3) B$_{2}$O$_{3}$},
\end{equation}
| (5) |
| \begin{equation}
\text{(10/3) CrB} + \text{O$_{\text{2 in air}}$} = \text{(2/3) Cr$_{5}$B$_{3}$} + \text{(2/3) B$_{2}$O$_{3}$},
\end{equation}
| (6) |
| \begin{equation}
\text{(1/6) Cr$_{5}$B$_{3}$} + \text{(1/6) B$_{2}$O$_{3}$} + \text{O$_{\text{2 in air}}$} = \text{(5/6) CrBO$_{3}$}.
\end{equation}
| (7) |
On the assumption that oxygen gas can be treated as an ideal gas and the solubility of the solid phase in the liquid B
2O
3 phase is negligibly small, the Gibbs energies of cell reactions, Δ
rG, are written as follows:
| \begin{align}
\Delta_{\text{r}}G(1) & = \text{(2/3) $\Delta_{\text{f}}G^{\text{o}}$(CrB$_{2}$)} + \text{(2/3) $\Delta_{\text{f}}G^{\text{o}}$(B$_{2}$O$_{3}$)}\\
&\quad - \text{(2/3) $\Delta_{\text{f}}G^{\text{o}}$(CrB$_{4}$)} - RT\ln(p_{\text{O${_{2}}$ in air}}/p^{\text{o}}),
\end{align}
| (8) |
| \begin{align}
\Delta_{\text{r}}G(2) & = \text{(2/3) $\Delta_{\text{f}}G^{\text{o}}$(Cr$_{3}$B$_{4}$)} + \text{(2/3) $\Delta_{\text{f}}G^{\text{o}}$(B$_{2}$O$_{3}$)}\\
&\quad - \text{2 $\Delta_{\text{f}}G^{\text{o}}$(CrB$_{2}$)} - RT\ln(p_{\text{O${_{2}}$ in air}}/p^{\text{o}}),
\end{align}
| (9) |
| \begin{align}
\Delta_{\text{r}}G(3) & = \text{4 $\Delta_{\text{f}}G^{\text{o}}$(CrB)} + \text{(2/3) $\Delta_{\text{f}}G^{\text{o}}$(B$_{2}$O$_{3}$)}\\
&\quad - \text{(4/3) $\Delta_{\text{f}}G^{\text{o}}$(Cr$_{3}$B$_{4}$)} - RT\ln(p_{\text{O${_{2}}$ in air}}/p^{\text{o}}),
\end{align}
| (10) |
| \begin{align}
\Delta_{\text{r}}G(4) & = \text{(2/3) $\Delta_{\text{f}}G^{\text{o}}$(Cr$_{5}$B$_{3}$)} + \text{(2/3) $\Delta_{\text{f}}G^{\text{o}}$(B$_{2}$O$_{3}$)}\\
&\quad - \text{(10/3) $\Delta_{\text{f}}G^{\text{o}}$(CrB)} - RT\ln(p_{\text{O${_{2}}$ in air}}/p^{\text{o}}),
\end{align}
| (11) |
| \begin{align}
\Delta_{\text{r}}G(5) & = \text{(5/6) $\Delta_{\text{f}}G^{\text{o}}$(CrBO$_{3}$)} - \text{(1/6) $\Delta_{\text{f}}G^{\text{o}}$(Cr$_{5}$B$_{3}$)}\\
&\quad - \text{(1/6) $\Delta_{\text{f}}G^{\text{o}}$(B$_{2}$O$_{3}$)} - RT\ln(p_{\text{O${_{2}}$ in air}}/p^{\text{o}}),
\end{align}
| (12) |
where
po express the standard pressure (1 bar (10
5 Pa)). Under the condition that the transport number of the oxide ion in the solid electrolyte is regarded as unity, Δ
rG = −4
EF for
eqs. (8) through
(12). By determining the values
E(1) through
E(5) for the cell materials in (1) through (5) three-phase regions, the values of Δ
fGo(CrB
4), Δ
fGo(CrB
2), Δ
fGo(Cr
3B
4), Δ
fGo(Cr
5B
3), and Δ
fGo(CrBO
3) are given by the following equations:
| \begin{align}
\text{$\Delta_{\text{f}}G^{\text{o}}$(CrB$_{4}$)} & = 6\ E(1)F + \text{$\Delta_{\text{f}}G^{\text{o}}$(CrB$_{2}$)}+ \text{$\Delta_{\text{f}}G^{\text{o}}$(B$_{2}$O$_{3}$)}\\
&\quad - (3/2)\ RT\ln(p_{\text{O${_{2}}$ in air}}/p^{\text{o}}),
\end{align}
| (13) |
| \begin{align}
\text{$\Delta_{\text{f}}G^{\text{o}}$(CrB$_{2}$)} & = 2\ E(2)F + \text{(1/3) $\Delta_{\text{f}}G^{\text{o}}$(Cr$_{3}$B$_{4}$)}\\
&\quad + \text{(1/3) $\Delta_{\text{f}}G^{\text{o}}$(B$_{2}$O$_{3}$)} \\
&\quad - (1/2)\ RT\ln(p_{\text{O${_{2}}$ in air}}/p^{\text{o}}),
\end{align}
| (14) |
| \begin{align}
\text{$\Delta_{\text{f}}G^{\text{o}}$(Cr$_{3}$B$_{4}$)} & = 3\ E(3)F + \text{3 $\Delta_{\text{f}}G^{\text{o}}$(CrB)}\\
&\quad + \text{(1/2) $\Delta_{\text{f}}G^{\text{o}}$(B$_{2}$O$_{3}$)}\\
&\quad - (3/4)\ RT\ln(p_{\text{O${_{2}}$ in air}}/p^{\text{o}}),
\end{align}
| (15) |
| \begin{align}
\text{$\Delta_{\text{f}}G^{\text{o}}$(Cr$_{5}$B$_{3}$)} & = - 6\ E(4)F + \text{5 $\Delta_{\text{f}}G^{\text{o}}$(CrB)} - \text{$\Delta_{\text{f}}G^{\text{o}}$(B$_{2}$O$_{3}$)} \\
&\quad+ (3/2)\ RT\ln(p_{\text{O${_{2}}$ in air}}/p^{\text{o}}),
\end{align}
| (16) |
| \begin{align}
\text{$\Delta_{\text{f}}G^{\text{o}}$(CrBO$_{3}$)} & = - (24/5)\ E(5)F + \text{(1/5) $\Delta_{\text{f}}G^{\text{o}}$(Cr$_{5}$B$_{3}$)}\\
&\quad + \text{(1/5) $\Delta_{\text{f}}G^{\text{o}}$(B$_{2}$O$_{3}$)} \\
&\quad + (6/5)\ RT\ln(p_{\text{O${_{2}}$ in air}}/p^{\text{o}}).
\end{align}
| (17) |
The values of Δ
fGo(B
2O
3)
18) in the temperature range from 1000 to 1500 K and Δ
fGo(CrB)
20) in the temperature range from 600 to 1200 K were taken from the thermochemical tables and are expressed as linear functions as follows:
| \begin{align}
&\text{$\Delta_{\text{f}}G^{\text{o}}$(B$_{2}$O$_{3}$)/J (mol of compd.)$^{-1}$} \\
&\quad = - 1231000 + 213.2\ T \pm 600,
\end{align}
| (18) |
| \begin{align}
&\text{$\Delta_{\text{f}}G^{\text{o}}$(CrB)/J (mol of compd.)$^{-1}$} \\
&\quad= - 74950 - 6.551\ T \pm 10.
\end{align}
| (19) |
The above errors were estimated as twice the standard deviations at the 0.95 level of confidence for the linear least-squares approximations. Since the approximation shown in
eq. (19) shows a strong correlation between temperature and Δ
fGo(CrB) (coefficient of determination,
R2 = 0.99998) and there is no phase transition below 1346 K,
11) the approximation is also valid at the experimental temperature between 1273 and 1346 K.
2.5 Activities of Cr and B in the Cr–B binary system
When the elemental bcc Cr and rhombohedral B are adopted as the standard state, the chemical potential of Cr, ΔμCr, and the chemical potential of B, ΔμB, are expressed as
| \begin{equation}
\Delta\mu_{\text{Cr}} = \mu_{\text{Cr}} - \mu^{\text{o}}{}_{\text{Cr}} = RT\ln a_{\text{Cr}}
\end{equation}
| (20) |
| \begin{equation}
\Delta\mu_{\text{B}} = \mu_{\text{B}} - \mu^{\text{o}}{}_{\text{B}} = RT\ln a_{\text{B}}
\end{equation}
| (21) |
where
aCr and
aB are the activities of Cr and B, respectively. The values of
aCr and
aB are given by
| \begin{equation}
a_{\text{Cr}} = \exp(\Delta\mu_{\text{Cr}}/RT)
\end{equation}
| (22) |
| \begin{equation}
a_{\text{B}} = \exp(\Delta\mu_{\text{B}}/RT)
\end{equation}
| (23) |
According to the equilibrium phase diagram of the Cr–B binary system,
11) all of the intermediate compounds are stoichiometric, and the following two-phase equilibria exist: Cr–Cr
5B
3, Cr
5B
3–CrB, CrB–Cr
3B
4, Cr
3B
4–CrB
2, CrB
2–CrB
4, and CrB
4–B. The values of Δμ
Cr and Δμ
B as well as
aCr and
aB in the two-phase equilibria can be calculated on the basis of the two-phase equilibria. Note that Δμ
Cr is zero in the Cr–Cr
5B
3 two-phase region where
aCr is unity and Δμ
B is zero in the CrB
4–B two-phase region where
aB is unity.
3. Results and Discussions
3.1 Results of electromotive force measurements
Figure 3 shows the change in the EMF of the cell and the $p_{\text{O}_{2}}$ value of the cell materials at 1319 K. The $p_{\text{O}_{2}}$ of the cell materials was converted from the EMF by using eq. (2) and shown on the right-hand axis of ordinate. In the beginning of measurement, the EMF showed approximately 1.51 V after steep increases and decreases for 14 ks. It showed plateaus and decreases, and reached to 1.31 V. In this process, the five plateaus of EMF indicated as (1) through (5) in Fig. (3) were observed at around 30, 80, 140, 185, and 246 ks from the beginning of the measurement. With this change in EMF, the $p_{\text{O}_{2}}$ of the cell materials showed plateaus and increases, that is, they were oxidized in this process. As mentioned in the sections “2.1 Preparation of Cell Materials” and “2.2 Partial Oxygen Pressure of Cell Materials”, the CrB2–CrB4 two-phase alloy used for the cell materials are oxidized to CrBO3 and B2O3 via two- and three-phase regions along its oxidation path, and the value of E is constant when the cell materials are in the three-phases regions. In our previous study,15) the EMF values of the cells having CrB2–CrB4–B2O3, Cr3B4–CrB2–B2O3, and CrB–Cr3B4–B2O3 as cell materials were measured. Since the EMF values in the plateaus of (1), (2), and (3) shown in Fig. 3 were in good agreement with those of our previous study, it is considered that the cell materials in the plateau regions of (1), (2), and (3) correspond to the three-phase regions of (1) CrB2–CrB4–B2O3, (2) Cr3B4–CrB2–B2O3, and (3) CrB–Cr3B4–B2O3, respectively. Moreover, the cell materials corresponding to plateau regions were analyzed by XRD. When the EMF of the cell reached the value of each plateau region, the measurement was stopped, the cell was cooled, and then the cell materials were analyzed by XRD. As a result, CrB2–CrB4–B2O3, Cr3B4–CrB2–B2O3, and Cr5B3–CrB–B2O3 phases were detected in the cell materials obtained in the plateau regions (1), (2), and (4), respectively. However, CrB–Cr3B4–B2O3 and Cr5B3–CrBO3–B2O3 were not detected in the cell materials obtained in the plateau regions (3) and (5), because their plateau regions were short and the oxidation proceeded during cooling. In addition, the final oxides, CrBO3 and B2O3, were detected in the cell materials after passing through the plateau region (5). On the basis of the oxidation path shown as the dashed line in Fig. 1, the phases for plateau region (5) is considered to be (5) Cr5B3–CrBO3–B2O3, which is the only three-phase region that exists between the plateau region (4) and the final oxides. Therefore, the measured five plateau values correspond to the values of E for the cell materials in the three-phase regions. From the measured five plateaus, the values of E(1) through E(5) were determined.

Table 1 summarizes the two- and three-phase regions in the EMF measurement, time duration, the (ΔE/Δt) value, and the average values of E for three-phase regions. The two- and three-phase regions for the cell materials in the EMF measurement were distinguished by using the (ΔE/Δt) value, which were calculated by the division of the change in EMF, ΔE, by its time duration, Δt. The (ΔE/Δt) values for the three-phase regions were more than 2 times smaller than those for two-phase regions.

Table 1 Summary of the two- and three-phase regions, time duration, the (ΔE/Δt) value, and the average electromotive forces for three-phase regions in the electromotive force measurement at 1319 K.
In the same way, the E values in the oxidation path of the cell materials were measured at 1273, 1301, and 1346 K.
Figure 4 shows the values of E corresponding to the cell materials in the (1) CrB2–CrB4–B2O3, (2) Cr3B4–CrB2–B2O3, (3) CrB–Cr3B4–B2O3, (4) Cr5B3–CrB–B2O3, and (5) Cr5B3–CrBO3–B2O3 three-phase regions as a function of temperature. The values of E decreased with temperature, and they were expressed as a function of temperature in the temperature range from 1273 to 1346 K by using the linear least-squares method as follows:
| \begin{equation}
E(1)/\text{V} = 2.452 - 7.161\times 10^{-4}\ T \pm 1.2\times 10^{-2},
\end{equation}
| (24) |
| \begin{equation}
E(2)/\text{V} = 2.317 - 6.473\times 10^{-4}\ T \pm 1.0\times 10^{-2},
\end{equation}
| (25) |
| \begin{equation}
E(3)/\text{V} = 2.304 - 6.636\times 10^{-4}\ T \pm 8.6\times 10^{-3},
\end{equation}
| (26) |
| \begin{equation}
E(4)/\text{V} = 2.030 - 4.939\times 10^{-4}\ T \pm 1.0\times 10^{-2},
\end{equation}
| (27) |
| \begin{equation}
E(5)/\text{V} = 1.401 - 6.032\times 10^{-5}\ T \pm 8.5\times 10^{-3}.
\end{equation}
| (28) |
The errors in
eqs. (24) through
(28) were estimated as twice the standard deviations at the 0.95 level of confidence for the linear least-squares approximations.
3.2 ΔfGo values for the Cr–B binary and Cr–B–O ternary compound
Using the measured values of E(1) through E(5), ΔfGo(CrB4), ΔfGo(CrB2), ΔfGo(Cr3B4), ΔfGo(Cr5B3), and ΔfGo(CrBO3) in the temperature range from 1273 to 1346 K were determined from eqs. (13) through (17).
| \begin{align}
&\text{$\Delta_{\text{f}}G^{\text{o}}$(CrB$_{4}$)/J (mol of compd.)$^{-1}$}\\
&\quad = 167500 - 261.2\ T \pm 7200
\end{align}
| (29) |
| \begin{align}
&\text{$\Delta_{\text{f}}G^{\text{o}}$(CrB$_{2}$)/J (mol of compd.)$^{-1}$} \\
&\quad= - 21020 - 79.22\ T \pm 2100
\end{align}
| (30) |
| \begin{align}
&\text{$\Delta_{\text{f}}G^{\text{o}}$(Cr$_{3}$B$_{4}$)/J (mol of compd.)$^{-1}$} \\
&\quad= - 173400 - 95.47\ T \pm 2500
\end{align}
| (31) |
| \begin{align}
&\text{$\Delta_{\text{f}}G^{\text{o}}$(Cr$_{5}$B$_{3}$)/J (mol of compd.)$^{-1}$} \\
&\quad= - 318900 + 20.64\ T \pm 5800
\end{align}
| (32) |
| \begin{align}
&\text{$\Delta_{\text{f}}G^{\text{o}}$(CrBO$_{3}$)/J (mol of compd.)$^{-1}$} \\
&\quad= - 958800 + 59.24\ T \pm 4100
\end{align}
| (33) |
The Δ
fGo value for one mole of atoms is convenient for comparison of the molar thermodynamic values in the Cr–B binary system. The Δ
fGo values for one mole of atoms of CrB
4, CrB
2, Cr
3B
4, and Cr
5B
3 were calculated from
eqs. (29) through
(32) as follows:
| \begin{align}
&\text{$\Delta_{\text{f}}G^{\text{o}}$(CrB$_{4}$)/J (mol of atoms)$^{-1}$} \\
&\quad= 33500 - 52.24\ T \pm 1400,
\end{align}
| (34) |
| \begin{align}
&\text{$\Delta_{\text{f}}G^{\text{o}}$(CrB$_{2}$)/J (mol of atoms)$^{-1}$} \\
&\quad= - 7006 - 26.41\ T \pm 700,
\end{align}
| (35) |
| \begin{align}
&\text{$\Delta_{\text{f}}G^{\text{o}}$(Cr$_{3}$B$_{4}$)/J (mol of atoms)$^{-1}$} \\
&\quad= - 24770 - 13.64\ T \pm 360,
\end{align}
| (36) |
| \begin{align}
&\text{$\Delta_{\text{f}}G^{\text{o}}$(Cr$_{5}$B$_{3}$)/J (mol of atoms)$^{-1}$} \\
&\quad= - 39860 + 2.580\ T \pm 730.
\end{align}
| (37) |
These values were calculated on the assumption that the solubility of the solid phase in the liquid B
2O
3 phase is negligibly small. When the solid phase dissolves into the liquid B
2O
3 phase, the terms related to the activity of each component, that is, the coefficients of
$RT\ln (p_{\text{O}_{2}\ \text{in air}}/p^{\text{o}})$ terms in
eqs. (13)∼
(17) are affected, and the temperature dependencies of the determined Δ
fGo values may have some errors.
To determine the ΔfGo value using a solid oxide electrolyte, the EMF measurement must be carried out in the ionic conduction region in which the transport number of oxygen ion, tion, can be regarded as unity. The tion value is given by30)
| \begin{equation}
t_{\text{ion}} = 1/[1 + (p_{\theta}/p_{\text{O${_{2}}$}})^{1/4}],
\end{equation}
| (38) |
where
pθ is the partial pressure where
tion becomes 0.5, owing to the formation of excess electrons, and is given by the following equation for YSZ(8) used in the present study.
33)
| \begin{equation}
\log(p_{\theta}/\text{Pa}) - \log(101325) = 18.08 - 6.24 \times 10^{4}\ T^{-1}
\end{equation}
| (39) |
The value of
tion decreases with temperature. Thus, the values of
tion at the temperature of 1346 K, where the highest temperature in the present study, were calculated from
eqs. (38) and
(39) by using the
$p_{\text{O}_{2}}$ values converted from
E values shown in
eqs. (24) through
(28).
Table 2 summarizes the values of $p_{\text{O}_{2}}$ of the cell materials and tion of YSZ(8) at 1346 K. The values of tion corresponding to the three-phase regions of cell materials were at least 0.956 and were regarded as 1.0. As described in our previous paper,9) the EMF measurements with tion less than 0.95 were unstable due to electronic conduction. Therefore, all the EMF measurements have been carried out in the ionic conduction region of the solid electrolyte.

Table 2 Summary of the values of $p_{\text{O}_{2}}$ of cell materials and tion of YSZ(8) at 1346 K.
Figure 5 shows the comparison of ΔfGo(CrB4), ΔfGo(CrB2), and ΔfGo(Cr3B4) values for one mole of atoms determined by the present EMF method with those determined by the EMF method in the previous study. In the previous study,15) three types of cells having different cell materials such as CrB2–CrB4–B2O3, Cr3B4–CrB2–B2O3, and CrB–Cr3B4–B2O3 were prepared and measured their EMFs. The experimental temperature was varied and the equilibrium EMF value was measured at each temperature. On the other hand, in the present study, the cell having CrB2–CrB4–B2O3 as cell materials was prepared, and the oxidation process was measured as the change in EMF while the temperature was fixed. Since the same solid electrolyte was used, the differences in the values shown in Fig. 5 were due to the difference in the way of EMF measurement, that is, the difference in the measurement of equilibrium EMF and the measurement of EMF during the oxidation process. The temperature gradients of ΔfGo values determined by the present method were slightly higher than those determined in the previous study. However, the ΔfGo values determined by both methods were in good agreement within the limit of experimental temperature.

Figure 6 shows the ΔfGo values for one mole of atoms of CrB4, CrB2, Cr3B4, and Cr5B3 at 1300 K in the Cr–B binary system determined in the present study compared with those in the thermodynamic tables20) and the optimized values for phase diagram calculation.22) The present ΔfGo values of Cr5B3, Cr3B4, and CrB2 exhibited good agreement with those in Ref. 22), whereas the present ΔfGo value of CrB2 was approximately 8 kJ (mol of atoms)−1 smaller than that in Ref. 20) and the present ΔfGo value of CrB4 was approximately 9 kJ (mol of atoms)−1 smaller than that in Ref. 22). Since the methods of ΔfGo determination are different, the reasons for such discrepancies are unknown.

The value of ΔfGo(Cr2B) could not be obtained experimentally in the present study. However, it can be estimated by the phase equilibria in the Cr–B binary system at 1300 K. The mole fraction of boron, XB, of Cr2B is 0.333 and it must be more stable than the hypothetical two-phase equilibrium of Cr (XB = 0) and Cr5B3 (XB = 0.375). That is, the ΔfGo(Cr2B) value must be smaller than the value at XB = 0.333 on the line segment between the ΔfGo values of Cr and Cr5B3. Therefore, the upper limit of ΔfGo(Cr2B) can be estimated to be −32.41 kJ (mol of atoms)−1. In the same manner, the ΔfGo(Cr5B3) value must be smaller than the value at XB = 0.375 on the line segment between the ΔfGo(Cr2B) and the ΔfGo(CrB)20) values for the stability of the Cr5B3 phase. In other words, the ΔfGo(Cr2B) value must be higher than the value at XB = 0.333 on the straight line passing through the ΔfGo(Cr5B3) and the ΔfGo(CrB) values. The lower limit of ΔfGo(Cr2B) can be estimated to be −34.74 kJ (mol of atoms)−1. Therefore, the ΔfGo(Cr2B) value at 1300 K can be estimated to be −34.74 < ΔfGo(Cr2B)/J (mol of atoms)−1 < −32.41.
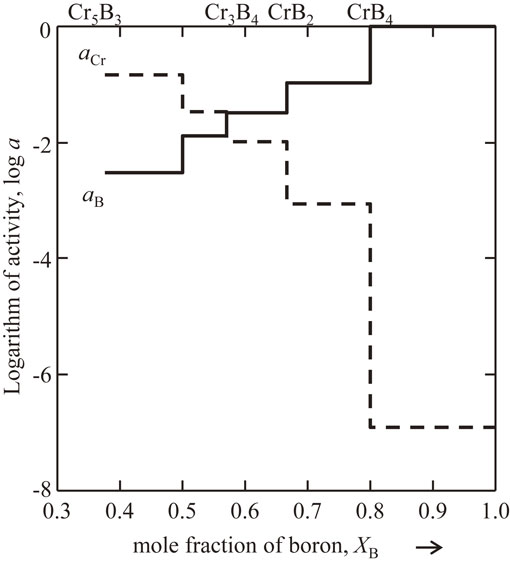
Figure 7 shows aCr and aB in the Cr–B binary system at 1300 K calculated on the basis of the two-phase equilibria. The activities are shown in the mole fraction of boron, XB, from 0.3 to 1.0, related to the ΔfGo values of Cr5B3, Cr3B4, CrB2, and CrB4 determined experimentally in the present study. The activities exhibit monotonic and stepwise change, that is, the ΔfGo values determined in the present study satisfy the phase equilibria for the Cr–B binary system.
3.4 Composition-oxygen partial pressure diagram
Figure 8 shows the composition-$p_{\text{O}_{2}}$ diagram of the Cr–B–O ternary system at 1300 K under the total pressure of 1 bar (100 kPa). This figure was constructed by considering the relationships between the oxidation paths of Cr–B binary alloys as understood from Fig. 1 and the $p_{\text{O}_{2}}$ values of three-phase equilibria on the oxidation path. The $p_{\text{O}_{2}}$ values of (1) CrB2–CrB4–B2O3, (2) Cr3B4–CrB2–B2O3, (3) CrB–Cr3B4–B2O3, (4) Cr5B3–CrB–B2O3, (5) Cr5B3–CrBO3–B2O3, (8) Cr–Cr2B–Cr2O3, and (9) CrB4–B–B2O3 three-phase equilibria were calculated by using the present ΔfGo values of CrB4, CrB2, Cr3B4, Cr5B3, and CrBO3, and the literature values of CrB,20) B2O3,18) and Cr2O3.16) The $p_{\text{O}_{2}}$ values of (6) Cr2B–Cr5B3–CrBO3 and (7) Cr2B–Cr2O3–CrBO3 three-phase equilibria shown as dashed lines in Fig. 8 were calculated by using a estimated ΔfGo(Cr2B) value at 1300 K of −33.00 kJ (mol of atoms)−1. This diagram is useful for understanding the relationship between the composition of Cr–B binary alloy and the oxidation product at any specific oxygen partial pressure.

4. Conclusion
The electromotive force measurement using the solid electrolyte was applied along the oxidation path of the Cr–B binary alloy to measure the partial oxygen pressure, $p_{\text{O}_{2}}$. From the plateaus of electromotive forces corresponding to the three-phase regions along the oxidation path, the ΔfGo values of CrB4, CrB2, Cr3B4, Cr5B3, and CrBO3 in the Cr–B–O ternary system were determined. The obtained ΔfGo values of CrB4, CrB2, Cr3B4, and Cr5B3 satisfied the phase equilibria in the Cr–B binary system. Using the ΔfGo values determined in the present study, the composition-oxygen partial pressure diagram of the oxidation path was constructed.
REFERENCES
- 1) K. Gurumoorthy, M. Kamaraj, K. Prasad Rao, A. Sambasiva Rao and S. Venugopal: Mater. Sci. Eng. A 456 (2007) 11–19.
- 2) E.S. Puchi Cabrera, J.A. Berríos-Ortiz, J. Da-Silva and J. Nunes: Surf. Coat. Tech. 172 (2003) 128–138.
- 3) G. Zhang, M. Morishita and K. Koyama: J. Japan Inst. Metals 64 (2000) 1252–1256.
- 4) A. Thomas, M. El-Wahabi, J.M. Cabrera and J.M. Prado: J. Mater. Process. Technol. 177 (2006) 469–472.
- 5) F.-Y. Ouyang, C.-H. Chang and J.-J. Kai: J. Nucl. Mater. 446 (2014) 81–89.
- 6) K.T. Jacob: J. Mater. Sci. 12 (1977) 1647–1652.
- 7) K.T. Jacob, G.M. Kale and G.N.K. Iyengar: J. Mater. Sci. 22 (1987) 4274–4280.
- 8) H. Yamamoto and M. Morishita: J. Alloy. Compd. 438 (2007) L1–L3.
- 9) H. Yamamoto, M. Morishita, T. Yamamoto and K. Furukawa: Metall. Mater. Trans. B 42 (2011) 114–120.
- 10) H. Yamamoto, M. Morishita, Y. Miyake and S. Hiramatsu: Metall. Mater. Trans. B 48 (2017) 1703–1714.
- 11) T.B. Massalski, H. Okamoto, P.R. Subramanian and L. Kacprzak: Binary Alloy Phase Diagrams, 2nd ed., (ASM International, Ohio, 1990) pp. 471–474.
- 12) H. Okamoto: J. Phase Equilib. 18 (1997) 402.
- 13) T.B. Massalski, H. Okamoto, P.R. Subramanian and L. Kacprzak: Binary Alloy Phase Diagrams, 2nd ed., (ASM International, Ohio, 1990) pp. 510–512.
- 14) N.C. Tombs, W.J. Croft and H.C. Mattraw: Inorg. Chem. 2 (1963) 872–873.
- 15) H. Yamamoto, Y. Wada, K. Nishiyama, Y. Taniguchi, A. Nozaki and M. Morishita: Mater. Trans. 61 (2020) 2357–2362.
- 16) M.W. Chase, Jr.: NIST-JANAF Thermochemical Tables, 4th Ed., (American Chemical Society and American Institute of Physics for National Institute of Standards and Technology, New York, 1998) p. 972.
- 17) I. Barin: Thermochemical Data of Pure Substances, (VCH Verlagsgesellschaft, Weinheim, 1989) p. 573.
- 18) M.W. Chase, Jr.: NIST-JANAF Thermochemical Tables, 4th Ed., (American Chemical Society and American Institute of Physics for National Institute of Standards and Technology, New York, 1998) p. 272.
- 19) I. Barin: Thermochemical Data of Pure Substances, (VCH Verlagsgesellschaft, Weinheim, 1989) p. 122.
- 20) I. Barin: Thermochemical Data of Pure Substances, (VCH Verlagsgesellschaft, Weinheim, 1989) p. 558.
- 21) L. Topor and O.J. Kleppa: J. Chem. Thermodyn. 17 (1985) 109–116.
- 22) P.K. Liao and K.E. Spear: Bull. Alloy Phase Diagrams 7 (1986) 232–237.
- 23) S. Andersson and T. Lundstrom: Acta Chem. Scand. 22 (1968) 3103–3110.
- 24) K.I. Portnoi, V.M. Romashov and I.V. Romanovich: Poroshk. Metall. 4 (1969) 51–57.
- 25) K.I. Portnoi and V.M. Romashov: Poroshk. Metall. 5 (1972) 48–56.
- 26) C.N. Guy and A.A. Uraz: J. Less-Common Met. 48 (1976) 199–203.
- 27) L. Brewer and H. Haraldsen: J. Electrochem. Soc. 102 (1955) 399–406.
- 28) H. Yamamoto, M. Masao, A. Miyata and K. Koyama: Metall. Mater. Trans. B 37 (2006) 607–613.
- 29) H. Yamamoto, A. Miyata and K. Koyama: J. Japan Inst. Metals 70 (2006) 233–237.
- 30) H. Schmalzried: Z. Phys. Chem. 38 (1963) 87–102.
- 31) The Chemical Society of Japan: Handbook of Chemistry, Basic Part I, 4th ed., (Maruzen, Tokyo, 1993) p. I-52.
- 32) P. Atkins, J. Paula and J. Keeler: Atkins’ Physical chemistry, 11th ed., (Oxford University Press, Oxford, 2018) pp. 123–125.
- 33) M. Iwase, E. Ichise, M. Takeuchi and T. Yamasaki: Trans. JIM 25 (1984) 43–52.