抄録
Although severe plastic deformation causes grain refinement of polycrystalline materials, saturation of grain refinement is known to be caused by simultaneous grain coarsening. In the present study, for ultra-fine-grained (UFG) pure Al prepared by equal-channel angular pressing, we studied the grain refinement and coarsening processes during large simple-shear deformation using scanning electron microscopy/electron backscatter diffraction. The changes of the crystal orientations in the grains as a function of position were analyzed using log angles as rotation angles around reference axes. This analysis enabled the evaluation of order of magnitude of the in-plane components of geometrically necessary dislocation (GND) density tensors. Detailed changes in the crystal orientations during shear deformation were measured for identical regions in UFG Al, and the changes in the components of the GND density tensors were discussed. Our findings indicate that the grain refinement and coarsening can be explained by the appearance and disappearance of grain boundaries composed of dislocation walls, respectively.
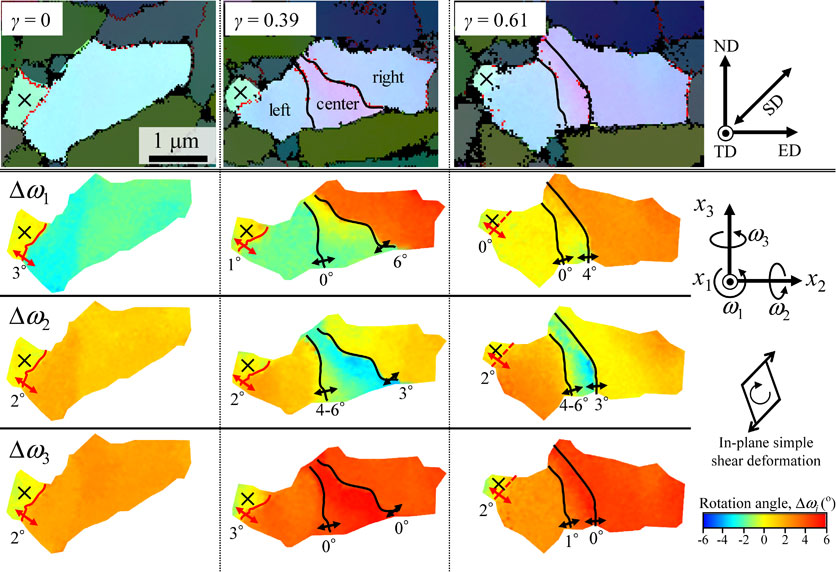
Fig. 7 IPF maps and log angle maps for grains “a” and “b” (“b1” and “b2” at γ = 0.39 and 0.61). The “X” mark in each IPF map represents the reference crystal orientation for log angle analysis at each deformation stage. The IPF maps at γ = 0.39 and 0.61 show that grains “b1” and “b2” were divided into three regions with respect to LAGBs. In the log angle maps, the LAGBs and boundaries of the regions are indicated by red and black lines, respectively. At γ = 0.61, the red dashed lines represent the position of the original LAGB between grains “a” and “b”. The double-headed arrows in the log angle maps show the typical value of the difference of the log angles between adjacent regions.
Fullsize Image

