Microstructure of Materials
Microstructure and Mechanical Properties of the Heterogeneous-Nano Structured Cu–Be System Alloys
2022 年 63 巻 1 号 p. 21-26

詳細
2022 年 63 巻 1 号 p. 21-26
Microstructures and mechanical properties of Cu–Be–Co alloys having four different Be contents prepared by simply heavy cold rolling (CR) were systematically investigated. The cold-rolled alloys exhibited excellent mechanical properties due to development of heterogeneous nano-structure (HN), which consisted of “eye”-shape deformation twin domains surrounded by shear bands, and they were further embedded in conventional low-angle lamellae. The strength of each alloy increased with increasing Be content. The volume fraction of the twin domains quantitatively evaluated by the texture analyses that increased with increasing Be content rapidly from 0.40 mass% to 1.27 mass% and gradually from 1.27 mass% up to 2.14 mass%. The latter stagnation was attributed to the formation of coarse intermetallic particles, which impeded the formation of the HN structure. It revealed that the strength was correlated closely with the volume fraction of twin domains.
This Paper was Originally Published in Japanese in J. Japan Institute of Copper 60 (2021) 81–86.

Fig. 8 Relationship between ultimate tensile strength and the volume fraction of deformation twin domains developed in 90% cold-rolled Cu–Be–Co alloys with different Be concentrations. The values of ultimate tensile strength were obtained from tensile tests performed with the stress axis parallel to RD or TD.
Recent years, electronic devices are designed to be smaller and lighter than ever before. Consequently, essential improvements of various properties such as strength, electric conductivity, bending formability and fatigue resistance are required for the Cu alloys. Recently, Miura et al. reported that an extraordinary strength/ductility balance could be achieved by simple heavy cold rolling of Cu alloys with ultra-low stacking fault energy (SFE).1,2) Their results were attributed to the formation of the heterogeneous nano-structure (HN) during cold rolling process. The HN is composed of “eye”-shape deformation twin domains surrounded by shear bands, which were further embedded in the ultrafine low-angle lamellae.3,4) Since the most of grain boundaries included in the HN are Σ3 coherent twin and low-angle ones, it possesses relatively high thermal stability and, therefore, allows aging after the heavy cold rolling.1,3) This relatively higher thermal stability than those of the ultrafine-grained alloys fabricated by severe plastic deformation methods must be one of the advantages of the HNed alloys for the microstructural control and strengthening. Actually, in the recent studies, notable strengthening has been achieved by the combined processes of heavy cold rolling and aging. Miura et al. have demonstrated that the excellent strength/ductility balance of 1.2 GPa in tensile strength (UTS) and 15% in total elongation is achieved in a Cu–Ti–Co alloy.5) Muramatsu et al. have also successfully fabricated a HNed Cu–Be–Co alloy having an extremely high UTS of 1.79 GPa.6) The HNed Cu–Be–Co alloy exhibited high strength as well as reasonable electrical conductivity, bending formability and fatigue resistance, which are equal or even superior to the conventional alloys. In the present study, as an extension of the study of Muramatsu et al.,6) the effects of Be content on the formation of HN and mechanical properties are systematically investigated using four Cu–Be–Co alloys with different Be contents.
Four Cu–Be–Co alloys with different Be contents were used in this study. The chemical compositions are listed in Table 1. Based on the practical alloy C17200 (1.86 mass% Be, hereafter content is shown without mass%), Cu–Be–Co alloys with the lower Be contents of 0.40%, 1.27% and the higher of 2.14% were prepared. Hereafter, the alloys will be referred by the Be content as 0.40-Be, 1.27-Be, 1.86-Be and 2.14Be. The four alloys were cast using metal molds. The initial thickness of the ingots was 50 mm and was reduced to 5 mm by the combined process of hot-rolling, cold-rolling and intermediate annealing. The alloy plates were solution treated at 1123 K × 600 s (10 min) and then, heavily cold rolled to the reduction of 90% in thickness. The dog-bone shape specimens for tensile tests were cut from the cold-rolled sheets, of which the loading axes were parallel to either the rolling direction (RD) or the transverse direction (TD). Dimensions of the gauge section were 6 mm in length, 2 mm in width and 0.5 mm in thickness.

Tensile tests were conducted at room temperature and at the initial strain rate of $\dot{\varepsilon } = 10^{ - 3}$ s−1 on an Instron-type universal testing machine. Texture and microstructure before and after the tensile tests were examined by the X-ray diffraction (XRD) measurement, transmission electron microscopy (TEM, TECNAI G2, FEI) and the scanning electron microscopy (SEM, JSM-7900F, JEOL) equipped with an electron backscatter diffraction (EBSD) camera. Specimens for TEM and SEM observations were prepared using an ion thinning apparatus, of which the observation direction was parallel to TD of the rolled sheets. An acceleration voltage of 300 kV for TEM observation was applied. Microstructural observations using transmission Kikuchi diffraction (TKD) technic were also carried out. For the TKD analyses, the acceleration voltage of SEM was set to 30 kV with the beam step of 50 nm.
Figure 1 depicts the nominal stress - nominal strain curves obtained from tensile tests of the 90% cold-rolled specimens with different Be contents. For both loading axes of (a) RD or (b) TD, the tensile strength increased with increasing Be content. The increase in UTS was particularly pronounced when the Be content increased from 0.40% to 1.27%. Regardless of the Be content, the UTS when tensile tested along TD was higher than that along RD.

Nominal stress - nominal strain curves of 90% cold-rolled Cu–Be–Co alloys with four different Be contents. Loading axis was parallel to (a) RD or (b) TD. Tensile tests were conducted at an initial strain rate of 10−3 s−1 at room temperature.
Microstructural observations by the SEM back-scattered electron (BSE) method revealed the formation of HN consisting of rhombic/or “eye”-shaped deformation twin domains, low-angle lamellae and shear bands in all specimens. The SEM-BSE images of the 0.40-Be and 2.14-Be specimens are exemplified in Fig. 2. As reported in the previous literature,3,4) the twinning planes of the twin domains are parallel to the rolled plane. The presence of particles was confirmed even before aging as indicated by the white arrows, and their size and number density increased with increasing Be content. Sakai et al. reported that they were CuBe or CoBe intermetallic phases remained after solution treatment.7) In addition, as indicated by the black arrows in Fig. 2(b), quite coarse particles elongated along RD also existed in the 2.14-Be specimen.

SEM-BSE images of 90% cold-rolled Cu–Be–Co alloys with different Be contents: (a) 0.40-Be, (b) 2.14-Be.
Figure 3 shows a TEM bright-field image of the typical HN developed in the 1.24-Be specimen. The deformation twin domains are surrounded by the shear bands and further embedded in the low-angle lamellae. Analyses of selected area diffraction pattern (SADP) reveal two types of twin domains with crystallographic orientations of ⟨111⟩ || ND, ⟨110⟩ or ⟨112⟩ || TD, as previously reported.8) Morphology of the HN was identical in all alloys. Figure 4 shows the imposed microstructure developed near an intermetallic particle. The SADP analysis of the particle indicated B2 structure with the lattice constant of about 0.27 nm. Additionally, the energy-dispersive X-ray spectroscopic (EDX) analysis reveals Cu and Co contents with their atomic ratio approximately of 11:1. Based on the above results and the literature by Sakai et al.,7) the intermetallic particles were determined as the γ phase with B2 structure, and Co atoms partially substituted Cu sites. Although the HN was observed to develop around relatively small γ phase particles, its formation seemed to be impeded around the coarse particles as large as 1 µm (Fig. 4). The feature of the rhombic region indicated by the dashed line in Fig. 4 resembles twin domain at a glance. The SADP analysis, however, denied it but possessed the same crystallographic orientation with the lamellae (⟨001⟩ || ND, ⟨110⟩ || TD).
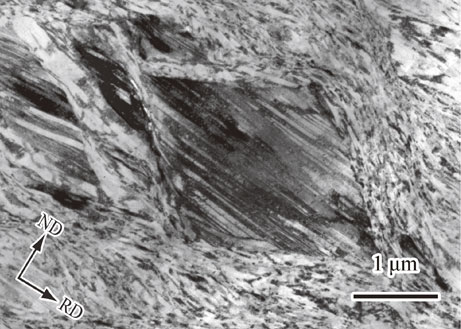
TEM bright-field image of a typical HN structure formed in a 1.24-Be specimen.

TEM bright-field image of the microstructure developed around the relatively large γ-phase particles in the 2.14-Be specimen.
Figure 5 shows a TEM bright-field image of a coarse particle larger than several micrometers embedded in HNed matrix. Such very coarse particles were observed only in the 2.14-Be specimen. The coarse particle indicated by the dashed line in Fig. 5(a) has an elongated shape along RD (compare with Fig. 2(b)). As to the interior of the very coarse particles, lattice defects density was low regardless of their size. Furthermore, the formation of shear bands within the particles were observed. Shape of the very coarse particles and the shear bands within them can also be recognized in Fig. 2(b). SADP analysis shows that the particles had a body-centered cubic structure with the lattice constant of 0.29 nm. Moreover, no Co atoms were detected from the particles by EDX analysis. From these results, together with the Cu–Be–Co pseudo-binary phase diagram9) and the Cu–Be binary phase diagram,10) the very coarse particles were determined as the β phase. The β phase particles are elongated along RD on the TD plane. From the pseudo-binary phase diagram,9) the β phase is considered to form during solidification and remained after the solution treatment. As seen in Fig. 5, only low-angle lamellae are observed to develop in the copper matrix around the very coarse β phase particle. That is, formation of twin domains are quite few.

(a) TEM bright-field image showing the microstructure developed around a β-phase particle in a 2.14-Be specimen. (b) SADP of the particle marked by the dotted line in (a). (c) Schematic illustration of (b).
Microstructural observations by SEM-TKD method were carried out in order to evaluate microstructural and crystallographical characteristics more comprehensively. The obtained images are displayed in Fig. 6. The image quality (IQ) map (Fig. 6(a)) clearly shows the development of HN in the matrix and the presence of particles with high contrast (indicated by white arrows) as well as very coarse sized one elongated along RD (indicated by black arrows). The unanalyzable pixels due to the low IQ values also can be seen in Fig. 6(a), which correspond to places with high dislocation density. Especially, at around and along the coarse particles, strange image contrasts evidently different from those of linearly-appearing shear bands were found. They should be deformation zones fragmented from matrices to have finer grain size and high dislocation density,11,12) while the crystallographical analysis was not carried out. From the inverse pole figure (IPF) map shown in Fig. 6(b), it was confirmed that two types of twin domains with different crystallographical orientations of ⟨110⟩ or ⟨112⟩ || TD coexisted. The fraction of the twin domains with the ⟨110⟩ || TD and ⟨112⟩ || TD orientations was measured from several obtained IPF maps. 60 twin domains were analyzed in total and it was found that 81% of the ⟨110⟩ || TD orientation and the rest of the ⟨112⟩ || TD one, which suggests much higher fraction of the former. Combining the crystallographical information of the γ and β phases determined from TEM observations, the phase distributions were separately represented together with the matrix α phase in Fig. 6(c). While the green contrast of the γ phase was sharply recognized, that of the β phase was not. This should be attributed to the fairly low contrast of the Kikuchi patterns detected from the β phase particle. Therefore, its image was not successfully created both in the IPF and phase maps (Figs. 6(b), (c)).
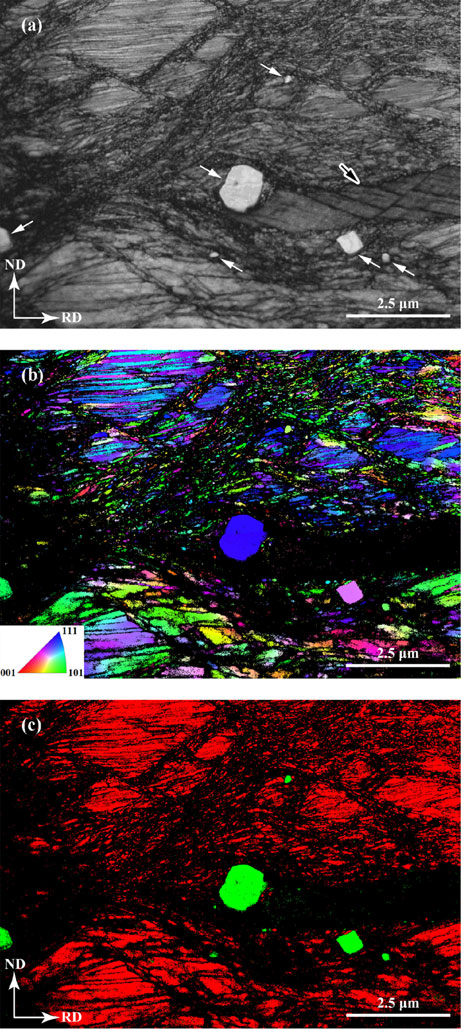
(a) Image quality map, (b) IPF maps color-decoded parallel to TD and (c) phase map obtained from a 2.14-Be specimen by SEM-TKD analyses. In (c), Cu matrix is colored in red and γ phase is in green.
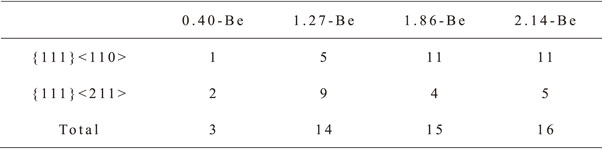
The evolved texture of each alloy after CR was obtained by XRD measurements. Figures 7(a) and (b) show the {111} reconstructed pole figures (RPF) and IPF of each specimen, respectively. All specimens exhibit the brass type texture (Fig. 7(a)), which is usually observed in heavily cold-rolled FCC metals and alloys.13,14) It is characteristic that the ND || ⟨111⟩ orientation component appeared and became definitely sharper as the Be content increased (Figs. 7(a) and (b)). However, the ND || ⟨111⟩ component was hardly detected in the 0.40-Be specimen. This component resulted from the crystallographical orientation of the twin domains (⟨111⟩ || ND and ⟨110⟩ or ⟨112⟩ || TD), as described in Section 3.2. The textual change was quantitatively evaluated from the volume fraction of the twin domains using the orientation distribution function. The attained results are summarized in Table 2. Volume fraction of the twin domain increased rapidly as the Be content increased from 0.40% to 1.27%. However, when the Be content exceeded 1.27%, the increase in the volume fraction of the twin domain was moderate. In addition, the fraction of the twin domains with ⟨112⟩ || TD orientation also tended to increase with increasing Be content. Comparing the fraction of the two types of twin domains in the 2.14-Be specimen from the texture measurements with the SEM-TKD analyses, the tendencies are qualitatively consistent. However, the absolute values did not agree well. The reason for the discrepancy is considered to be the differences in the analyzed areas and spatial resolutions of the two methods.

(a) Reconstructed {111} pole figures and (b) inverse pole figures of 90% cold-rolled Cu–Be–Co alloys with different Be contents.
Muramatsu et al. reported that the area fraction of deformation twin domains in the HN increased from 3.7% to 4.9% when the Be content increased from 1.86% to 2.14% in Cu–0.23 mass%Co–Be alloys.6) It was confirmed in the present study by means of XRD measurement that the volume fraction of twin domains increased with increasing Be content (Table 2). Watanabe et al. investigated the formation process of the HN in detail and demonstrated that the deformation twinning took place in the portion of coarse initial grains at the early stage of cold rolling. The subsequent cold-rolling process led to subdivision and rotation of the twinned region by shear bands, and eventually to the development of HN.8) Therefore, it can be stated that the deformation twinning that occurred within the initial grains plays the most essential role in the subsequent formation and variant selection of the twin domains. Generally, the deformation twinning is strongly affected by the SFE,15,16) where deformation twinning becomes easier with decreasing SFE. It was also reported that the dissolution of Be into Cu matrix lowers SFE.17) Thus, the increase in Be content must promote mechanical twinning to increase in the volume fraction of twin domains in the HN. Meanwhile, higher content of Be caused the formation of intermetallic particles as well. As depicted in Fig. 2, the size and number density of the γ phase particles significantly increased with increasing Be content. Moreover, existence of the β phase particles as coarse as several micrometers was also observed in the 2.14-Be specimen. The coarse particles are known to promote formation of deformation zones after cold rolling.11,12) It is assumed from Fig. 4, 5 and 6 that the deformation zones different from the component structures of the HN were evolved. However, the volume fraction should be too small to affect the mechanical properties. It can be concluded from the above results and discussion that contradictory effects were yielded by increasing Be content; a positive effect of promotion of mechanical twinning by lowering SFE, and a negative effect of suppression of mechanical twinning by intermetallic particles to reduce volume fraction of twin domains (see Table 2).
Figure 8 shows the relationship between the volume fraction of the twin domains evaluated from the texture analyses and UTS. The dependence of the UTS on the Be content exhibited the same tendency with the change in the volume fraction of twin domains. Aoyagi et al. carried out the crystal plasticity simulations using a crystallographical model of HN and revealed that the twin domains strongly inhibited spread of plastic deformation, and therefore, the higher volume fraction could derive further strengthening.18) Moreover, they also demonstrated that anisotropy of mechanical properties in the HNed stainless steel and the tensile strength along TD became higher than along RD.18) The results obtained in the present study (Fig. 8) agree well with the simulation results by Aoyagi et al. It is evident that the volume fraction of twin domains in the HN positively and strongly affects the strength of alloys.

Relationship between ultimate tensile strength and the volume fraction of deformation twin domains developed in 90% cold-rolled Cu–Be–Co alloys with different Be concentrations. The values of ultimate tensile strength were obtained from tensile tests performed with the stress axis parallel to RD or TD.
Heterogeneous nano-structure (HN) was introduced into Cu–Be–Co alloys with different Be contents by simply heavy cold rolling. Effects of Be content on the evolution of HN and the mechanical properties were systematically investigated. The results obtained are summarized as follows:
The authors acknowledge the financial support of the Grant-in-Aid for Scientific Research (KAKENHI) Grant No. 20H02461 on this work.