Abstract
We investigated the mechanical alloying (MA) processes of Al and Al2O3 powders via X-ray diffraction analysis, transmission electron microscopy (TEM), and Vickers microhardness. The yield strengths and microstructures of consolidated compacts were evaluated using tensile tests and TEM, respectively. When the amount of oxygen in the MA atmosphere was higher than a certain threshold, Al2O3 particles of about 7 nm were precipitated in the Al grain interior from a supersaturated solid solution (SSS) of Al–O due to significant precipitation driving force. Two types of alloyed powders were obtained: Al2O3 particle-dispersed Al nanocomposite and SSS. The consolidated compact of the former exhibited smaller Al grains and higher yield strength than the latter due to the enhancement of the pinning effect on Al grain boundary migration during consolidation. The difference in the nature of the two kinds of powders affected the Al grain sizes and yield strengths of the consolidated compacts.
1. Introduction
Mechanical alloying (MA) is widely employed in the fabrication of particle-dispersion strengthened alloys where dispersoids are refined and homogeneously dispersed.1) Alloying via MA forms equilibrium and nonequilibrium phases, such as supersaturated solid solution (SSS)2,3) and amorphous alloys.4–6) The nonequilibrium phase has several advantages. In some cases, nonequilibrium phases have superior properties, for example, Co-rich amorphous phases have superior soft magnetic properties.7) In other cases, microstructure that cannot be obtained via an equilibrium process can be achieved by nonequilibrium phases through phase transformation pathways. For example, some of the duralmin’s precipitation strengthened alloys have microstructures similar to this. According to a report on Al–Cu alloys,8) SSS, where Cu solutes were dissolved in Al matrix beyond the solubility limit, was obtained at an early MA stage, but phase precipitation, which should occur during room-temperature aging, occurred at the final MA stage. This aging occurred because a rise in local temperature was induced by the collision between balls and powder during MA. Contrarily, it was reported that no precipitation occurred during MA in Al–Fe alloys,9) and SSS was obtained.
Precipitation in powder during MA affects the properties of consolidated compacts. For instance, precipitates and dispersoids inhibit the grain boundary migration of matrix grains during consolidation and are effective in suppressing the matrix coalescence.10,11) Consequently, the powder consolidation with precipitates or dispersoids, or both, leads to the significant refinement of matrix grains compared with those without precipitates or dispersoids. Notably, the nature of alloyed powder before consolidation is a vital parameter that affects the microstructure of consolidated compacts in fabricating particle-dispersion strengthened alloys.
Al–Al2O3 composite is a type of particle-dispersion strengthened alloy, which was originally developed as sintered aluminum product or powder (SAP).12) In fabricating SAP, Al2O3 dispersoids are supplied from oxide films existing at the surface of the Al powder. The Al powder consolidation is performed via hot pressing and extrusion. The hot pressing and extrusion operations break the oxide films, which results in the formation of Al2O3 dispersoids. Consequently, Al2O3 dispersoids become flakes (about 50 nm in length and 10 nm in width) and are heterogeneously distributed at the Al matrix grain boundaries.13) Alternatively, Benjamin and Bomford used MA to obtain the homogeneous distribution of fine Al2O3 particles in the Al matrix grain interior.14) Thus, equiaxed Al2O3 particles with a diameter of about 30 nm were homogeneously distributed in the Al grains, such that the resulting SAP exhibited a yield strength (264.1 MPa) comparable with conventional SAP even though it included a smaller amount of Al2O3 (2.51 vol%) than conventional SAP (11.5 vol%). Notably, MA yielded a better distribution of dispersoids than observed in the conventional SAP. Thus, studies on the MA of Al using various Al2O3 quantities have been conducted extensively to report their mechanical properties and microstructures.15–19) It is important to understand the alloying process that affects the nature of alloy powders because bulk compacts are obtained by consolidating the powder alloyed via MA of Al and Al2O3. Therefore, the alloying process was explained based on the results of how Al peaks shifted with respect to the horizontal axis of 2θ in X-ray diffraction (XRD) analysis. It was reported that the Al peak shift could be attributed to the dissolution of atoms of the minor matrix-alloying elements, impurities, and reinforcement particles in the Al lattice during MA.20,21) However, to the best of our knowledge, how oxygen solutes were dissolved in or precipitated from the Al matrix is yet to be reported.
The factors affecting precipitation in alloyed powders are composition, temperature, and degree of deformation of the powder during MA (depending on the MA conditions). The composition for this study was selected because oxygen in the MA atmosphere acts as an alloying element during the MA of Al and Al2O3. In this study, the effect of oxygen in the MA atmosphere on the formation of precipitates and SSS during the MA of Al and Al2O3 mixture was investigated because this effect had not been investigated. It was observed that Al2O3 particle-dispersed Al nanocomposite and SSS powders were obtained depending on the amount of oxygen in the MA atmosphere.
2. Experimental Procedure
Al powder (purity, 99.9%; average particle size, 30 µm) and Al2O3 powder (average particle size, 75 µm) were used as raw materials. These powders were weighed in an Ar-filled glove box to prepare 10 g of Al–3 mass% Al2O3 (2.1 vol% Al2O3) blended powder. The oxide film existing on the surface of the Al powder was neglected because the amount of the oxide film was about 0.05 vol% in the Al powder22) and was not so significant. The oxygen concentration in the glove box was measured to be approximately 3 vol% using an oxygen meter (MOTHERTOOL Co., Ltd., Model: PO2-250). The weighed powder mixture was put in an 80-cm3 ZrO2 jar with ZrO2 balls (diameter, 5 mm) and 2 mass% stearic acid as a process control agent; the ball-to-powder weight ratio was 10:1. The ball mill used was a planetary ball mill (Planet M2-3F, Nagao System Inc.). MA was conducted for 48 h at revolution and rotation speeds of 400 and 1000 rpm, respectively. The MA process was intermittently stopped after 6, 12, and 24 h, and part of the alloy powder was taken out of the jar in the glove box for characterization. This MA process is designated as intermittent MA (i-MA). Alternatively, the MA process conducted for 48 h continuously without intermittent sampling is designated as continuous MA (c-MA). During the alloying process, it was speculated that the amount of oxygen in the MA atmosphere was decreased according to a reference,23) where a sample was contaminated with oxygen derived from MA atmosphere. In i-MA, 3 vol% of oxygen included in the glove box was supplied in the jar each time it was opened after 6, 12, and 24 h, whereas in c-MA, no additional oxygen was supplied. Therefore, i-MA was expected to have a higher amount of oxygen contributing to the alloying process compared with c-MA.
After i-MA and c-MA for 48 h, the alloy powders were consolidated via spark plasma sintering (SPS) in the following procedure: The alloy powder was packed in a graphite die with an inner diameter of 10 mm. Graphite punches were coated with BN spray. The die and punches were set in an SPS apparatus, Dr. Sinter LAB (Fuji Electronic Industrial Co., Ltd.). The chamber was evacuated to a pressure of less than 10 Pa. Figure 1 presents the temperature program for the consolidation process. A 60-MPa uniaxial compressive stress was exerted and maintained on the punches during the consolidation. The temperature was increased to 480°C at 50°C/min and then to 580°C at 20°C/min; finally, it was maintained at 580°C for 30 min followed by furnace cooling. The sample was removed from the chamber after it had been cooled to 200°C. The consolidated compacts were cylindrical with a diameter of 10 mm and height of approximately 10 mm.

The phases in the consolidated compacts were analyzed via XRD at a scan speed of 0.1°/min using CuKα1 radiation generated at 30 kV and 15 mA. The microstructures were observed using a transmission electron microscope (TEM), JEM-2100 (JEOL), operated at 200 kV. Composition analysis was conducted using energy-dispersive X-ray spectroscope (EDS) installed in TEM. TEM samples of MA powders were prepared by focused ion beam using JEM-9310FIB (JEOL). Thin films were obtained from MA powders and then put on a Cu mesh coated with a carbon grid. Alternatively, TEM samples of the consolidated compacts were prepared via Ar milling using PIPS (GATAN).
The Vickers microhardness of MA powders was measured using MVK-E (Akashi) as follows: MA powders were embedded in Bakelite and mechanically polished to obtain flat surfaces. The load for the hardness measurement was 10 g so that the indentation size was smaller than the sizes of powders having a flattened shape with a diameter of less than 100 µm and a thickness of less than 10 µm. The hardness measurement was conducted under a load of 10 g for the holding time of 30 s at room temperature. The depths of the indentations were about 3 µm at most. Therefore, the effect of the powder thickness on the microhardness cannot be neglected. The microhardness values in this study are apparent values. Tensile tests after the consolidation were performed using AG-10kNI (Shimadzu) at a strain rate of 5 × 10⁻⁴ s−1 at room temperature. Miniaturized tensile specimens with the shape indicated in Fig. 2 were cut from the consolidated compacts via electrical discharge machining.
3. Results
3.1 Before consolidation
Figure 3(a) presents the results of XRD spectra obtained from the powders after i-MA was performed from 0 to 48 h. Al and Al2O3 phases were detected in all profiles. Si peaks were also observed because Si powder was added to the XRD samples as a standard sample. All the profiles were corrected with respect to the horizontal axis so that (200) peaks of Si at 2θ = 47.3° are at the same positions. Besides, all the profiles were normalized such that the integral intensities of (111) reflections of Al at about 38.5° were identical. This normalization indicates that the magnitude relationship of volume fractions corresponds to that of integral intensities.

Figure 3(b) presents a magnified graph of Fig. 3(a) to focus on $(11\bar{2}3) $ peaks of Al2O3 at 43.4°. In i-MA, the reflection demonstrated a decrease in the integral intensity after 6 h and peak shift until 48 h. Though the reason for the peak shift is unclear, the decrease in the integral intensity is attributed to the refining of the Al2O3 particles and the decrease in the Al2O3 volume fraction associated with the dissociation of Al2O3 into Al and O. Subsequently, Fig. 3(c) presents a magnified graph of Fig. 3(a) to focus on peak shift of (111) peak of Al. In this figure, (111) peak of i-MA shifted to the lower angle from 0 to 12 h and then to a higher angle until 48 h.
Figure 4 presents the lattice parameters evaluated from the (111) peaks of Al. The lattice parameter before MA was 0.4046 nm, which included the error in four significant figures. This lattice parameter is consistent with 0.4046 ± 0.0004 nm, which was reported in Al with a purity 99.97%.24) The lattice parameter of i-MA increased from 0.4046 to 0.4049 nm until 12 h and then decreased to 0.4044 nm until 48 h. The increase in the lattice parameter is attributed to the dissolution of substitutional atoms with atomic radii larger than that of Al or interstitial atoms. For the former, Zr is the only candidate and will probably come from the jar and balls, but Zr was not detected by TEM-EDS as described below. Thus, the dissolution of interstitial atoms in Al increased the lattice parameter. Oxygen, nitrogen, and carbon are the interstitial atom candidates. Oxygen is probably supplied from the atmosphere in the jar, Al2O3, or stearic acid. Nitrogen may also be derived from the atmosphere in the jar, and carbon may come from stearic acid. However, nitrogen and carbon were not detected by TEM-EDS as described below. Thus, the increase in the i-MA lattice parameter was attributed to the dissolution of oxygen in Al. It is thought that the decrease in the i-MA lattice parameter indicates the exclusion of oxygen from the Al matrix.

Figure 3(b) demonstrates that the decrease in Al2O3 volume fraction after 48 h in c-MA is similar to the decrease after 48 h in i-MA. However, the peak shift of (111) of Al after 48 h in c-MA was opposite to that in i-MA after 48 h. In c-MA, (111) Al peak shifted to the lower angle after 48 h {Fig. 3(c)}, resulting in a lattice parameter of 0.4053 nm (Fig. 4). Notably, in i-MA, oxygen was first dissolved in Al and finally excluded from the Al after 48 h, whereas in c-MA, oxygen was not excluded, forming SSS after 48 h.
To verify that Al2O3 precipitates were formed from the oxygen excluded from the Al matrix, the alloyed powders were observed via TEM (Fig. 5). Figures 5(a) and (b) are TEM photographs after i-MA for 24 h, and Figs. 5(c) and (d) are those after i-MA for 48 h. In Figs. 5(a) and (c), irregularly shaped particles of about 20 nm are indicated by double arrowheads, whereas round-shaped particles of about 4 and 7 nm are indicated by single arrowheads in Figs. 5(b) and (d), respectively. The irregularly shaped particles are residual Al2O3 milled but not alloyed with Al. The round-shaped particles consist of the Al2O3 phase precipitated from the Al matrix during MA. Figure 6 presents the EDS results analyzed at positions A and B depicted in Fig. 5(d); only three elements of Al, O, and Cu were detected. Cu was detected from the Cu mesh. A precipitate (A) is probably Al2O3 because this precipitate included more O atoms than the matrix (B) and excluded other elements than Al and O. Figures 5(b) and (d) show that the powder after i-MA for 48 h had more Al2O3 precipitates than that after i-MA for 24 h. This result of TEM observation correlates with the fact that the lattice parameter after i-MA for 48 h was smaller than that after i-MA for 24 h (Fig. 4). As for c-MA, residual Al2O3 particles were observed as indicated by double arrowheads in Fig. 5(e) after 48 h; however, no precipitates of Al2O3 were observed {Fig. 5(f)}. This result correlates with the fact that the lattice parameter did not decrease during MA in Fig. 4.

Consequently, i-MA was a process where oxygen was first compulsorily dissolved in the Al matrix (Fig. 4), and Al2O3 particles were finally precipitated from SSS in nanosize (Figs. 4 and 5). This process produced the composite powder comprising the Al matrix and nanosized Al2O3 dispersoids, i.e., Al2O3 particle-dispersed Al nanocomposite powder. Alternatively, c-MA was a process where no Al2O3 particles were precipitated (Figs. 4 and 5), although there were some residual Al2O3 particles. This process produced the powder consisting mainly of SSS of Al–O, i.e., SSS powder.
The Vickers microhardness values of the powders after i-MA for 24 and 48 h were measured to be 50 and 80 HV, respectively. This indicates that the powder after i-MA for 48 h had more Al2O3 precipitates contributing to precipitation hardening than that after i-MA for 24 h. This data validate the TEM observation of Figs. 5(b) and (d).
3.2 After consolidation
To investigate the difference between two consolidated compacts from the two powder types, TEM observation was performed using two specimens consolidated from powders after i-MA and c-MA for 48 h, under the conditions presented in Fig. 1. Figure 7 presents the results of the TEM observation. The specimen of i-MA possessed finer Al grains than that of c-MA. Figure 8 shows the grain boundary of Al in the specimen of i-MA. Figure 8(d) is a TEM micrograph obtained under a diffraction condition different from Fig. 8(a) and displays an Al grain with a dark contrast enclosed by a white dashed line near the micrograph’s center. Al2O3 particles were observed at the Al grain boundary as indicated by arrowheads in Fig. 8(a), which can be confirmed in the dark-field image using $11\bar{2}6$ reflection of Al2O3, as presented in Fig. 8(b). Figure 8 suggests the following facts: Pinning of Al2O3 particles suppressed the grain boundary migration of Al grains during consolidation.10,11) For the powders obtained from i-MA and c-MA, the Al grain boundary migration was pinned by two types of Al2O3 particles, namely, Al2O3 particles, which existed before the consolidation, and Al2O3 precipitate, which formed during the consolidation. The c-MA powder included the residual Al2O3 particles {Fig. 5(e)}, but did not include the Al2O3 precipitates that were formed during MA. Therefore, the c-MA powder included less amount of the preexisting Al2O3 particles than the i-MA powder. Thus, i-MA powder had more Al2O3 particles contributing to the pinning of the Al grain boundary migration during consolidation than the c-MA powder. That is why the powder of i-MA exhibited finer Al grains than that of c-MA in Fig. 7.

Figure 9 presents the results of tensile tests. Tensile specimens were cut from the compacts consolidated from the powders after i-MA and c-MA for 48 h. Two specimens of i-MA and c-MA were tested as presented in Figs. 9(a), (b) and (c), (d), respectively. The i-MA yield strengths were 284 and 266 MPa, and those of c-MA were 229 and 224 MPa. The i-MA specimens exhibited higher yield strengths than those of c-MA, although the two test results were scattered. This result corresponds to the fact that the i-MA compact had finer Al grains than the c-MA compact and is consistent with the TEM observation in Fig. 7. In the case of elongation, detailed experiments and further consideration are needed, which will be left to future research.
In this study, we obtained two types of powders that influence the properties of compacts after consolidation: Al2O3 particle-dispersed Al nanocomposite and SSS powders. The reasons for obtaining the two types of powders are described further below.
4. Discussion
Particle-dispersed nanocomposite and SSS powders were obtained by MA. According to the MA of an Al–Cu alloy,8) SSS of α-Al was formed at an early stage of MA, and then, precipitation occurred due to aging after 400 h. The aging was reported to have occurred due to local temperature rise by the collision between balls and powder during MA. Alternatively, in this study, the temperature rise during MA must have been higher in c-MA than in i-MA because c-MA was a continuous process. However, precipitation occurred in i-MA. Thus, precipitation did not occur due to a rise in temperature during MA; the amount of oxygen in the MA atmosphere is the main factor influencing the precipitation in i-MA.
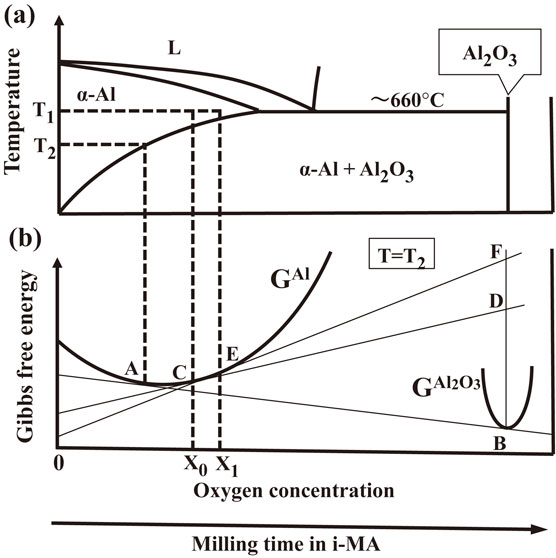
The effect of the amount of oxygen on the precipitation behavior is discussed below from the thermomechanical viewpoint. Figure 10(a) presents a schematic phase diagram of the Al–O system, which is described based on the Al–O phase diagram.25) Though the solubility limit of O in Al is minimal in the Al–O system (less than 3 × 10⁻⁸ mol% at about 660°C), the region of the lower O content in Fig. 10(a) is magnified to discuss the region of α-Al solid solution. Besides, eutectic reaction at about 660°C at O concentration of less than 3 × 10⁻⁸ mol% is also described in Fig. 10(a) because the probable existence of the eutectic reaction is reported in Ref. 25). Therefore, the phase diagram of Fig. 10(a) is described using a horizontal axis consisting of two different scales: The lower O concentration sides of the eutectic composition is magnified as compared with the higher O concentration side. Figure 10(b) presents the Gibbs free energy curves at a temperature, T2, in Fig. 10(a). Alloys with compositions X0 and X1 are α-Al solid solutions at a temperature T1 and are in a two-phase equilibrium of α-Al and Al2O3 at temperature T2, which is indicated by the common tangent, AB, of α-Al (GAl) and Al2O3 ($\text{G}^{\text{Al}_{2}\text{O}_{3}}$) free energy curves. In this study, the Al2O3 particles precipitated after i-MA for 24 h (Figs. 4 and 5). Thus, the O concentration after i-MA for 24 h is higher than the solubility limit at room temperature. The O concentration after i-MA for 48 h is higher than that after i-MA for 24 h because a higher amount of O was involved in the MA. Thus, the powders’ compositions after i-MA for 24 and 48 h can be considered X0 and X1 in Fig. 10, respectively. The driving forces for precipitation in the powders after i-MA for 24 and 48 h are represented by DB and FB, respectively, in Fig. 10(b), where D and F denote points with the same composition and on the tangents at the points C and E, respectively. Further, the powder after i-MA for 48 h exhibits a larger precipitation driving force than that after i-MA for 24 h. The larger driving force reduces the activation energy barrier for nucleation and increases nucleation rate according to eqs. (1) and (2) based on the homogeneous nucleation theory,26)
| \begin{equation}
\Delta G^{*} = \frac{16\pi \gamma^{3}}{3(\Delta G_{n}/V_{m} - \Delta G_{s})^{2}}
\end{equation}
| (1) |
| \begin{equation}
N \approx \exp \left(-\frac{\Delta G_{m}}{kT}\right)\exp \left(-\frac{\Delta G^{*}}{kT}\right)
\end{equation}
| (2) |
where
$\Delta G^{*}$ denotes the activation energy barrier for nucleation; γ, the interfacial energy; Δ
Gn, the driving force for precipitation;
Vm, the molar volume of Al
2O
3; Δ
Gs, the increment of misfit strain energy;
N, the nucleation rate; and Δ
Gm, the activation energy of atomic migration. Therefore, an increase in the nucleation rate due to an increase in the amount of oxygen is consistent with the fact that the powder after i-MA for 48 h promoted the precipitation of Al
2O
3 compared with the powder after i-MA for 24 h {
Figs. 5(b) and (d)}.
Alternatively, the powder after c-MA for 48 h exhibited no Al2O3 precipitation, which resulted in the formation of SSS {Fig. 5(f)}. The occurrence of Al2O3 precipitation depends more on the temperature and amount of oxygen. If the temperature difference between c-MA and i-MA is small, then the amount of oxygen will be responsible for the difference of the Al2O3 precipitation between c-MA and i-MA. In c-MA, the jar was opened once such that the amount of oxygen involved in MA was 3 vol%, which was the oxygen concentration in the glove box. Alternatively, in i-MA for 24 h, the jar was opened three times, such that the amount of oxygen involved in MA was three times larger than c-MA for 48 h at most. Assuming that all of the oxygen in the MA atmosphere were dissolved in Al and all of the added Al2O3 were dissociated and dissolved in Al, the oxygen concentrations in the alloyed powders were 2.40 and 2.47 mol%, respectively. However, the XRD and TEM results indicated that the alloyed powders had residual Al2O3 particles. The volume fractions of the residual Al2O3 after c-MA for 48 h and after i-MA for 24 h were estimated from the integral intensity in the XRD profiles {Fig. 3(b)}. These values were 0.60 and 0.84 vol%, respectively. The corresponding amounts of oxygen and aluminun in the residual Al2O3 were not involved in the calculation of the dissolved oxygen concentration, and all of the oxygen in the MA atmosphere were included in the calcuration. Consequently, the dissolved oxygen concentrations after c-MA for 48 h and after i-MA for 24 h were 1.73 and 1.54 mol%, respectively. The powder after i-MA for 24 h exhibited a smaller amount of dissolved oxygen than that after c-MA for 48 h probably because the Al2O3 peak was obtained from the residual and precipitated Al2O3. Thus, the amounts of Al2O3 precipitates were estimated from the TEM photographs of the powder after i-MA for 24 h {Fig. 5(b)}, and the corresponding amount of oxygen and aluminum was involved in the calculation of the dissolved oxygen concentration. The estimated volulme fraction of the precipitated Al2O3 was 6.5 × 10⁻³ vol%, which was obtained using the average diameter of the precipitated Al2O3, 3.6 nm, and the assumed foil thickness, 100 nm. The evaluated result was the same, i.e., the dissolved oxygen concentration after c-MA for 48 h and after i-MA for 24 h were 1.73 and 1.54 mol%, respectively. That is because the amount of oxygen obtained from the precipitates was only 0.8% of that obtained from the residual Al2O3. Therefore, it implies that not all Al2O3 phases that were not detected by XRD dissolved in the Al matrix, i.e., that some of the Al2O3 phases that were not detected by XRD were refined by milling and did not dissolve in the Al matrix. This phenomenon was supported by a report on the fabrication of Al–Ti alloys using MA of Al and Ti.27) In this report, the Ti phase, which was not detected by XRD, was identified by TEM to be particles with a size less than 20 nm. It is fair to assume that certain Al2O3 particles were not detected by XRD and did not contribute to the dissolution of oxygen in the Al matrix in this study. However, the amount of oxygen solutes associated with undetected Al2O3 particles is unknown. Consequently, a precise amount of dissolved oxygen cannot be evaluated. However, assuming that the powder after c-MA for 48 h included a larger amount of Al2O3 undetected by XRD and undissolved in the Al matrix than the powder after i-MA for 24 h, certain assumed amounts of the undetected and undissolved Al2O3 in the powders after c-MA for 48 h and i-MA for 24 h were excluded from the calculation of the dissolved oxygen concetration; The following evaluation was qualitatively obtained: The powder after i-MA for 24 h contained more dissolved oxygen derived from both Al2O3 and the MA atmosphere than the powder after c-MA for 48 h, although the powder after c-MA for 48 h contained more amount of dissolved oxygen derived from Al2O3 than the powder after i-MA for 24 h. The assumption that the powder after c-MA for 48 h included more amount of Al2O3 undetected by XRD and undissolved in the Al matrix than the powder after i-MA for 24 h is reasonable because long-time milling promotes refinement of Al2O3 particles and alloying of Al and O.28)
The aforementioned consideration is summarized as follows: Oxygen solutes were supplied from the MA atmosphere and dissociated Al2O3 particles. The powder after c-MA for 48 h contained more dissolved oxygen solutes derived from Al2O3 than the powder after i-MA for 24 h due to the extended milling time. However, the powder after i-MA for 24 h included a higher total amount of dissolved oxygen than the powder after c-MA for 48 h because more oxygen solutes were supplied from the MA atmosphere, which resulted in the precipitation of Al2O3.
In this study, we obtained particle-dispersed nanocomposite and SSS powders, depending on the amount of oxygen in the MA atmosphere. The compacts consolidated from the two powder types exhibited the difference in the yield strengths (Fig. 9) due to the difference in the Al grain sizes (Fig. 7). Notably, the nature of the alloyed powder affected the properties of the consolidated compacts.
5. Conclusions
In this study, the MA process of Al and Al2O3 powders was investigated using XRD, TEM, and Vickers microhardness. Tensile tests and TEM observations were performed using the consolidated compacts. The following results were obtained:
-
(1)
Al2O3 particle-dispersed Al nanocomposite and SSS powders were fabricated via i-MA and c-MA, respectively.
-
(2)
The critical difference between the two powder types is the amount of oxygen in the MA atmosphere. Precipitation of Al2O3 from the supersaturated Al matrix was accelerated when the amount of oxygen in the MA atmosphere was high and the driving force for precipitation was larger than a certain threshold. Finally, Al2O3 particle-dispersed Al nanocomposite powder was obtained. Alternatively, the precipitation of Al2O3 did not occur when the amount of oxygen in the MA atmosphere was not larger than a certain threshold. Consequently, SSS powder was obtained. Two types of powders can be fabricated by controlling the amount of oxygen in the MA atmosphere.
-
(3)
Al2O3 particle-dispersed Al nanocomposite powder exhibited a higher Vickers microhardness than SSS powder.
-
(4)
The compact consolidated from Al2O3 particle-dispersed Al nanocomposite powder had finer Al grains than SSS powder. That is because the former had more Al2O3 dispersoids, which suppressed the Al grain boundary migration during consolidation via the pinning effect, whereas the latter powder did not have preexisting Al2O3 dispersoids before consolidation.
-
(5)
The compact consolidated from Al2O3 particle-dispersed Al nanocomposite powder exhibited higher yield strengths than that of SSS powder.
Acknowledgment
The authors gratefully acknowledge Advanced Research Support Center and the Joint Usage/Research Center PRIUS in Ehime University for supplying the TEM and PIPS used in the present study, respectively. The authors express sincere thanks to Prof. Sengo Kobayashi for allowing us to use XRD, Vickers microhardness and tensile testing instruments. The present study was partly supported by the research fund from The Light Metal Educational Foundation, Inc. and Grants-in-Aid for Scientific Research from JSPS (No. 20K05117) and the research fund from Ehime University for collaboration between National Institute of Technology, Niihama College and Ehime University.
REFERENCES
- 1) J.S. Benjamin: Metall. Trans. 1 (1970) 2943–2951. doi:10.1007/BF03037835
- 2) A. Calka, W. Kaczmarek and J.S. Williams: J. Mater. Sci. 28 (1993) 15–18. doi:10.1007/BF00349027
- 3) D.L. Zhang, T.B. Massalski and M.R. Paruchuri: Metall. Mater. Trans. A 25 (1994) 73–79. doi:10.1007/BF02646676
- 4) W. Guo, A. Iasonna, M. Magini, S. Martelli and F. Padella: J. Mater. Sci. 29 (1994) 2436–2444. doi:10.1007/BF00363438
- 5) S. Xi, K. Zuo, X. Li, G. Ran and J. Zhou: Acta Mater. 56 (2008) 6050–6060. doi:10.1016/j.actamat.2008.08.013
- 6) M.S. El-Eskandarany, K. Aoki and K. Suzuki: Appl. Phys. Lett. 60 (1992) 1562–1563. doi:10.1063/1.107251
- 7) K. Kimura, F. Takada and W.N. Myung: Mater. Sci. Eng. 97 (1988) 125–128. doi:10.1016/0025-5416(88)90025-0
- 8) F. Li, K.N. Ishihara and P.H. Shingu: Metall. Trans. 22 (1991) 2849–2854. doi:10.1007/BF02650245
- 9) D.K. Mukhopadhyay, C. Suryanarayana and F.H.S. Froes: Metall. Mater. Trans. A 26 (1995) 1939–1946. doi:10.1007/BF02670665
- 10) S.W. Xu, N. Matsumoto, S. Kamado, T. Honma and Y. Kojima: Mater. Sci. Eng. A 523 (2009) 47–52. doi:10.1016/j.msea.2009.05.032
- 11) T. Sakamoto, S. Otsuka and S. Kobayashi: Mater. Sci. Forum 879 (2017) 1634–1638. doi:10.4028/www.scientific.net/MSF.879.1634
- 12) G.L. Copeland, M.M. Martin, D.G. Harman and W.R. Martin: Powder Technol. 3 (1969) 136–152. doi:10.1016/0032-5910(69)80066-5
- 13) N. Hansen: Trans. Metall. Soc. AIME 245 (1969) 1305–1312.
- 14) J.S. Benjamin and M.J. Bomford: Metall. Trans. A 8 (1977) 1301–1305. doi:10.1007/BF02643845
- 15) S.M. Zebarjad and S.A. Sajjadi: Mater. Des. 27 (2006) 684–688. doi:10.1016/j.matdes.2004.12.011
- 16) N. Saheb, M.S. Khan and A.S. Hakeem: J. Nanomater. 2015 (2015) 609824. doi:10.1155/2015/609824
- 17) A. Wagih: Trans. Indian Inst. Met. 69 (2016) 851–857. doi:10.1007/s12666-015-0570-4
- 18) S.M. Zebarjad and S.A. Sajjadi: Mater. Des. 28 (2007) 2113–2120. doi:10.1016/j.matdes.2006.05.020
- 19) M. Tavoosi, F. Karimzadeh and M.H. Enayati: Mater. Sci. Technol. 26 (2010) 1114–1119. doi:10.1179/174328409X459329
- 20) A. Wagih, A. Fathy and T.A. Sebaey: Int. J. Mater. Prod. Technol. 52 (2016) 312–332. doi:10.1504/IJMPT.2016.075497
- 21) M. Toozandehjani, K.A. Matori, F. Ostovan, S.A. Aziz and M.S. Mamat: Materials 10 (2017) 1232. doi:10.3390/ma10111232
- 22) P.S. Goodwin, D.K. Mukhopadyay, C. Suryanarayana, F.H. Froes and C.M. Ward-Close: Titanium’95, Science and Technology, vol. 3, ed. by P. Blenkinsop et al., (Institute of Materials, London, UK, 1995) pp. 2626–2633.
- 23) R. Irmann: Metallurgia 40 (1952) 125–133.
- 24) W.P. Davey: Phys. Rev. 25 (1925) 753–761. doi:10.1103/PhysRev.25.753
- 25) H.A. Wriedt: Bull. Alloy Phase Diagr. 6 (1985) 548–553. doi:10.1007/BF02887157
- 26) D.A. Porter, K.E. Easterling and M.Y. Sherif: Phase Transformations in Metals and Alloys, 3rd edition, (CRC Press, Boca Raton, 2009) pp. 263–266.
- 27) H.S. Kim, H.G. Jeong, S. Hanada and D.W. Kum: J. Japan Inst. Metals 63 (1999) 938–943. doi:10.2320/jinstmet1952.63.7_938
- 28) C. Suryanarayana: Prog. Mater. Sci. 46 (2001) 1–184. doi:10.1016/S0079-6425(99)00010-9


