Mechanics of Materials
Effect of Ice Saturation on Gas Permeability and Elastic Wave Velocity of Frozen Berea Sandstone
2023 年 64 巻 1 号 p. 196-204

詳細
2023 年 64 巻 1 号 p. 196-204
In order to establish new technology for the storage of natural gas hydrates in underground rock tanks, it is necessary to precisely and quantitatively evaluate and understand the gas/liquid permeability characteristics as well as the mechanical and deformational characteristics of the rock mass at low temperatures. Moreover, based on these characteristics, it is essential to evaluate the behavior, robustness, and tightness of the rock tanks.
In this study, gas permeability experiments were conducted on Berea sandstone at low temperatures, which have not been done before, to evaluate the effect of ice saturation on the permeability. As a result, it was confirmed that the permeability tended to decrease with an increase pore fluid pressure. Compared to the initial permeability measured at 20°C, the permeability measured at −20°C showed a smaller value. Furthermore, it was observed that the permeability decreased with increasing ice saturation. The water permeability was estimated by taking into account the Klinkenberg effect, and the change in permeability was examined using the Kozeny-Carman equation. As a result, the permeability at a pore occupation ratio of 0, estimated from the regression curve, tends to overestimate the permeability obtained from the water permeability experiments.
The relationship between the P-wave velocity and ice saturation was found by measuring the elastic wave velocity, and the validity of the experimental results was discussed using estimation equations based on the cementation theory. The P-wave velocity at low temperatures tended to increase with increasing ice saturation and was 2.0 times higher when the pore occupation ratio was greater than 70%. In the range of porosity between 0.1 and 0.2, the experimental values were within the range of the estimated values, while in the range of porosity below 0.1, the experimental values exceeded the estimated values.
In recent years, the introduction of renewable energy sources has been promoted, but the dependence on fossil energy sources remains high and is expected to continue for some time. Among them, natural gas is attracting attention as a clean energy source that emits less CO2 than oil and coal, and its supply is increasing, currently accounting for about 30% of all fossil energy in Japan. Natural gas is transported as liquefied natural gas (LNG), because of its 600/1 volume compression ratio, and stored in aboveground and semi-underground tanks. Since LNG needs to be liquefied by cooling in large-scale production facilities below −162°C, it can be transported economically in large volumes and over long distances from large-scale gas fields. However, it requires energy for cooling, and thus, cannot be stored for long periods of time as is the case with oil.
On the other hand, small- and medium-sized gas fields, which are not cost-effective for LNG, are said to account for 40% of the world’s reserves. They are mostly distributed in Southeast Asia and Oceania. In addition, research and development are in progress to hydrate natural gas as a new means of transporting natural gas.1,2) Natural gas hydrates (NGHs) are inclusion hydrates in which natural gas molecules are incorporated into the three-dimensional network structure of the water molecules. NGHs are artificially produced and are distinguished from methane hydrates, a natural resource.3) Although the compression ratio of NGHs is 170/1, it is stable at −20°C under atmospheric pressure. Therefore, it is attracting attention as a newly developed cost-effective transportation method for small- and medium-sized gas fields.2) The low cost of NGHs also makes their long-term storage possible.1)
Oil and gas can be stored in surface or underground tanks, underground rock tanks, or offshore tanks. In the rock tank system, oil and oil gas are sealed with groundwater to maintain an airtight condition, according to a system that is well established. This system has the advantages of requiring only a small area of land, being resistant to natural disasters, such as earthquakes and lightning strikes, involving a low risk of leakage and diffusion, and having little impact on the landscape. However, in order to establish new technology for storing NGHs in underground rock tanks, it is necessary to precisely and quantitatively evaluate and understand the gas/liquid permeability characteristics as well as the mechanical and deformational characteristics of the rock mass under low-temperature conditions. And, based on these conditions, it is essential to develop evaluation technology for the behavior, robustness, and airtightness of underground rock tanks.
There have been many studies on the mechanical and thermophysical properties of rocks at low temperatures and on the storage of low-temperature materials in rock tanks.4) Inada et al.5–8) obtained the mechanical properties of rocks at low temperatures by experiments and used the results to study the behavior of rock masses when LNG is stored in rock tanks.
However, there are no examples of studies on the gas permeability of rocks and rock masses at low temperatures. On the other hand, gas permeability at low temperatures has been studied for frozen grounds for the purpose of methane hydrate development.9–11) Seyfried and Murdock9) pointed out that the gas permeability of sand depends on the saturation of ice and water, and that the permeability of frozen samples is lower than that of non-frozen samples at the same saturation level. Wang et al.10) experimentally clarified the relationship between methane gas permeability and ice saturation in frozen sand. They found that, for sand specimens with a dry permeability of 2.7 darcy and a porosity of 0.4, the permeability was 1/100 for ice saturation of 0.6 and 10−5 for that of 0.8. Chuvilin et al.11) obtained a permeability of 10−2–10−4 times for ice saturation of 0.5 in a sand specimen with a porosity of about 0.4. Gas permeability experiments on rocks at temperatures above room temperature have been reported.12–15) Eischens and Swanson12) proposed a method for gas permeability experiments on rocks that have low permeability. Takeda et al.13) developed an apparatus that can perform gas permeability experiments on rocks under confining pressure and measured permeabilities in the order of 10−20 m2. Klinkenberg14) pointed out that the permeability determined by gas permeability experiments on rocks is greater than that determined by water permeability experiments, called the Klinkenberg effect, and leads to the relationship between gas and water permeabilities. Tanigawa and Shimamoto15) measured gas and water permeabilities in the same sample and reported that the Klinkenberg effect is not negligible when the permeability is less than 10−18 m2 and the pore differential pressure is less than 0.3 MPa. In this study, gas permeability experiments were conducted using Berea sandstone at low temperatures to evaluate the effect of ice saturation on the permeability. The water permeability was estimated considering the Klinkenberg effect,14) and the changes in permeability were examined using the Kozeny-Carman equation.
In addition, P-wave velocity is one of the mechanical properties that can be measured nondestructively and relatively easily and is one of the most commonly measured mechanical properties in rocks. It is known that the P-wave velocity of rocks increases with decreasing temperature in the range below 0°C, and this tendency is more pronounced in wet conditions. It is also known that the P-wave velocity decreases with freezing and thawing effects.6,7) Jacoby et al.16) and Dvorkin and Nur17) proposed an estimation equation of P-wave velocity based on the cementation theory, which assumes that the mineral particles are in mechanical contact with each other due to the cement. They found a relationship between the P-wave velocity and the porosity in sandstone and saturated frozen sand. Yasuhara et al.18) used Berea sandstone and this estimation equation to verify the relationship between the P-wave velocity and the calcium carbonate precipitation due to mineral trapping in the pores. In this study, elastic wave velocities were measured and a relationship between the P-wave velocity and ice saturation was found. Then this estimation equation was applied in this study, and the validity of the experimental results was discussed.
In this study, gas permeability experiments were conducted on Berea sandstone under low temperature and wet conditions. Elastic wave velocities were also measured under low temperatures.
The experimental procedure for this study is shown in Fig. 1. The procedure for the gas permeability experiments under low-temperature wetting conditions is as follows. Firstly, the specimens are dried, and elastic wave velocity measurements and gas permeability experiments are performed at 20°C. These experiments yield the initial elastic wave velocity and the initial gas permeability. Next, the specimens are wetted in two ways. In this case, the water saturation should be set in the range of 0.0 to 1.0, varying by 0.1. The specimen with a given water saturation is cooled to −20°C and subjected to elastic wave velocity measurements and gas permeability experiments.
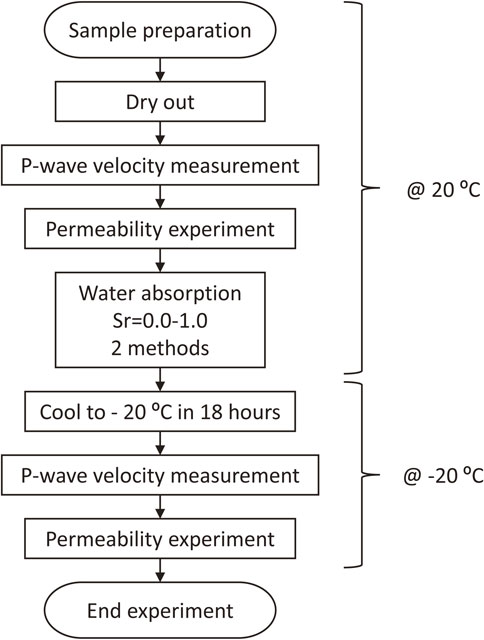
Experimental procedure for this study.
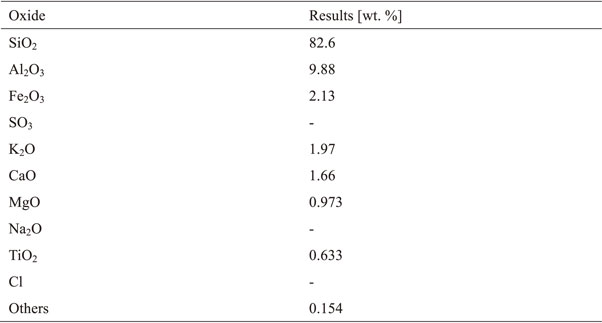
Berea sandstone from Ohio, U.S.A., was used in this study. Berea sandstone is a sandstone composed mainly of quartz with small amounts of feldspar and calcite and trace amounts of clay minerals.19,20) Table 1 shows the chemical composition of the Berea sandstone determined by an X-ray fluorescence analysis.21) Most of the existing sandstone reservoirs have porosities in the range of 10–30%. As the average porosity of the Berea sandstone specimens used in this study was 20.56%, it is within the common range. It is also considered easier to determine the effects of freezing water in the pores on the permeability and P-wave velocity.22,23) Water in the macro-pores of sandstone has been reported to freeze upon cooling,24) which is consistent with the experimental conditions of this study. A cylindrical core with a diameter of 30 mm was extracted from the rock block using a boring machine. The ends of the cylindrical core were then cut with a cutter to a length of approximately 70 mm, and the end faces were polished and shaped to a height of 60 mm. The parallelism and flatness were ±0.1 mm. Figure 2 shows an external view of a Berea sandstone specimen.
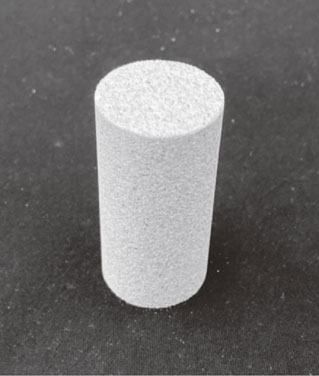
External view of Berea sandstone specimen.
When the density of water is ρw, the water saturation Sr of the Berea sandstone specimen is given by eq. (1).
| \begin{equation} S_{r} = \frac{V_{w}}{V_{v}} = \cfrac{\cfrac{(M_{t} - M_{d})}{\rho_{w}}}{\cfrac{(M_{\textit{sat}} - M_{d})}{\rho_{w}}} = \frac{M_{t} - M_{d}}{M_{\textit{sat}} - M_{d}} \end{equation} | (1) |
The shaped specimens were placed in a desiccator filled with silica gel until there was no change in mass. The specimens were wetted in two ways: saturated and then dried (Saturated - Wet) and dry and then wet (Dry - Wet). In the Saturated-Wet method, the specimens immersed in distilled water are first vacuum degassed and saturated. Then, the saturated specimens are placed in a desiccator containing silica gel and dried until a specified mass of water saturation is reached. In the Dry-Wet method, the specimen is first placed in a desiccator containing silica gel until its mass does not change, and then distilled water is allowed to penetrate the side surfaces of the specimen using a mist sprayer to reach the specified water saturation level. At −20°C, the pore water freezes and expands, so the volume change is taken into account when determining the saturation. The saturation was increased from 0 to 1.0. In this study, pore occupation ratio Rp18) is used instead of the degree of saturation when the pore water is frozen.
| \begin{equation} R_{p} = 1 - \frac{\phi}{\phi_{i}} \end{equation} | (2) |
The specimen saturation was controlled in a thermostatic laboratory at 20°C. The gas permeability experiments and elastic wave velocity measurements were performed in an incubator set up in the thermostatic laboratory. For all the experiments and measurements, the temperature was controlled to be 20°C or −20°C in an incubator located in the thermostatic laboratory. The specimens and the pressure cell for the gas permeability experiments were placed in the incubator at 20°C and cooled to −20°C over a period of 18 hours before the experiments were conducted.
2.4 Gas permeability experimentsThe gas permeability experiments were conducted under isotropic pressure-holding conditions. Figure 3 shows a conceptual and external view of the pressure cell. The range in operating temperature of the pressure cell was 20°C to −20°C, and the maximum confining pressure was 40 MPa, within which the temperature and confining pressure could be controlled over a long period of time. Rock specimens, 30 mm in diameter and 60 mm in height, were placed between pedestals and covered with rubber sleeves. The specimens were then mounted in a pressure cell, a loading disc spring was installed, and axial pressure was applied by tightening a screw at the top center. Figure 4 shows a conceptual diagram of the apparatus used for the gas permeability experiments. After the pressure cell was installed in the incubator, the piping was connected, and silicon oil was injected for the confining pressure. After the temperature became stable, confining pressure was applied by a hand-pump to control a predetermined confining pressure together with the axial pressure. Nitrogen gas was used as the permeate fluid, and the permeate pressure was controlled by a regulator. The flow rate of the discharged nitrogen gas after penetration was measured by a mass flow meter.
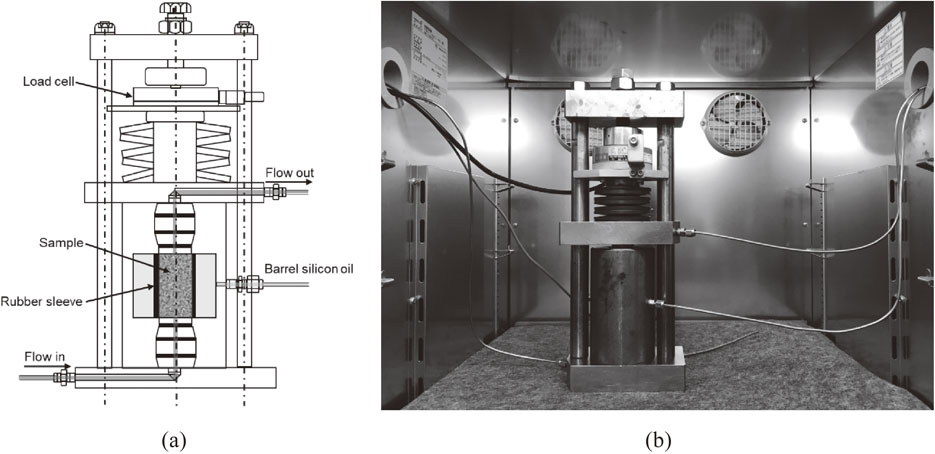
Conceptual diagram and external view of pressure cell: (a) Conceptual diagram and (b) External view.
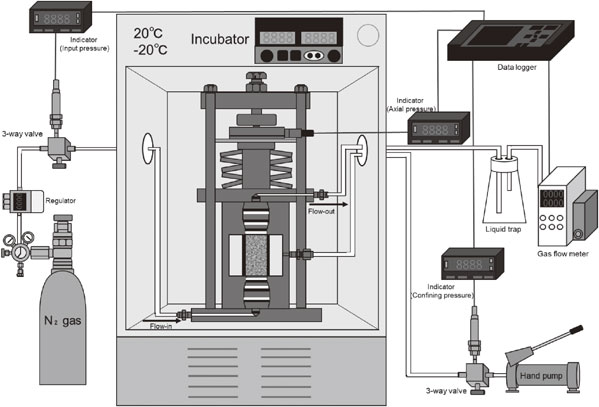
Conceptual diagram of gas permeability experimental apparatus.
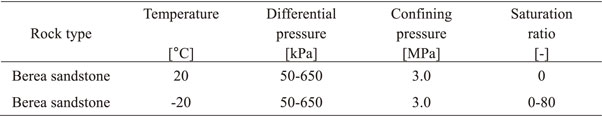
Table 2 shows the boundary conditions of the gas permeability experiments. The gas pressure on the inflow side was increased in increments of 50 kPa from 50 kPa to 650 kPa. The confining pressure was set to 3.0 MPa to simulate an underground rock tank about 300 m below the surface.
When gas is used as the pore fluid, the compressibility of the gas must be taken into account for the permeability. Under the conditions of the Darcy law, permeability K can be expressed by the following equation:13)
| \begin{equation} \frac{Q_{g}}{A} = \frac{K}{\mu_{g}L}\frac{(P_{\textit{up}})^{2} - (P_{\textit{down}})^{2}}{2P_{\textit{down}}} \end{equation} | (3) |
When the experiment was conducted at −20°C, the gas permeate flow rate was temperature-corrected using Charles’ law, as shown in eq. (4).
| \begin{equation} \frac{Q_{gm}}{T_{1}} = \frac{Q_{g}}{T} \end{equation} | (4) |
Since the viscosity coefficient depends on the temperature, the viscosity coefficient of the N2 gas was calculated using the following equation:25)
| \begin{equation} \frac{\mu_{g}}{\mu_{0}} = \left(\frac{T}{T_{0}}\right)^{\frac{3}{2}}\left(\frac{T_{0} + S}{T + S}\right) \end{equation} | (5) |
When evaluating the effect of permeability on each pore occupation ratio under low temperature conditions, the initial permeability is different for each specimen, so the permeability is normalized by the following equation:
| \begin{equation} K_{n} = \frac{K}{K_{\textit{init.}}} \end{equation} | (6) |
The P-wave velocities were measured in the Berea sandstone under low temperature and wet conditions to evaluate the effects of the ice saturation ratio on the elastic modulus. The P-wave velocity is measured using an ultrasonic nondestructive testing machine. In rocks with large porosity, elastic waves with low frequency propagate easily. Therefore, the frequency of the transducer used in this study was 50 kHz. As shown in Fig. 5, both ends of the transducer are attached to the end face of the specimen and the transducer is put into operation. For the low-temperature wet measurements, the experiments were conducted with the specimens frozen at −20°C. The tester used in this study automatically measures the time difference between the incident and the received waves and displays it as the propagation time. Measurements were taken five times for each condition, and the average value was taken as propagation time t [s]. The P-wave velocity, Vp,exp [m s−1], was obtained by the following equation:
| \begin{equation} V_{p,\textit{exp.}} = \frac{L}{t} \end{equation} | (7) |
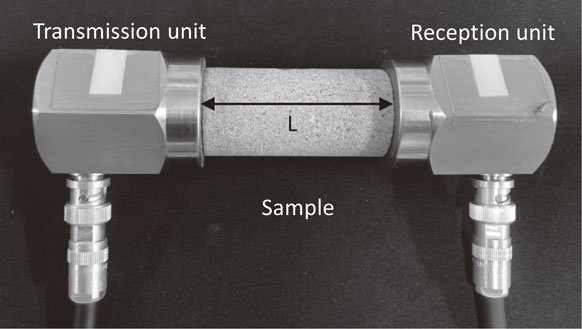
Ultrasonic testing device to measure P-wave velocity.
Since the initial elastic wave velocity is different for each specimen, the P-wave velocity is normalized by the following equation to evaluate the change in P-wave velocity:
| \begin{equation} V_{pn} = \frac{V_{p,\textit{exp}}}{V_{p,\textit{init.}}} \end{equation} | (8) |
When determining the permeability in the gas permeability experiments, a formula was used that assumes that the Darcy law holds. Therefore, the Reynolds number was obtained at the maximum flow rate in each experiment. The Reynolds number was smaller than 2300 in all experiments, confirming that the flow was laminar. Figure 6 shows the results of the gas permeability experiments. The permeability measured at −20°C was smaller than the initial permeability measured at 20°C. The difference between the initial permeability and the permeability at −20°C increases as the pore occupation ratio increases. In all experiments, the permeability tended to decrease with an increase in gas differential pressure. Figure 7 shows the relationship between the permeability and the pore occupation ratio measured at −20°C and the relationship between the normalized permeability and the pore occupation ratio. The initial permeability is the permeability of the gas permeability experiment at 20°C and 0% water saturation. The permeability is the average of the permeabilities measured at each gas differential pressure (50–650 kPa). The permeability in the dry state is 1.68 × 10⁻¹³ m2 for the initial permeability at 20°C and 1.39 × 10⁻¹³ m2 for the permeability at −20°C, yielding a normalized permeability of 0.828. The decrease in temperature may have resulted in the shrinkage of the pore diameter, making it more difficult for the gas to permeate. The permeability and normalized permeability decreased with increasing pore occupation ratio. Under the Saturated-Wet condition, the pore occupation ratio was greater than 80%, and under the Dry-Wet condition, the pore occupation ratio was greater than 70%, with no detection of gas emission. This is considered to be due to the freezing of the pore water, which blocks the continuous pore space through which gas can permeate.
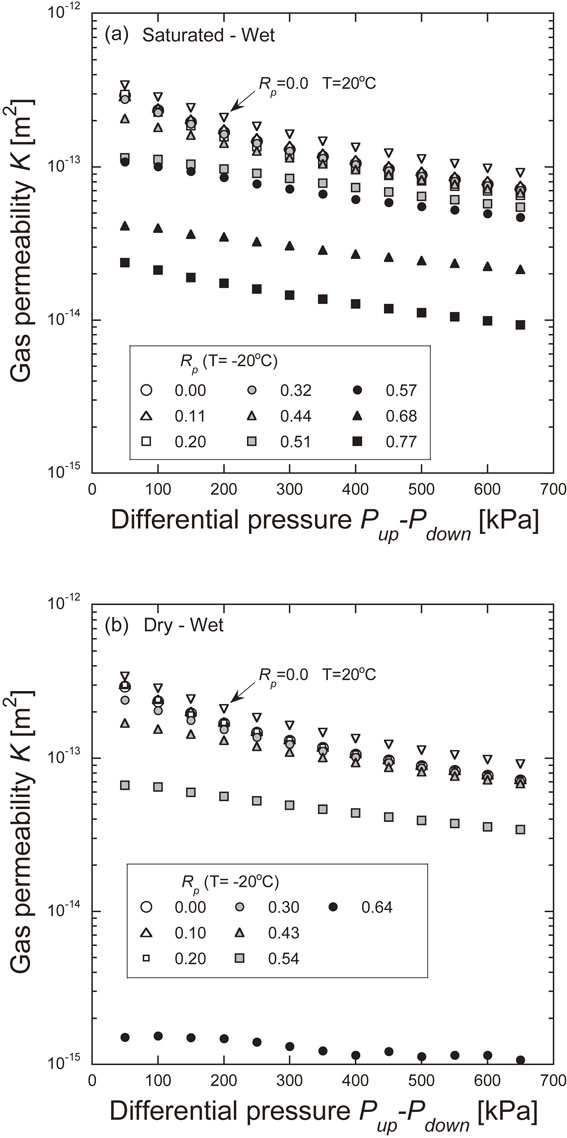
Results of gas permeability experiments.
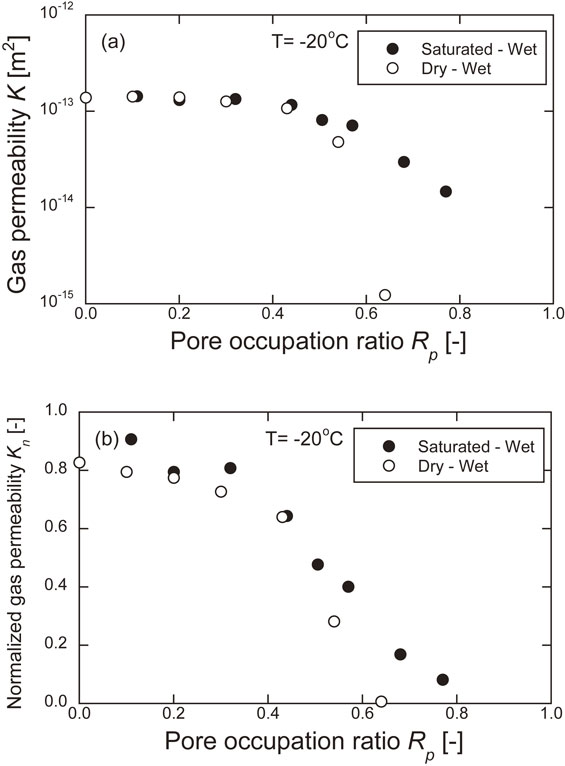
Relationship between permeability and pore occupation ratio measured at −20°C and between normalized permeability and pore occupation ratio.
Figure 8 shows the relationship between the P-wave velocity and the pore occupation ratio measured at −20°C and between the normalized P-wave velocity and the pore occupation ratio. The P-wave velocity at 20°C in the dry condition was 2.06 km/s, and at −20°C in the dry condition, it was 2.10 km/s. The normalized P-wave velocity was 1.02. The P-wave velocity at low temperatures tended to increase as the pore occupation ratio increased, and the normalized P-wave velocity was about 2.0 when the pore occupation ratio was greater than 0.7. The P-wave velocity is considered to have increased due to the binding of mineral particles by the freezing of the pore water. Since the P-wave velocity depends on the elastic modulus, the elastic modulus is also considered to have increased.
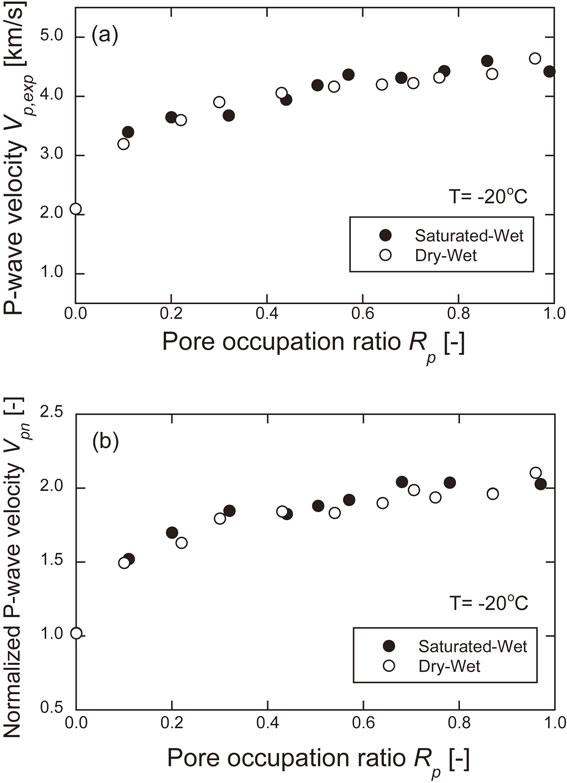
Relationship between P-wave velocity and pore occupation ratio measured at −20°C and between normalized P-wave velocity and pore occupation ratio.
Klinkenberg14) reported that the permeability of rocks with gas as the fluid is larger than that of rocks with water as the fluid. This is due to the increase in gas flow along the pore wall, the so-called slip flow, and the increase in gas velocity, called the Klinkenberg effect.14) This relationship can be expressed by the following equation:
| \begin{equation} k_{g} = k_{l}\left(1 + \alpha \frac{\kappa}{4\pi\sqrt{2}r^{3}}\frac{T}{p}\right) \end{equation} | (9) |
In other words, kg and p−1 have a linear relationship. Figure 9 shows the relationship between the experimentally determined permeability and p−1. However, it is assumed that p is the average value of Pup and Pdown, Ppore. ave., in the experiments in this study. Under all experimental conditions, the permeability and p−1 have a linear relationship, and the relationship in eq. (9) is considered to be satisfied. Liquid permeability kl was estimated from the intercepts of these approximate lines and is shown in Fig. 10. It should be noted that the estimated liquid permeability values that were negative were excluded. The experimental results suggest that the linear relationship in eq. (9) does not hold in the range of high pore fluid pressure where the pore occupation ratio is less than about 0.4. It is also inferred that the relationship is convex downward in this range. The estimated permeability decreases as the pore occupation ratio increases. Here, the relationship between permeability and the pore occupation ratio was examined using the Kozeny-Carman equation shown in eq. (10).
| \begin{equation} k_{l} = \frac{c_{0}}{S_{v}^{2}}\frac{\phi^{3}}{(1 - \phi)^{2}} \end{equation} | (10) |
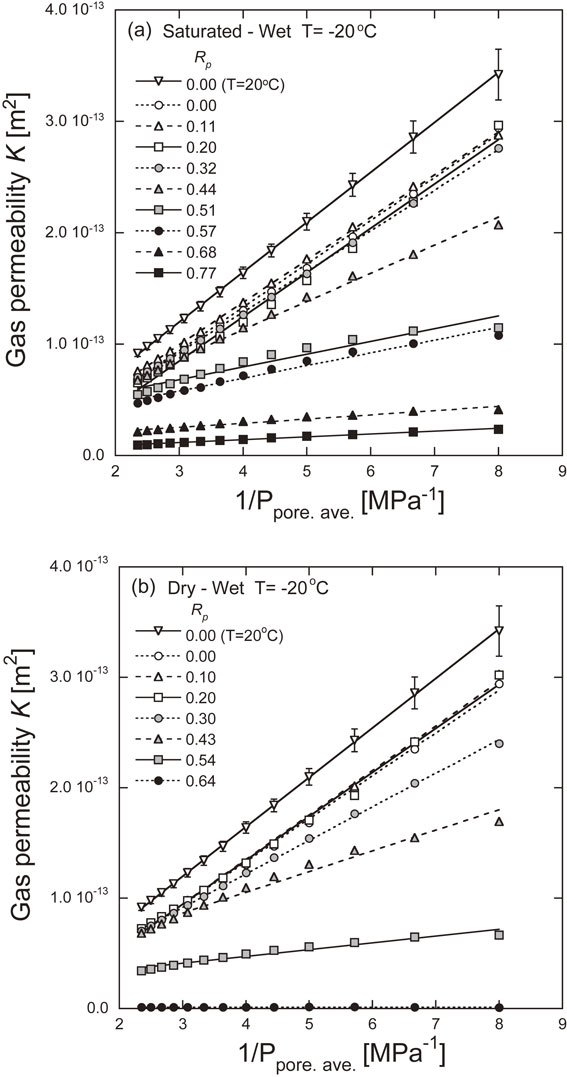
Relationship between experimentally determined permeability and 1/p.

Results of regression of experimental data using eq. (11).
Substituting eq. (2) into eq. (10) yields eq. (11).
| \begin{equation} k_{l} = \frac{c_{0}}{S_{v}^{2}}\frac{\phi_{i}^{3}(1 - R_{p})^{3}}{(1 - \phi_{i}(1 - R_{p}))^{2}} \end{equation} | (11) |
Since the specific surface area changes as the ice occupies the voids, the relationship between the specific surface area and the pore occupation ratio is assumed to be as in eq. (12).
| \begin{equation} S_{v} = S_{\textit{v BS}} + S_{\textit{v ice}}\phi R_{p} \end{equation} | (12) |
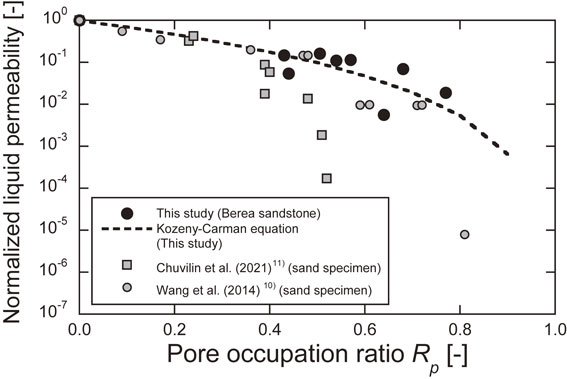
The results of the regression of the experimental data using eq. (11) are shown in Fig. 10. From a comparison with the experimental data, the regression curve is generally considered to represent the estimated liquid permeability. The permeability estimated from the regression curve is 2.04 × 10⁻¹³ m2 at a pore occupation ratio of 0. The permeability estimated from the water permeability experiment is 7.58 × 10⁻¹⁴ ± 4.46 × 10⁻¹⁴ m2. Considering that the permeability decreases due to shrinkage of the pore size with a decrease in temperature, the permeability estimated from the regression curve tends to overestimate the permeability obtained from the water permeability experiments. One of the reasons for the overestimation may be the inability to estimate the liquid permeability in the range of pore occupation ratios less than 0.4.
Next, the normalized liquid permeability is shown in Fig. 11. Here, the initial permeability is defined as the permeability at −20°C and 0% water saturation, and the permeability at a pore occupation ratio of 0 (2.04 × 10⁻¹³ m2) estimated from the regression curve described above. For comparison, the experimental results of Wang et al.10) and Chuvilin et al.11) are also presented. Although caution should be exercised since these experiments were conducted on sand specimens and the experimental conditions were different, the relationship between the normalized permeability and the pore occupation ratio shows a similar trend to the results of previous studies in the range of small pore occupation ratio. However, as the pore occupancy ratio increased, the normalized permeability of the sand specimens became smaller than that of the Berea sandstone. This may be due to differences in the structure of the sand and rock.
Normalized liquid permeability.
As shown in the aforementioned experimental results, the P-wave velocity of sandstone at low temperatures tends to increase with an increase in the pore occupation ratio. Here, the P-wave velocity is estimated using the estimation equation proposed by Dvorkin and Nur,17) and compared with the experimental results. Then, the change in elasticity is examined. The P-wave velocity is estimated by the cementation theory, which assumes that the mineral particles are in mechanical contact with each other due to cementation.
| \begin{equation} V_{p} = \sqrt{\frac{K_{\textit{eff}} + 4G_{\textit{eff}}/3}{(1 - \phi)\rho_{g}}} \end{equation} | (13) |
| \begin{equation} K_{\textit{eff}} = \frac{1}{6}n(1 - \phi_{0})\rho_{c}V_{pc}^{2}S_{n} \end{equation} | (14) |
| \begin{equation} G_{\textit{eff}} = \frac{3}{5}K_{\textit{eff}} + \frac{3}{20}n(1 - \phi_{0})\rho_{c}V_{sc}^{2}S_{\tau} \end{equation} | (15) |
| \begin{equation} S_{n} = A_{n}(\Lambda_{n})\alpha^{2} + B_{n}(\Lambda_{n})\alpha + C_{n}(\Lambda_{n}) \end{equation} | (16) |
| \begin{equation} A_{n}(\Lambda_{n}) = -0.024153 \cdot \Lambda_{n}^{-1.3646} \end{equation} | (17) |
| \begin{equation} B_{n}(\Lambda_{n}) = 0.20405 \cdot \Lambda_{n}^{-0.89008} \end{equation} | (18) |
| \begin{equation} C_{n}(\Lambda_{n}) = 0.00024649 \cdot \Lambda_{n}^{-1.9846} \end{equation} | (19) |
| \begin{equation} \Lambda_{n} = \frac{2G_{c}}{\pi G}\frac{(1 - \nu)(1 - \nu_{c})}{1 - 2\nu} \end{equation} | (20) |
| \begin{equation} S_{\tau} = \text{A}_{\tau}(\Lambda_{\tau},\nu)\alpha^{2} + \text{B}_{\tau}(\Lambda_{\tau},\nu)\alpha + C_{\tau}(\Lambda_{\tau},\nu) \end{equation} | (21) |
| \begin{align} \text{A}_{\tau}(\Lambda_{\tau},\nu) &= -10^{-2} \cdot (2.26\nu^{2} + 2.07\nu + 2.3) \\ &\quad\cdot \Lambda_{\tau}^{0.079\nu^{2} + 0.1754\nu - 1.342} \end{align} | (22) |
| \begin{align} \text{B}_{\tau}(\Lambda_{\tau},\nu) &= (0.0573\nu^{2} + 0.0937\nu + 0.202)\\ &\quad \cdot \Lambda_{\tau}^{0.0274\nu^{2} + 0.0529 - 0.8765} \end{align} | (23) |
| \begin{align} C_{\tau}(\Lambda_{\tau},\nu) &= -10^{-4} \cdot (9.654\nu^{2} + 4.945\nu + 3.1) \\ &\quad\cdot \Lambda_{\tau}^{0.01867\nu^{2} + 0.4011\nu - 1.8186} \end{align} | (24) |
| \begin{equation} \Lambda_{\tau} = \frac{G_{c}}{\pi G} \end{equation} | (25) |
| \begin{equation} G_{c} = \rho_{c}V_{sc}^{2} \end{equation} | (26) |
The ratio, α, is related to the change in porosity due to the freezing of the pore water, as follows:
| \begin{equation} \text{Scheme 1}\qquad\qquad \alpha = 2\left[\frac{\phi_{0} - \phi}{3n(1 - \phi_{0})}\right]^{0.25} \end{equation} | (27) |
| \begin{equation} \text{Scheme 2}\qquad\qquad \alpha = \left[\frac{2(\phi_{0} - \phi)}{3(1 - \phi_{0})}\right]^{0.5} \end{equation} | (28) |
| \begin{equation} M = \rho_{r}V_{p,\textit{exp.}}^{2} \end{equation} | (29) |
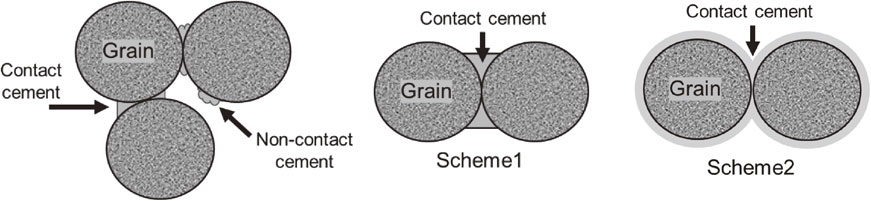
Schematics of Scheme 1 and Scheme 2.
Figure 13 shows the relationship between the compressional-wave modulus and the porosity. The regression line for both is also shown. The porosity at which the compressional-wave modulus is zero is the critical porosity, and its value is 0.33. Figure 14 shows the relationship between the P-wave velocity and the porosity estimated by Scheme 1 and Scheme 2, together with experimental results. In the range of porosity between 0.1 and 0.2, the experimental values fall within the range between Scheme 1 and Scheme 2, but in the range of porosity below 0.1, the experimental values exceed the Scheme 1 estimates. It is possible that this estimation method may not be applicable in the range of small porosity.
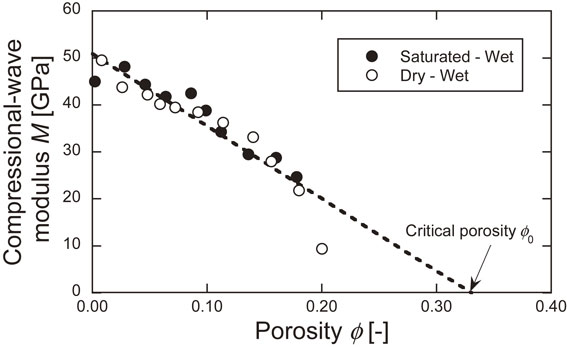
Relationship between compressional-wave modulus and porosity.
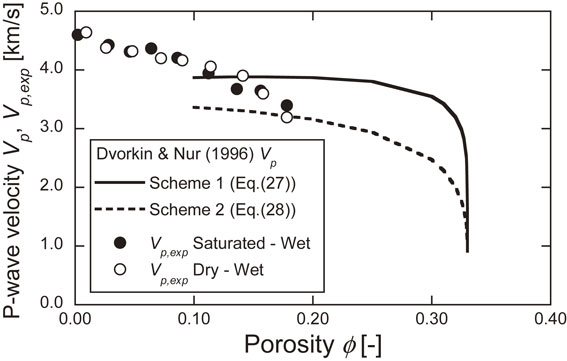
Relationship between P-wave velocity and porosity estimated by Scheme 1 and Scheme 2, together with experimental results.
In this study, gas seepage experiments were conducted on Berea sandstone under low temperature and wet conditions. The elastic wave velocities were also measured during the gas permeability experiments. In these experiments, the permeability tended to decrease as the gas differential pressure increased. This may have been due to the Klinkenberg effect. The permeability measured at −20°C was smaller than the initial permeability measured at 20°C. This may have been brought about by the shrinkage of the pore size with the decreasing temperature, making it more difficult for the gas to permeate. The permeability and normalized permeability decreased with the increasing ice saturation, suggesting that the ice in the pores blocked the continuous pores where the gas could permeate. The P-wave velocity at low temperatures tended to increase with the increase in the pore occupancy ratio, and the normalized P-wave velocity was about 2.0 when the pore occupancy ratio was greater than 0.7. Next, the liquid permeability was estimated from the results of the gas permeability experiments by considering the Klinkenberg effect, and the relationship between the permeability and the pore occupancy ratio was examined using the Kozeny-Carman equation. As a result, the permeability at a pore occupation ratio of 0, estimated from the regression curve, was larger than the permeability obtained from the water permeability experiments. The P-wave velocity was estimated using the estimating equation proposed by Dvorkin and Nur, and then compared with the experimental results. In the range of porosity between 0.1 and 0.2, the experimental values were within the range of the estimated values. In the range of porosity below 0.1, however, the experimental values exceeded the estimated values.
This research was gratefully supported by JSPS Grant-in-Aid for Scientific Research 19K05350. The authors also thank Mr. Masaya Kato (former graduate student at Ehime University) for his cooperation in conducting the experiments.