Abstract
Coating layers having different ratios of a Γ phase to an Fe–Zn solid solution phase were produced on galvannealed steel sheets by heat treatment. The corrosion prevention characteristics of these layers were then investigated using combined cyclic corrosion test, electrochemical measurements and analyses of corrosion products. A coating layer with a larger proportion of the Γ phase showed better corrosion prevention properties along with a smaller corrosion mass loss. The Γ phase exhibited a sacrificial corrosion protection effect with regard to both the Fe–Zn solid solution and the steel substrate while the Fe–Zn solid solution showed a sacrificial corrosion protection effect on the steel substrate. The corrosion products formed from the Γ phase comprised Zn5(OH)8Cl2·H2O, Zn5(CO3)2(OH)6, ZnO and various amorphous compounds, while the Fe–Zn solid solution generated Zn-containing ferrihydrite and amorphous compounds. The presence of Zn evidently stabilized the ferrihydrite and delayed the formation of crystalline iron oxyhydroxide based on comparisons with corrosion products formed on cold-rolled steel sheets. These effects improved the corrosion prevention performance of the Fe–Zn solid solution. The zinc-based corrosion products formed from the Γ phase provided even better corrosion prevention performance by delaying the formation of crystalline iron oxyhydroxide and were also themselves resistant to reduction.
1. Introduction
Reducing greenhouse gas emissions is a vital aspect of addressing climate change. From the viewpoint of improving fuel economy, steel sheets used to form automobile parts are required to have either high or ultrahigh strength so as to reduce the overall vehicle weight while improving collision safety, and hot stamping can be used to obtain such high strength automotive parts.1–3) In this process, a blank is heated above the temperature required to austenitize the metal in a furnace, after which the part is simultaneously formed and quenched by a water-cooled tool to obtain a high strength piece while avoiding spring-back. Zinc coatings are often applied to steel sheets subjected to hot stamping to suppress the formation of oxidized scale that is otherwise generated during the heating process and to improve corrosion resistance. During hot stamping, this coating melts while iron diffuses from the substrate into the coating layer. As a result, a coating layer applied to a galvannealed (GA) steel sheet will transition from a Zn–Fe intermetallic compound consisting primarily of a δ1 phase to a Γ phase having a higher Fe concentration, and then to a Fe–Zn solid solution (hereinafter referred to as an α-Fe(Zn) phase). This transition promotes melting of the coating layer and the diffusion of Fe from the substrate into the coating layer.4)
Interestingly, the corrosion resistance of the α-Fe(Zn) phase after cation electrodeposition coating is superior to that of cold-rolled (CR) steel.5) The authors have also investigated the corrosion prevention performance of Zn–Fe intermetallic compounds (both the δ1 phase and Γ phases) and the α-Fe(Zn) phase using GA specimens after cation electrodeposition coating. These coating layers have been found to have a sacrificial corrosion protection effect on the substrate. During this prior work, the corrosion depth for the α-Fe(Zn) phase was determined to be greater than that for the δ1 and Γ phases when the area of the substrate exposed to the environment was increased.6) However, the corrosion behavior of a mixed coating layer comprising Γ and α-Fe(Zn) phases generated by heating GA steel has rarely been investigated in detail. Hence, this work focused on the corrosion behavior and corrosion prevention properties of coating layers having different ratios of Γ to α-Fe(Zn) phases. GA specimens with varying proportions of the Γ and α-Fe(Zn) phases in the coating layer were prepared and subjected to combined cyclic corrosion test (CCT) and electrochemical measurements. The corrosion products resulting from the CCT were also analyzed.
2. Experimental
2.1 Material and specimens
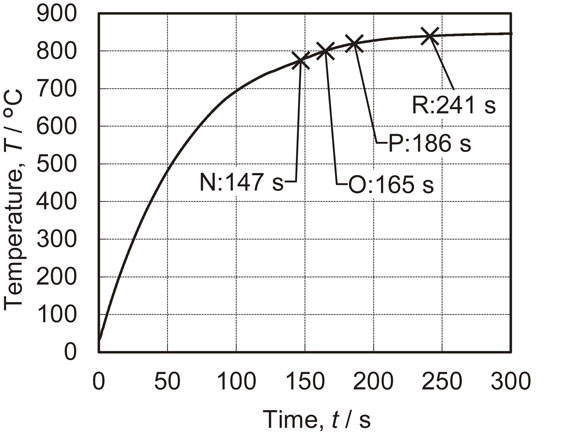
The material used in this work comprised GA steel sheets with a thickness of 1.6 mm. The average coating coverage on these steel sheets was 62 g/m2 and these coating layers contained approximately 10 mass% Fe. This material was cut to produce specimens each having a length of 100 mm and width of 50 mm. Coating layers with different Γ to α-Fe(Zn) phase ratios were generated by heat treating the cut samples for 147, 165, 186 or 241 s in a furnace preheated to 850°C under air. These samples were subsequently quenched using a water-cooled flat die attached to a crank press. The specimens are referred to herein as the N, O, P and R materials, respectively. A K-type thermocouple was bonded to the center of each specimen and a representative temperature profile based on heating at 850°C is shown in Fig. 1. An additional sample (specimen M) was also prepared by immersing a GA plate in a salt bath at 550°C for 8 min to produce a Zn–Fe intermetallic compound with a Γ phase as the main component in the coating.
The ratio of the amount of Γ phase to the amount of α-Fe(Zn) phase in each coating layer was determined by X-ray diffraction (XRD; Rigaku, RINT-RAPID II) analyses of the heat treated specimens using a Co target. Both phases were identified as components of the coating layer in specimens N, O and P while only the α-Fe(Zn) phase was found in specimen R. The phase ratios in the coating layers were determined from the total areas of the XRD peaks related to the (330), (442) and (721) crystal planes of the Γ phase and the (110), (200) and (211) planes of the α-Fe(Zn) phase. Figure 2 summarizes the ratios found in the coating layers of the various specimens. In the case of specimens N, O, P and R, the proportion of the α-Fe(Zn) phase increased as the heating time increased, such that specimen R was found to have only the α-Fe(Zn) phase. In addition to the Γ phase, diffraction peaks originating from the δ1 and Γ1 phases were also observed in specimen M, suggesting that small amounts of these components were also contained in this sample. For comparison purposes, a non-coated CR steel sheet was also subjected to the CCT described below in Section 2.2.

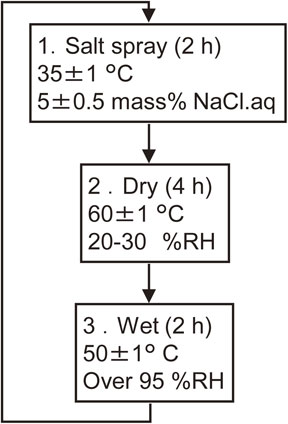
Prior to the CCT, the surface oxides formed on the specimen during the heat treatment step were removed using a 100 g/L NH4Cl aqueous solution heated to approximately 70°C for specimens M, N, O and P (for which the coating layer contained the Γ phase) or a 100 g/L CH3COONH4 aqueous solution heated to 70°C for specimen R (having a coating layer consisting mainly of α-Fe(Zn)).7) The mass of each specimen was recorded, following which the edges and reverse side surface of the sample were sealed with insulating tape. A maximum of 90 CCT cycles were performed in accordance with the Society of Automotive Engineers of Japan standard JASO M 609.8) Each cycle comprised a 2 h exposure to a salt spray, a 4 h drying interval and a 2 h exposure to a humid environment. Figure 3 provides the details of the CCT procedures.
After 9, 30, 60 and 90 cycles, the corrosion products formed on each specimen were removed by wet blasting and the specimen was again weighed to determine the corrosion mass loss per square meter.
2.3 Electrochemical measurements
The electrochemical properties of specimens M, N, O and R, each of which had different ratios of the Γ phase to the α-Fe(Zn) phase in the coating layer, were evaluated by corrosion potential measurements as well as anodic and cathodic polarization assessments using a Hokuto Denko HZ-7000 instrument. Specimens that had been subjected to 5 CCT cycles were also examined to determine their electrochemical characteristics using the same techniques but with the corrosion products still in place.
In each case, the measurement area was 10 mm × 10 mm with the remaining surface being insulated with a rubber-based masking reagent. The specimen was used as the working electrode together with a saturated calomel electrode (SCE) as the reference electrode and a platinum counter electrode. The electrolyte was a 5.0 mass% NaCl aqueous solution held at 35°C. After measuring the corrosion potential for 5 min, anodic and cathodic polarizations were performed while applying sweep rates of 20 and −20 mV/min from the corrosion potential, respectively.
2.4 Investigation of corrosion products
The corrosion products formed after 5, 9, 30 and 60 CCT cycles were assessed by manually scraping material from the surface of each specimen, moving as far as possible toward the substrate interface. The collected corrosion products were subsequently crushed and homogenized and their composition was identified using XRD. The components were semi-quantified by applying the Rietveld method and the percentage of each was calculated. In these calculations, amorphous rust was assumed to have a density of 3.8 g/cm3.9)
Portions of specimens subjected to 5 and 30 CCT cycles were excised with the corrosion products still attached. These samples were then embedded in polyester resin and polished to a mirror finish. The distributions of the various corrosion products in these specimens were investigated using laser Raman spectroscopy (Nanophoton, RAMAN touch), based on procedures reported in several prior publications.10–12) Carbon was subsequently deposited on the sample surfaces and field-emission electron probe micro analysis (FE-EPMA; JEOL, JXA-8500F) was performed to acquire backscattering electron (BSE) images of the same areas that had been subjected to the Raman analysis. In addition, the distributions of Fe, Zn and O were determined using wavelength dispersive X-ray spectroscopy (WDS).
3. Results and Discussion
3.1 Evaluation of corrosion prevention performance by corrosion mass loss
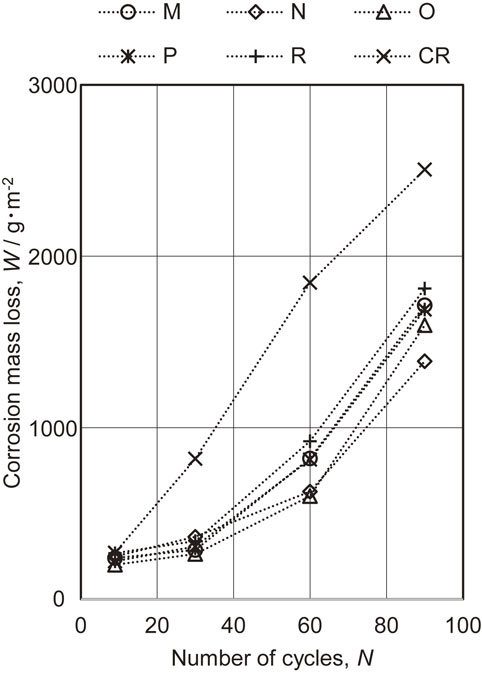
Figure 4 summarizes the corrosion mass losses of the specimens after 9, 30, 60 and 90 CCT cycles. Specimen M (which had a layer made of a Zn–Fe intermetallic compound comprising primarily the Γ phase), specimens N, O and P (which had mixed coatings containing Γ and α-Fe(Zn) phases) and specimen R (which had only an α-Fe(Zn) phase) all showed lower losses than those for the CR. Specimens N and O exhibited the lowest losses followed by P, M and R in that order. These results established that coating layers comprising mixtures of the Γ and α-Fe(Zn) phases but also having a high proportion of the Γ phase provided superior corrosion protection performance.
3.2 Electrochemical behavior of specimens before and after CCT
The corrosion potentials of specimens M, N, O and R before and after 5 CCT cycles are presented in Fig. 5, while anodic and cathodic polarization curves are provided in Figs. 6 and 7. The corrosion potentials determined for specimens M, N, O and R prior to the CCT were −0.878, −0.946, −0.929 and −0.736 V (vs. SCE), respectively. Each of these values is lower than the corrosion potential for the bare steel substrate in the same solution (approximately −0.55 V6)). The corrosion potential for specimen M corresponded to the Γ phase while that for specimen R could be attributed to the α-Fe(Zn) phase.6,13) In contrast, specimens N and O (both of which had a layer containing the Γ and α-Fe(Zn) phases) showed lower potentials6,13) than those associated with δ1 and Γ phases. This result can be explained by the formation of surface Zn–Fe phases (such as the η and ζ phases) with higher Zn proportions than found in Γ phases due to the rapid cooling of the liquid Zn generated during heating. However, because the η and ζ phases were not identified in the XRD results (Fig. 2), it is likely that only small amounts were present on the sample surfaces. According to the anodic polarization data acquired prior to the CCT (Fig. 6), the current density for specimen M increased relative to the corrosion potential as a consequence of dissolution of the Γ phase, with an eventual plateau at −0.63 V. Because the potential range over which the current density became constant was the Fe-insensitive zone, the dissolution of the substrate steel would not have progressed such that the current density did not increase. This anodic polarization behavior indicates that the Γ phase dissolved preferentially rather than the steel and provided a sacrificial corrosion protection effect that inhibited dissolution of the partially exposed substrate. Furthermore, when polarized toward the anodic direction, an increase in current density stemming from dissolution of the steel was observed beginning at approximately −0.45 V. The anodic polarization curve for specimen R shows the dissolution of the α-Fe(Zn) phase near the corrosion potential, followed by an increase in current density due to dissolution of the substrate steel. Specimens N and O, which had layers comprising mixtures of the Γ and α-Fe(Zn) phases, produced the anodic polarization curves containing two peaks. Based on a comparison with the results for specimens M and R, these two peaks correspond to increases in the dissolution current densities for the Γ and α-Fe(Zn) phases from the lower potential side. That is, within the mixed layer containing Γ and α-Fe(Zn) phases, the Γ phase dissolved preferentially. Therefore, the data confirm that the Γ phase had a sacrificial corrosion protection effect on the α-Fe(Zn) phase and the substrate steel while the α-Fe(Zn) phase had a sacrificial corrosion protection effect on the substrate steel.
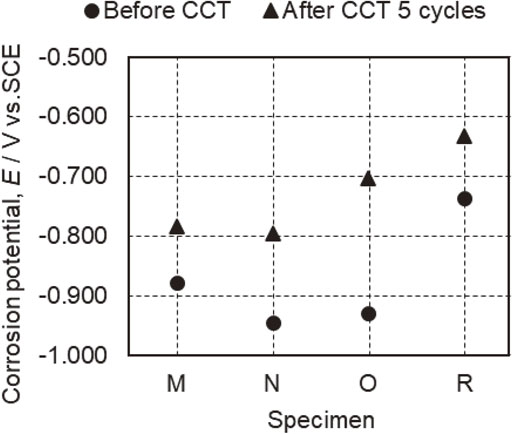
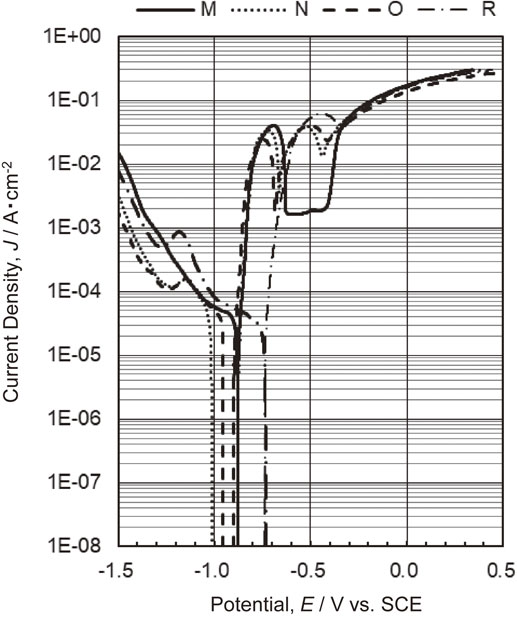

As shown in Fig. 5, the corrosion potentials for specimens M, N, O and R after 5 cycles of CCT were −0.784, −0.795, −0.703 and −0.633 V, respectively. Each of these values is slightly higher than that for the specimen before CCT but still lower than the value for the substrate steel. In Fig. 7, the anodic polarization curves obtained for specimens M, N and O after 5 cycles demonstrate increases in current density corresponding to dissolution of the Γ and α-Fe(Zn) phases from the lower potential side. In the case of specimen R following 5 cycles, an increase in current density associated with dissolution of the α-Fe(Zn) phase was observed. These results suggest that the coating layers still remained after 5 cycles. The corrosion potential for specimen O was located between the values obtained for the Γ and α-Fe(Zn) phases, and so it appears that the Γ phase partially disappeared such that the α-Fe(Zn) phase was exposed.
The cathodic polarization curves in Fig. 7 demonstrate that the current density for specimen R increased significantly over the range from the corrosion potential to −1.2 V. This increase was much greater compared with that in the cathodic polarization curve acquired before CCT. This behavior suggests that the reduction of corrosion products was involved in addition to the oxygen reduction reaction. These results also demonstrate that the cathodic polarization behavior changed depending on the corrosion products generated from the Γ and the α-Fe(Zn) phases. A detailed analysis of the corrosion products formed as a result of the CCT was performed and the results are described and discussed in Section 3.4.
3.3 Formation of corrosion products during CCT
Figure 8 summarizes the compositions of the corrosion products for each specimen after specific numbers of CCT cycles. Herein, Zn5(OH)8Cl2·H2O, Zn5(CO3)2(OH)6 and ZnO are collectively referred to as zinc corrosion products. In addition, Fe3O4, ZnFe2O3 and similar compounds with different proportions of Zn, and Fe are referred to as ZnxFe3−xO4, while α-FeOOH, β-FeOOH and γ-FeOOH are collectively referred to as crystalline iron oxyhydroxides. Finally, amorphous rust products (including green rust) are referred to as amorphous compounds. Note however that ferrihydrite, which is a metastable iron oxyhydroxide, is shown separately from these amorphous compounds.
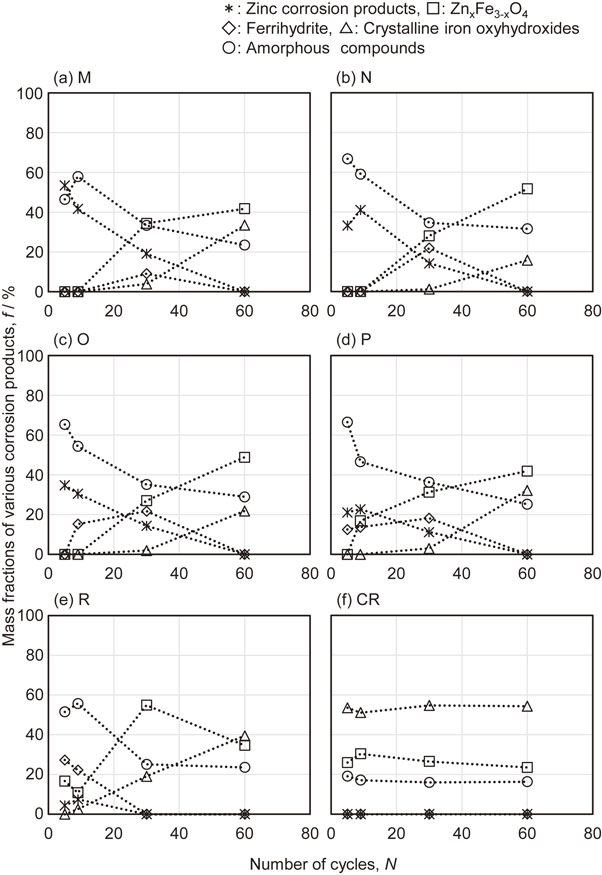
As shown in Figs. 8(a), 8(b) and 8(c), the corrosion products for specimen M (having only a Zn–Fe intermetallic compound composed mainly of a Γ phase in the coating layer) and for specimens N and O (with a mixed coating layer combining the Γ and α-Fe(Zn) phases having a high proportion of the Γ phase) were primarily zinc corrosion products and amorphous compounds after 5 and 9 cycles of CCT. As the CCT cycles progressed, the proportion of these products decreased and the percentage of ZnxFe3−xO4 increased. The percentage of crystalline iron oxyhydroxide also gradually increased during the course of 30 cycles. The corrosion products for specimen P (Fig. 8(d)) comprised ZnxFe3−xO4 and ferrihydrite after 9 cycles, while specimen R (Fig. 8(e)), which had primarily a α-Fe(Zn) phase, formed these materials after 5 cycles. As more cycles were applied, the ferrihydrite amount decreased and the concentration of crystalline iron oxyhydroxide increased. The CR specimen (Fig. 8(f)) generated crystalline iron oxyhydroxide as the main corrosion product followed by ZnxFe3−xO4 (likely in the form of Fe3O4 because this specimen did not contain Zn) and amorphous compounds, irrespective of the number of CCT cycles.
According to these results, the formation of crystalline iron oxyhydroxide was delayed to a greater extent when the mixed coating layer contained the Γ and α-Fe(Zn) phases, with the former being present in a greater proportion. In addition, the α-Fe(Zn) phase tended to form ferrihydrite with low crystallinity in the early stage of corrosion and suppressed the formation of iron oxyhydroxide to a greater extent compared with the CR specimen.
3.4 Formation and corrosion prevention effect of corrosion products
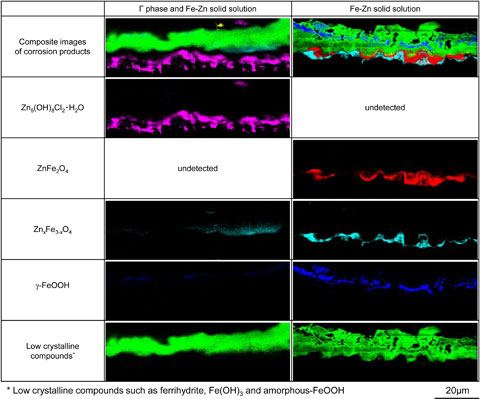
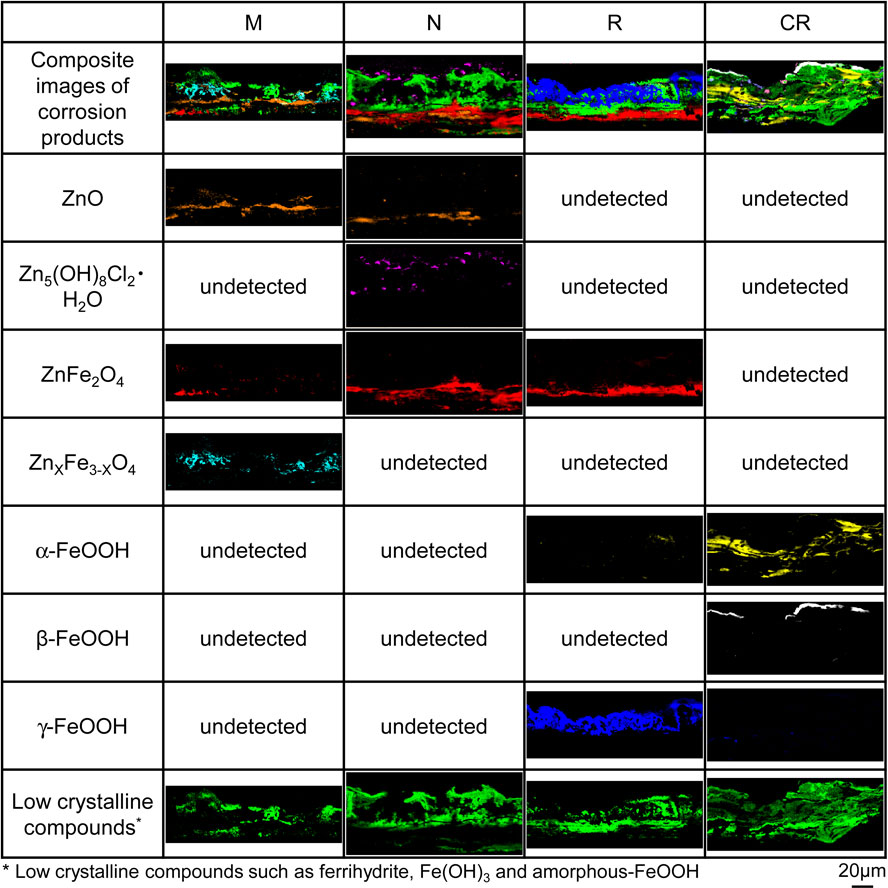
Figure 9 shows the distribution of elemental concentrations in cross-sections of the corrosion products formed on specimens N and R after 5 CCT cycles, while Fig. 10 shows the distributions of components of corrosion products in the same region. Because it was difficult to identify ferrihydrite and amorphous-FeOOH by Raman analysis when these compounds were combined, these corrosion products are collectively referred to as low crystalline compounds. The elemental distributions along the cross-sections allow the corrosion products to be distinguished from the coating layers and the substrate steel based on the concentration of O atoms. In addition, the Γ and α-Fe(Zn) phases can be differentiated based on variations in the concentrations of Fe and Zn, as seen in the BSE images in Fig. 9. In the case of specimen N, the Γ phase on the surface of the coating layer was preferentially corroded while the α-Fe(Zn) phase remained intact. The corrosion products generated by the Γ phase included Zn5(OH)8Cl2·H2O at the interface with the coating layer and low crystalline compounds distributed in layers on the outer side. Zn5(OH)8Cl2·H2O is a corrosion product of the Zn coating layer having good protective properties and is reported to be reduced at potentials lower than −1.3 V.14) These results agree with the trend exhibited by the cathodic polarization curve for specimen N after 5 cycles (Fig. 7). In contrast, the corrosion products for the α-Fe(Zn) phase were ferrihydrite, low crystalline compounds and γ-FeOOH (which were evidently formed on the surface side) along with ZnFe2O4 and ZnxFe3−xO4 (generated at the interface with the coating layer) based on the XRD data (Fig. 8(e)). ZnFe2O4 is a corrosion product with both divalent and trivalent spinel structures. The valence of the metals in the oxides along with the distribution of ZnFe2O4 in the corrosion products (Fig. 10) show that this compound resulted from the reduction of ferrihydrite at the interface of the coating layer. These data are consistent with the increased reduction current density exhibited by specimen R in Fig. 7, suggesting that the reduction reactions of γ-FeOOH and of ferrihydrite to ZnxFe3−xO4 were involved.

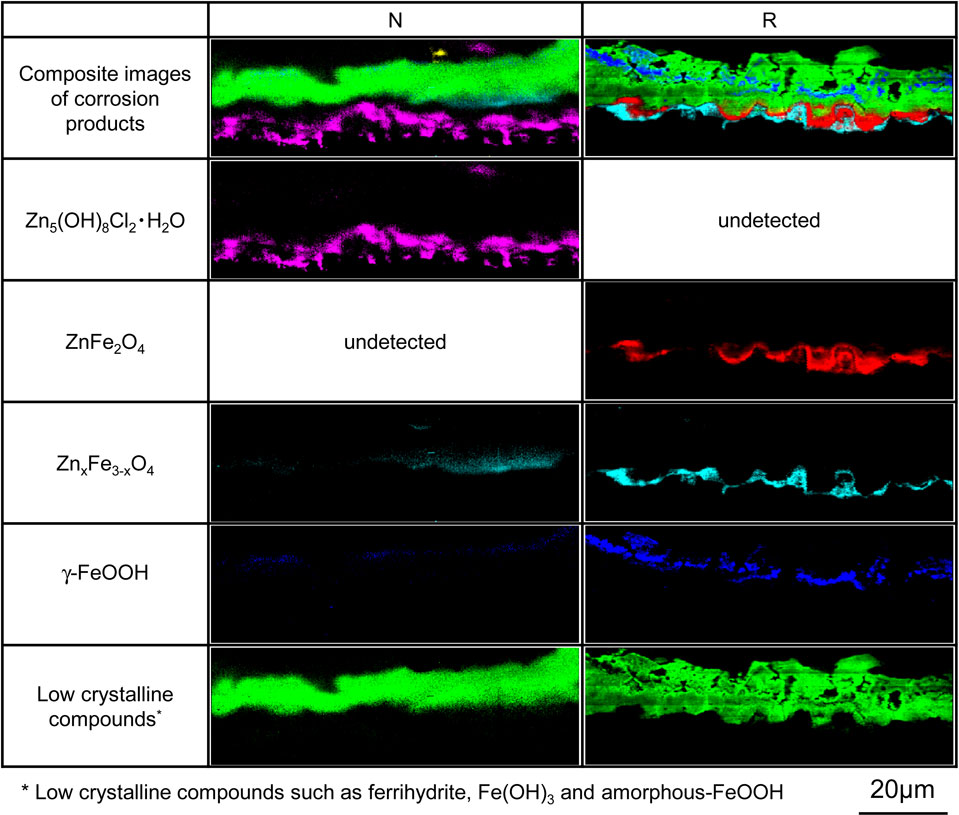
Figure 11 provides the elemental distribution of the corrosion product cross-sections for specimens M, N and R as well as CR specimen after 30 CCT cycles. Figure 12 shows the distributions of corrosion products in the same region. In the case of specimens M and N, the coating layers almost disappeared due to corrosion and the zinc corrosion products, ZnFe2O4 and ZnxFe3−xO4 were identified together with low crystalline compounds. The substrates of both these specimens were exposed but crystalline iron oxyhydroxide was not found, indicating that the substrate was not corroded. ZnFe2O4 derived from the α-Fe(Zn) phase was also distributed along the interface with the substrate, presumably based on the corrosion of the α-Fe(Zn) phase after the Γ phase disappeared due to corrosion. The coating layer in specimen R was also removed by corrosion and γ-FeOOH together with a very small amount of α-FeOOH were distributed along the outer side. In addition, low crystalline components were found on the inner side, and ZnFe2O4 was distributed at the interface with the substrate. Zn was detected in the same region in which the low crystalline components and ZnFe2O4 were found, suggesting that Zn affected the formation and stability of these corrosion products. The corrosion products of specimen R after 30 cycles had higher proportions of crystalline iron oxyhydroxide and ZnFe2O4. Specimen CR was found to have β-FeOOH distributed over the surface of the corrosion products, low crystalline components and α-FeOOH distributed throughout the sample and crystalline iron oxyhydroxide at the substrate interface.

Although the transformation of ferrihydrite during metallic corrosion has rarely been studied, there have been several reports regarding ferrihydrite based on geological research. Synthesis experiments have shown that ferrihydrite in a neutral aqueous solution will adsorb divalent Fe ions that subsequently exhibit catalytic activity and promote dissolution of the ferrihydrite. Reprecipitation can also occur to produce γ-FeOOH and α-FeOOH.15) Ferrihydrite has a high specific surface area and excellent adsorption capacity, and ferrihydrite with adsorbed Zn (Zn-ferrihydrite) tends not to transform to more crystalline compounds such as crystalline iron oxyhydroxide and Fe2O3.16,17) Furthermore, it has been reported that Zn-ferrihydrite does not form α-FeOOH but rather transforms to γ-FeOOH and Fe3O4 in a neutral aqueous solution.17) Based on these reports, the formation and transformation of corrosion products on the α-Fe(Zn) phase can be explained as follows. Firstly, ferrihydrite is formed as one of the initial corrosion products of the α-Fe(Zn) phase. The presence of Zn stabilizes the Zn-ferrihydrite and suppresses the transformation to crystalline iron oxyhydroxide. In the next phase, the Zn-ferrihydrite gradually dissolves from the surface to form γ-FeOOH by reprecipitation. Simultaneously, ZnFe2O4 and compounds having similar crystal structures but different metal atom proportions are formed via reduction at the substrate interface. It has been proposed by Evans18) that iron oxyhydroxide (represented by γ-FeOOH) promotes corrosion by its own reduction. The corrosion products of the α-Fe(Zn) phase evidently provide better corrosion protection than those generated by the bare steel substrate because the formation of crystalline iron oxyhydroxides is suppressed by the stable Zn-ferrihydrite. Although the reduction reaction at the substrate interface at which ZnFe2O4 is formed would be expected to promote corrosion, it has been reported that ZnFe2O4 has low solubility in water by calculation.19) Although this work did not elucidate the effect of ZnFe2O4 on corrosion and further investigation is needed, the presence of this compound at the substrate interface suggests that it may play a role in corrosion prevention.
GA steel is used to produce industrial parts requiring corrosion resistance, and the corrosion resistance of this metal is largely determined by the thickness of the coating layer. Prior work has shown that galvanized (GI) steel sheets after hot stamping show good corrosion prevention as a result of thickening of the coating layer during heating. This effect is related to the diffusion of Fe from the substrate into the coating layer.20) In the present research, specimens N and O (both with relatively high proportions of the Γ phase) exhibited better corrosion prevention performance than specimen R, which had the thickest coating layer. These findings suggest that the corrosion protection performance of the coating layer on post-heat treated GA steel can be maximized by optimizing the ratio of the Γ phase to the α-Fe(Zn) phase. In addition to the sacrificial corrosion protection effect of the coating layer, the transformation behavior and reduction properties of corrosion products formed from the Γ and α-Fe(Zn) phases were found to affect the corrosion prevention characteristics.
4. Conclusion
Mixed coating layers with different proportions of Γ and α-Fe(Zn) phases were prepared and subjected to CCT, electrochemical measurements and detailed investigations of the corrosion products. The findings of this work are as follows.
-
(1)
Among the coating layers consisting mainly of Γ or α-Fe(Zn) phases or mixtures of the two, the mixed coating layers having a high proportion of the Γ phase showed the best corrosion prevention performance. The date also indicated that the corrosion prevention performance was dependent on the ratio between the Γ and α-Fe(Zn) phases in the coating layer.
-
(2)
The Γ phase exhibited a sacrificial corrosion protection effect with respect to both the α-Fe(Zn) phase and the steel while the α-Fe(Zn) phase showed a sacrificial corrosion protection effect on the steel.
-
(3)
The corrosion products in the Γ phase were found to comprise zinc corrosion products such as Zn5(OH)8Cl2·H2O, Zn5(CO3)2(OH)6 and ZnO together with various amorphous compounds, while the corrosion products in the α-Zn(Fe) phase were ferrihydrite and amorphous compounds. The Zn in the α-Fe(Zn) evidently stabilized the ferrihydrite and delayed the formation of crystalline iron oxyhydroxide, resulting in good corrosion prevention. The zinc corrosion products also provided superior corrosion protection due to their resistance to reduction.
-
(4)
The presence of the Γ phase in a coating layer on GA steel following hot stamping improves the corrosion protection characteristics of the material.
REFERENCES
- 1) T. Senuma, K. Kusumi and M. Suehiro: Bull. Iron Steel Inst. Jpn. 11 (2006) 86–93.
- 2) N. Fujita, K. Kusumi, K. Matsumura, T. Nonaka and T. Tomokiyo: Shinnittetsu Giho 393 (2006) 99–103.
- 3) S. Hamamoto, H. Omori, T. Asai, N. Mizuta, N. Jimbo and T. Yamano: Kobe Steel Eng. Rep. 66 (2017) 12–16.
- 4) A. Sengoku, H. Takebayashi, N. Okamoto and H. Inui: Tetsu-to-Hagané 104 (2018) 331–337. doi:10.2355/tetsutohagane.TETSU-2017-100
- 5) K. Akioka, K. Imai, S. Sudo, M. Ichikawa and A. Obayashi: Materia Japan 51 (2012) 70–72. doi:10.2320/materia.51.70
- 6) Y. Konari, K. Kono, K. Ikeda and L.B. Niu: Zairyo-to-Kankyo 70 (2021) 170–176. doi:10.3323/jcorr.70.170
- 7) JIS Z 2371:2015, Methods of salt spray testing.
- 8) JASO M 609-91, Corrosion test method for automotive materials.
- 9) T. Ishikawa and T. Nakayama: Zairyo-to-Kankyo 52 (2003) 140–154. doi:10.3323/jcorr1991.52.140
- 10) L. Bellot-Gurlet, D. Neff, S. Reguer, J. Monnier, M. Saheb and P. Dillmann: J. Nano Res. 8 (2009) 147–156. doi:10.4028/www.scientific.net/JNanoR.8.147
- 11) N. Yoshioka and A. Yoshida: Zairyo-to-Kankyo 64 (2015) 251–258. doi:10.3323/jcorr.64.251
- 12) S. Sobanska, D. Deneele, J. Barbillat and B. Ledésert: Appl. Geochem. 64 (2016) 107–117. doi:10.1016/j.apgeochem.2015.09.011
- 13) R. Mishra: Metall. Mater. Trans. A 39 (2008) 2275–2277. doi:10.1007/s11661-008-9592-4
- 14) I. Suzuki, M. Enjuzi and H. Asai: Tetsu-to-Hagané 72 (1986) 924–931. doi:10.2355/tetsutohagane1955.72.8_924
- 15) H. Liu, P. Li, M. Zhu, Y. Wei and Y. Sun: J. Solid State Chem. 180 (2007) 2121–2128. doi:10.1016/j.jssc.2007.03.022
- 16) M. Sakakibara, M. Tanaka, Y. Takahashi and T. Murakami: Chem. Geol. 522 (2019) 121–134. doi:10.1016/j.chemgeo.2019.05.018
- 17) J. Yan, A.J. Frierdich and J.G. Catalano: Geochim. Cosmochim. Acta 320 (2022) 143–160. doi:10.1016/j.gca.2022.01.014
- 18) U.R. Evans: Nature 206 (1965) 980–982. doi:10.1038/206980a0
- 19) H. Tamura: Tetsu-to-Hagané 91 (2005) 706–711. doi:10.2355/tetsutohagane1955.91.9_706
- 20) R. Autengruber, G. Luckeneder and A.W. Hassel: Corros. Sci. 63 (2012) 12–19. doi:10.1016/j.corsci.2012.04.048