Abstract
The effects of temperature and phosphorus addition on the surface tension of molten Cu–P alloys were measured by the oscillating droplet method using the electromagnetic levitation technique. We successfully measured the accurate surface tension of molten samples that were sufficiently above the liquidus temperature. The surface tension of liquid copper was determined in its pure state, which is free from any contamination, such as oxygen adsorption and chemical reaction with the supporting material. The surface tension of the molten sample was decreased as phosphorus addition was increased. The surface tension of molten Cu–P alloys was well expressed as functions of temperature and phosphorus activity from the measurement results using the Szyszkowski model. Furthermore, the enthalpy and entropy changes in phosphorus adsorption on liquid copper were also estimated.
This Paper was Originally Published in Japanese in Journal of Japan Institute of Copper 61 (2022) 135–139.
1. Introduction
Surface tension data of liquid metals and alloys are essential for improving and optimizing various high-temperature melt processes involving free surfaces, such as welding, brazing, and casting, to consider the effects of melt surface shape, wetting behavior, and thermocapillary phenomena. Although even trace impurities and additive elements can affect the surface tension of metallic melt,1–7) the details for many metals, including copper, which is a critical metal in industries, have not yet been sufficiently and systematically clarified.
A conventional technique for measuring the surface tension of liquid metals using supporting materials, such as the sessile drop method, can only guarantee the measurement at a relatively low temperature to prevent contamination of the sample due to a chemical reaction with the supporting materials at high temperature. Because the temperature range in the measurement usually becomes narrow in this case, the uncertainty in the measurement of the temperature coefficient in surface tension may increase.
Although oxygen is a strong surfactant for metallic melt,8–20) the surface tension has been often measured without considering the effect of oxygen partial pressure, $P_{\text{O}_{2}}$, of measurement atmosphere.
The oscillating droplet technique using electromagnetic levitation (EML) is one of the most promising methods for measuring the accurate surface tension of high-temperature metallic melt.20) This technique ensures that the sample is not in contact with any measuring device during the surface tension measurement, thereby eliminating any contaminant that may be present in the supporting material even at high temperatures sufficiently above the liquidus temperature. Furthermore, this technique ensures precise control of $P_{\text{O}_{2}}$ during surface tension measurement.
In this study, the surface tension of molten Cu–P alloys was precisely measured by the oscillating droplet method using the EML. Phosphorus, which is commonly used as a deoxidizer for copper and copper alloys, was presented as a surfactant for liquid iron.2) Surfactants for liquid iron usually have a surface-active effect on liquid copper as well.5,7) The purpose of this study was to investigate the effects of temperature and phosphorus content on the surface tension of molten Cu–P alloys.
2. Experimental Procedure
A cube of high purity copper with 99.98 at% (99.99 mass%) and small grains of Cu–26.6 at%P (Cu–15 mass%P) alloys with a diameter range of 1–3 mm were chemically cleaned in a Nital solution using ultrasonic cleaner followed by an acetone cleaning. A cube of the copper and Cu–26.6 at%P grains were weighed so that the phosphorus composition of the Cu–P alloy after melting was uniformly 1–6 at%, and then placed on a quartz holder in the EML chamber.15) The inside of the EML chamber was sufficiently replaced with an Ar–He–10 vol%H2 mixture gas flowing at 2 L/min from above. The $P_{\text{O}_{2}}$ of the gas was measured at 2.2 × 10⁻²⁴ Pa at the inlet of the chamber using a zirconia oxygen sensor operated at 1008 K. The copper cube was electromagnetically levitated with the Cu–26.6 at%P grains and then uniformly melted in an Ar–He–10 vol%H2 gas flow. The temperature of the droplet was controlled by varying the partial pressures of argon and helium gases with different thermal conductivities using a monochromatic pyrometer. The emissivity setting of the pyrometer was chosen so that the post-recalescence temperature of the sample during the cooling stage is equal to the liquidus temperature of Cu–P alloys used. After the droplet temperature became constant, the oscillation behavior of the droplet was monitored from above at 500 fps for 16 seconds using a high-speed video camera.
The frequencies of the surface oscillations of m = 0, ±1, and ±2 for the l = 2 mode and those of the center of gravity (oscillations of the m = 0 and ±1 for the l = 1 mode) were analyzed from time-sequential data of the HSV images using fast Fourier transformation (FFT). The effect of the apparent rotations due to the phase differences between m = +1 and m = −1, and m = +2 and m = −2, were considered in the analysis as well as that of real rotation.21–23) The surface tension of liquid Cu–P alloys was calculated from these frequencies using the Rayleigh equation24) and the Cummings and Blackburn calibration.25) A list of nomenclatures used throughout this study is provided in Table 1.

Table 1 Nomenclature lists.
3. Results
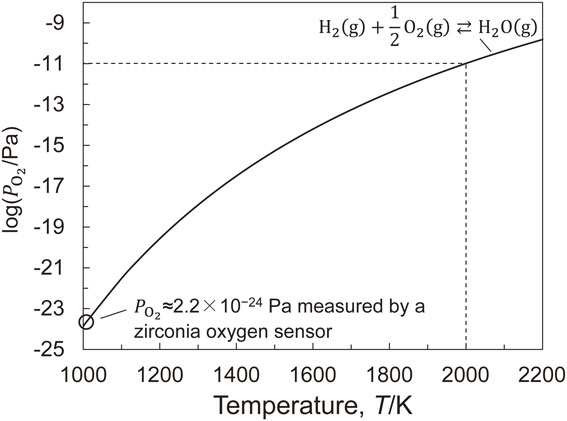
To eliminate the effect of oxygen adsorption from atmospheric gas on the surface tension measurement result, the $P_{\text{O}_{2}}$ of the atmospheric gas was reduced as much as possible by the following gas-phase equilibrium between H2(g) and H2O(g) using Ar–He–10 vol%H2.
| \begin{equation}
\text{H$_{2}$(g)} + \frac{1}{2}\text{O$_{2}$(g)} \rightleftarrows \text{H$_{2}$O(g)}
\end{equation}
| (1) |
| \begin{equation}
\Delta G_{\text{H${_{2}}$O}}^{\circ} = -246.535 + 54.94T\ [\text{J${\cdot}$mol$^{-1}$}]^{\text{26)}}
\end{equation}
| (2) |
where
T is the temperature. Because the
$P_{\text{O}_{2}}$ of the Ar–He–10 vol%H
2 gas used in this study was measured at 2.2 × 10
−24 Pa by a zirconia oxygen sensor operating at 1008 K, corresponding the equilibrium partial pressure of H
2O(g),
$P_{\text{H}_{2}\text{O}}$, can be calculated at ∼0.37 Pa using
eq. (2).
26) When assuming that the ratio of partial pressures of H
2O(g) and H
2(g),
$P_{\text{H}_{2}\text{O}}$/
$P_{\text{H}_{2}}$, of the Ar–He–10 vol%H
2 gas is a constant regardless of temperature since the
$P_{\text{H}_{2}\text{O}} \approx 0.37$ Pa is much lower than that of
$P_{\text{H}_{2}} \approx 10^{4}$ Pa, the
$P_{\text{O}_{2}}$ of the gas decreases with decreasing temperature as shown in
Fig. 1. It is reported that
$P_{\text{O}_{2}}$ becomes less effective on surface tension of liquid copper when
$P_{\text{O}_{2}}$ is lower than 10
−10 Pa.
8–12) Hence, the surface tension of the molten Cu–P alloy was to be measured under the Ar–He–10 vol%H
2 gas below 2000 K, where the
$P_{\text{O}_{2}}$ of the gas is even an order of magnitude lower.
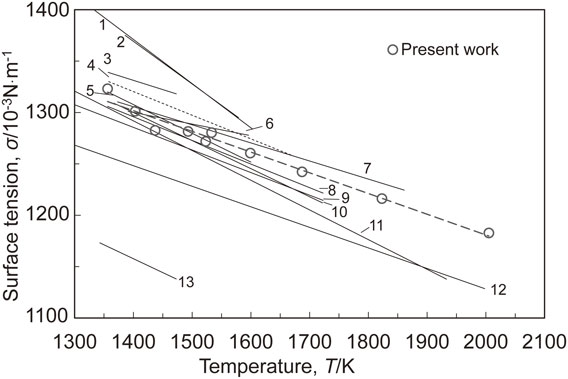
Figure 2 shows the surface tension of liquid copper measured under a flowing of Ar–He–10 vol%H2 gas using EML (○), along with some literature data.8,27–38) The surface tension of high purity liquid copper was successfully measured over a wide temperature range from 1360 to 2000 K. From a good linearity of the surface tension with respect to the temperature as shown by a dashed line, the temperature dependence of surface tension of liquid copper free of contaminations from the supporting material and atmospheric gas, σP, can be described by a least-square approach for the plots as follows,
| \begin{equation}
\sigma^{\text{P}} = 1310 - 0.202 \cdot (T - 1358)\ [10^{-3}\,\text{N${\cdot}$m$^{-1}$}]
\end{equation}
| (3) |
where the intercept (1310 × 10
−3 N·m
−1) corresponding to the surface tension of copper at the melting temperature (1358 K). This result agrees well with the suggested value of the surface tension of liquid copper by Keene,
29) which was deduced from several literature data in consideration of the effect of sample contamination on surface tension.
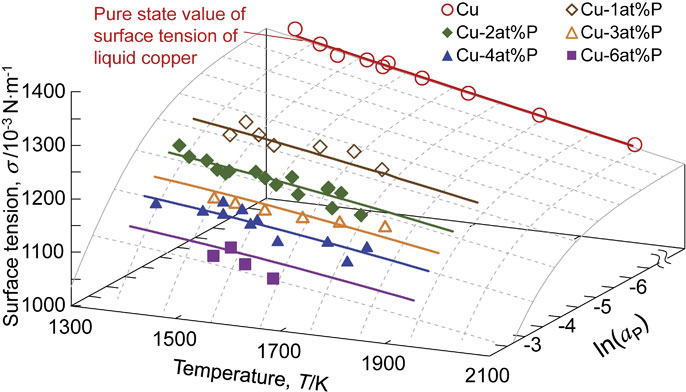
Figure 3 shows the surface tension of molten Cu–P alloys measured using the EML under a flowing of Ar–He–10 vol%H2 gas. Even a small amount of phosphorus addition of 1 at% causes a decrease in the surface tension of molten sample, indicating that phosphorus acts as a surfactant for liquid copper as it does for liquid iron. The surface tension of molten Cu–P alloys decreases with increasing phosphorus content.
To investigate the full-coverage phosphorus adsorption on molten copper, $\varGamma_{\text{P}}^{\text{sat}}$, as one of the parameters to characterize the surface-active effect, using the following Gibbs adsorption isotherm, surface tension of molten Cu–P alloys was evaluated as a function of phosphorus activity, aP.
| \begin{equation}
\varGamma_{\text{P}}^{\text{sat}} = -\frac{1}{RT} \cdot \frac{\partial\sigma}{\partial\ln a_{\text{P}}}
\end{equation}
| (4) |
where σ is the surface tension,
R is the gas constant, and
aP is the phosphorus activity. Assuming the molten Cu–P alloy sample is a dilute solution of phosphorus,
aP was defined by using the molar fraction of phosphorus,
nP, as follows,
| \begin{equation}
a_{\text{P}} = n_{\text{P}}
\end{equation}
| (5) |
Figure 4 shows the surface tension of molten Cu–P alloy measured at 1519 ± 10 K under a flowing Ar–He–10 vol%H2 gas with respect to aP, with a dashed line corresponding to the σP for comparison. It is confirmed that the increase in aP decreases the surface tension of molten Cu–P alloy. If we presumed that the gradient of surface tension with respect to aP becomes a constant at aP ≈ 10−3, the $\varGamma_{\text{P}}^{\text{sat}}$ can be evaluated to 1.362 × 10⁻⁵ mol·m−2.
4. Discussion
As previously stated, phosphorus acts as a surfactant for liquid copper. The σP and $\varGamma_{\text{P}}^{\text{sat}}$ was deduced from the measurement results of surface tension of molten Cu–P alloys. Based on these results, we use the following Szyskowski equation39) derived from the Langmuir adsorption isotherm and the Gibbs adsorption isotherm40) in an attempt to describe the surface tension of molten Cu–P alloy as functions of aP and temperature here:
| \begin{equation}
\sigma^{\text{P}} - \sigma = RT\varGamma_{\text{P}}^{\text{sat}}\ln(1 + k_{\text{ad}}a_{\text{P}})
\end{equation}
| (6) |
where
kad is the equilibrium constant for the following phosphorus adsorption reaction from the melt
| \begin{equation}
\underline{\text{P}}(\text{in melt}) \rightleftarrows \text{P}_{\text{ad}}
\end{equation}
| (7) |
It has been reported that the Szyskowski equation
39) can describe the effects of temperature and surfactants on surface tension for several metallic melts, such as iron, silver, and silicon.
13–15,41) Figure 5 exhibits the relationship between the ln
kad and the reciprocal of temperature, 1/
T, named van’t Hoff plot, calculated from
eq. (6) using the σ
P,
$\varGamma_{\text{P}}^{\text{sat}}$, and surface tension measurement results of molten Cu–P alloys described in the previous section. The good linearity of ln
kad with respect to 1/
T suggests the validity of our surface tension measurement results for molten Cu–P alloys; the phosphorus adsorption mechanism is constant regardless of
aP and temperature, at least under our measurement conditions. The temperature dependence of
kad can be expressed by a least-square method for the plots as follows,
| \begin{equation}
\ln k_{\text{ad}} = 3.918 \times 10^{3}T^{-1} - 0.7148
\end{equation}
| (8) |
Furthermore, it is suggested that a change in enthalpy for the phosphorus adsorption reaction on the liquid copper, $\Delta H_{\text{ad}}^{\circ} $, does not have a temperature dependence at least within the experimental temperature range using the following van’t Hoff equation:
| \begin{equation}
\frac{\partial (\ln k_{\text{ad}})}{\partial (1/T)} = -\frac{\Delta H_{\text{ad}}^{\circ}}{R}
\end{equation}
| (9) |
can be determined to be
$\Delta H_{\text{ad}}^{\circ} = - 32.57$ kJ·mol
−1 from the slope of
eq. (9), confirming that the phosphorus adsorption on the liquid copper is an exothermic reaction from the negative value.
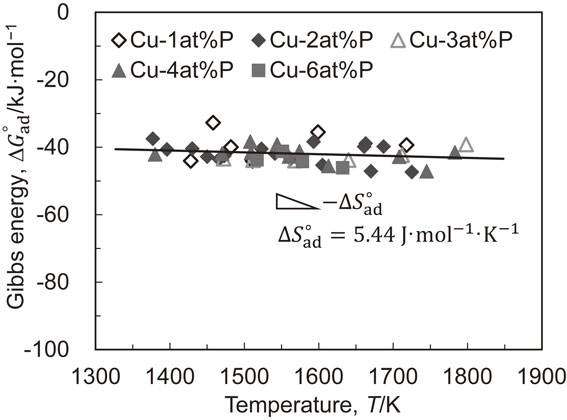
The standard Gibbs energy change in the phosphorus adsorption reaction, $\varDelta G_{\text{ad}}^{ \circ }$, can be calculated using the kad. The results are shown in Fig. 6. From the good linearity of $\varDelta G_{\text{ad}}^{ \circ }$ with respect to temperature, it can be described by a least-square approach for the plots as follows
| \begin{equation}
\varDelta G_{\text{ad}}^{\circ} = -33.36 - 5.444 \times 10^{-3}T\ [\text{kJ${\cdot}$mol$^{-1}$}]
\end{equation}
| (10) |
The negative value of
$\varDelta G_{\text{ad}}^{ \circ }$ within the measurement temperature range confirms that phosphorus adsorbs from the molten sample in this study.
Furthermore, the temperature gradient of $\varDelta G_{\text{ad}}^{ \circ }$, corresponding to a change in entropy for the phosphorus adsorption reaction ($\varDelta S_{\text{ad}}^{ \circ } = 5.444$ J·mol−1·K−1), is so small that the phosphorus adsorption amount varies little with temperature.
After determining σP, $\varGamma_{\text{P}}^{\text{sat}}$, and kad for liquid copper, the surface tension of molten Cu–P alloys is described as functions of temperature and aP using the Szyszkowski equation39) as follows:
| \begin{align}
\sigma & = 1310 - 0.202(T - 1358) - 1.398 \times 10^{-2}RT\\
&\quad \times \ln\{1 + \exp(3.918 \times 10^{3}T^{-1} + 0.715)a_{\text{P}}\}\\
&\quad \ [10^{-3}\,\text{N${\cdot}$m$^{-1}$}]
\end{align}
| (11) |
This equation fits the surface tension measurement results of molten Cu–P alloys reasonably, as shown in the solid line in
Fig. 7; we succeeded in the description of the effect of temperature and
aP on the surface tension of molten Cu–P alloys.
5. Summary
The surface tension of molten Cu–P alloys was precisely measured by an oscillating droplet method using EML, which is free from contamination from the supporting materials in consideration of the effect of oxygen partial pressure of the measurement atmosphere, $P_{\text{O}_{2}}$. The pure state value of surface tension for liquid copper, σP, was determined under flowing gas of Ar–He–10 vol%H2. The surface tension of molten Cu–P alloys was decreased, as the phosphorus content increased.
The full-coverage phosphorus adsorption for liquid copper, $\varGamma_{\text{P}}^{\text{sat}}$, was deduced from the surface tension measurement result with respect to phosphorus activity, aP, by using the Gibbs adsorption isotherm.
The temperature dependence of the equilibrium constant of the phosphorus adsorption reaction, kad, was evaluated using the Szyskowski model.39) The changes in enthalpy and entropy for the phosphorus adsorption reaction from the molten Cu–P alloys were deduced using the kad. Furthermore, the effects of temperature and aP on the surface tension of molten Cu–P were successfully expressed using formulas from the measurement result by using the Szyskowski equation.
Acknowledgments
This work was partially funded by a research grant from the Japan Institute of Copper. Part of this work was also financially support by JSPS KAKENHI under Grant No. P20H02453.
REFERENCES
- 1) K. Nogi, W.B. Chung, A. McLean and W.A. Miller: Mater. Trans. JIM 32 (1991) 164–168. doi:10.2320/matertrans1989.32.164
- 2) X.M. Xue, H.G. Jiang, Z.T. Sui, B.Z. Ding and Z.Q. Hu: Metall. Mater. Trans. B 27 (1996) 71–79. doi:10.1007/BF02915079
- 3) P. Kozakevitch and G. Urbain: Sci. Rev. Met. 58 (1961) 517–534.
- 4) F.A. Halden and W.D. Kingery: J. Phys. Chem. 59 (1955) 557–559. doi:10.1021/j150528a018
- 5) K. Ogino, K. Nogi and O. Yamase: Trans. ISIJ 23 (1983) 234–239. doi:10.2355/isijinternational1966.23.234
- 6) S.I. Popel, V.N. Kozhurkov and A.A. Zhukov: Izv. Akad. Nauk SSSR Met. (1975) 56–60.
- 7) K. Monma and H. Suto: J. Japan Inst. Metals 24 (1960) 374–377. doi:10.2320/jinstmet1952.24.6_374
- 8) Z. Morita and A. Kasama: Trans. JIM 21 (1980) 522–530. doi:10.2320/matertrans1960.21.522
- 9) T.E. O’Brien and A.C.D. Chaklader: J. Am. Ceram. Soc. 57 (1974) 329–332. doi:10.1111/j.1151-2916.1974.tb10915.x
- 10) B. Gallois and C.H.P. Lupis: Metall. Trans. B 12 (1981) 549–557. doi:10.1007/BF02654326
- 11) S.P. Mehrotra and A.C.D. Chaklader: Metall. Trans. B 16 (1985) 567–575. doi:10.1007/BF02654855
- 12) J. Lee, T. Tanaka, Y. Asano and S. Hara: Mater. Trans. 45 (2004) 2719–2722. doi:10.2320/matertrans.45.2719
- 13) S. Ozawa, K. Morohoshi, T. Hibiya and H. Fukuyama: J. Appl. Phys. 107 (2010) 014910. doi:10.1063/1.3275047
- 14) S. Ozawa, S. Suzuki, T. Hibiya and H. Fukuyama: J. Appl. Phys. 109 (2011) 014902. doi:10.1063/1.3527917
- 15) S. Ozawa, Y. Nagasaka, M. Itakura, K. Sugisawa and Y. Seimiya: J. Appl. Phys. 130 (2021) 135101. doi:10.1063/5.0062062
- 16) S. Ozawa, S. Takahashi, N. Watanabe and H. Fukuyama: Int. J. Thermophys. 35 (2014) 1705–1711. doi:10.1007/s10765-014-1674-5
- 17) K. Mukai, Z. Yuan, K. Nogi and T. Hibiya: ISIJ Int. 40 (2000) S148–S152. doi:10.2355/isijinternational.40.Suppl_S148
- 18) E. Ricci, E. Arato, A. Passerone and P. Costa: Adv. Colloid Interface Sci. 117 (2005) 15–32. doi:10.1016/j.cis.2005.05.007
- 19) G. Bernard and C.H.P. Lupis: Metall. Trans. 2 (1971) 2991–2998. doi:10.1007/BF02814945
- 20) I. Egry, E. Ricci, R. Novakovic and S. Ozawa: Adv. Colloid Interface Sci. 159 (2010) 198–212. doi:10.1016/j.cis.2010.06.009
- 21) S. Ozawa, T. Koda, M. Adachi, K. Morohoshi, M. Watanabe and T. Hibiya: J. Appl. Phys. 106 (2009) 034907. doi:10.1063/1.3190495
- 22) S. Ozawa, S. Suzuki, Y. Iwasaka, K. Sugawara, K. Morohoshi, H. Fukuyama and T. Hibiya: Current Advances in Materials and Processes: Report of the ISIJ Meeting, (The Iron and Steel Institute of Japan, 2009) 22901.
- 23) I. Egry, H. Giffard and S. Schneider: Meas. Sci. Technol. 16 (2005) 426–431. doi:10.1088/0957-0233/16/2/013
- 24) L. Rayleigh: The Royal Soc. 29 (1879) 71–97.
- 25) D.L. Cummings and D.A. Blackburn: J. Fluid Mech. 224 (1991) 395–416. doi:10.1017/S0022112091001817
- 26) O. Knacke, O. Kubaschewski and K. Hesselmann: Thermochemical Properties of Inorganic Substances, 2nd ed., (Springer-Verlag, Berlin, 1991) p. 811.
- 27) H. Soda, A. McLean and W.A. Miller: Trans. JIM 18 (1977) 445–454. doi:10.2320/matertrans1960.18.445
- 28) Y. Kawai, M. Kishimoto and H. Tsuru: J. Jpn. Inst. Met. Mater. 37 (1973) 668–672. doi:10.2320/jinstmet1952.37.6_668
- 29) R. Novakovic, E. Ricci, D. Giuranno and A. Passerone: Surf. Sci. 576 (2005) 175–187. doi:10.1016/j.susc.2004.12.009
- 30) B.J. Keene: Int. Mater. Rev. 38 (1993) 157–192. doi:10.1179/imr.1993.38.4.157
- 31) K. Nogi, K. Oishi and K. Ogino: J. Jpn. Inst. Met. 52 (1988) 72–78. doi:10.2320/jinstmet1952.52.1_72
- 32) J. Lee, A. Kiyose, S. Nakatsuka, M. Nakamoto and T. Tanaka: ISIJ Int. 44 (2004) 1793–1799. doi:10.2355/isijinternational.44.1793
- 33) D.A. Harrison, D. Yan and S. Blairs: J. Chem. Thermodyn. 9 (1977) 1111–1119. doi:10.1016/0021-9614(77)90112-4
- 34) A. Kasama, T. Iida and Z. Morita: J. Jpn. Inst. Met. Mater. 40 (1976) 1030–1038. doi:10.2320/jinstmet1952.40.10_1030
- 35) I. Egry, S. Sauerland and G. Jacobs: High Temp. High Press. 26 (1994) 217–223.
- 36) R. Brooks, I. Egry, S. Seetharaman and D. Grant: High Temp. High Press. 33 (2001) 631–637. doi:10.1068/htwu323
- 37) T. Matsumoto, H. Fujii, T. Ueda, M. Kamai and K. Nogi: Meas. Sci. Technol. 16 (2005) 432–437. doi:10.1088/0957-0233/16/2/014
- 38) S.K. Rhee: J. Am. Ceram. Soc. 53 (1970) 639–641. doi:10.1111/j.1151-2916.1970.tb12031.x
- 39) B. von Szyszkowski: Z. Phys. Chem. 64U (1908) 385–414. doi:10.1515/zpch-1908-6425
- 40) N.H. March and M.P. Tosi: Atomic Dynamics in Liquids, (MacMillan, London, 1976) p. 275.
- 41) G.R. Belton: Metall. Mater. Trans. B 7 (1976) 35–42. doi:10.1007/BF02652817