Abstract
The increasing demand and exorbitant use of river bed sand in foundries over the years have led to its depletion at an alarming rate. Consequently, many states in India have imposed severe restrictions on the mining of riverbed sand. Therefore, an effort is made to explore the potential use of sea sand for cast iron foundry applications. Experiments were performed for optimizing the composition of molding sand with respect to functional properties namely, strength, mold hardness, and permeability. The optimum composition of molding sand comprised of 8.33 wt% bentonite and 3.12 wt% moisture, and 88.54 wt% sea sand. Trials were conducted in a local foundry to ascertain the suitability of using a mixture of sea sand, bentonite, and water for producing defect-free gray iron casting. The trial was successful and parts were accepted for production purposes.
1. Introduction
Riverbed sand is conventionally used in the majority of foundries around the world.1) Most of these sand grains are of medium to medium-fine particle size, sub-angular in shape, comprising of silica greater than 95%. The over usage of river bed sand over the last few decades has resulted in its near extinction at many places enforcing the local government to ban its mining in various states in India. Gujarat, a state in the western part of India has the long coastal line in the country. Sand is abundantly available on the coastline. However, sea sand usually consists of relatively less silica (∼85%), which is the primary sand mold ingredient to provide the desired refractoriness required for foundry applications. Therefore, it is prudent to explore the potential usage of sea sand for application in cast iron foundries.
The composition and physical properties of molding sand play a vital role in producing near-net-shape castings of high quality. The effect of molding sand composition on the quality of casting made from gray cast iron was studied by Kumar et al.2) They optimized the composition of molding sand and significantly minimized defects such as blowholes, sand drop, warpage, shifts, etc. in casting used as housing covers. The physical properties of sand mold also depend on the shape and size of sand grains. Literature shows that the angular sand grains provide greater mechanical strength and produces good castings owing to their superior interlocking and venting ability.3) Further, the process for producing high strength casting requires the optimum amount of clay and moisture in the sand mold.4) However, Zaman et al. report that the moisture content had a negligible effect on permeability and hardness.5) In another study, it reports that the optimum composition of sand, bentonite, and water is 90%, 5%, and 5%, respectively for producing superior quality casting.6) There exists a wide variation in the reported value of sand mold composition in the literature. The importance of key factors in optimizing the green sand casting process for producing good quality casting is reported elsewhere.6,7) Impurities in the sand also affect the quality of castings. The rejection rate of iron casting in foundries can be reduced by removing impurities from sand.8) Impurities in the sand such as CaO, K2O, Na2O, etc. reduce the refractoriness of silica sand. Green sand is also known for producing less constraining force during casting of gray cast iron;9) thus limiting distortion, residual stress, and cracking in the casting.
Bentonite is often used as a common binder in making sand molds and cores in foundry due to its availability and ease of recycling of molding material.7,10) In this study, the composition of sea sand, bentonite, and moisture was optimized for getting required functional properties of sand mold. Pouring test was conducted at a foundry to assess the effectiveness of sea sand as molding material in producing gray iron casting.
2. Experimental Methods
2.1 Raw material
Sea sand was procured from Kutch region in India. The chemical composition of sand determined by the gravimetric method is shown in Table 1. The AFS fineness number is calculated from results obtained from sieve analysis (Table 2). The AFS fineness number is a measure of particle size distribution. The AFS fineness number of sea beach sand was 84.76. In this study, sand particles in the range of 100 µm to 400 µm were used in making green sand. The morphology of sea beach sand was sub-rounded and rounded and those of river sand was angular and sub-angular. The roundness of the sand grain was measured using Image J software. Roundness was calculated using the following formula:
| \begin{equation*}
\textit{Roundness} = 4*\frac{[\textit{Area}]}{\pi[\textit{Major axis}]^{2}}
\end{equation*}
|
The roundness values of sea sand and river sand grains are 0.79 and 0.73, respectively.
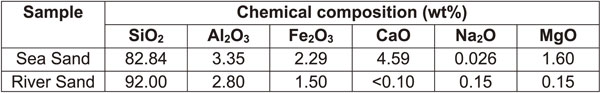
Table 1 Chemical composition of sea sand and river sand.
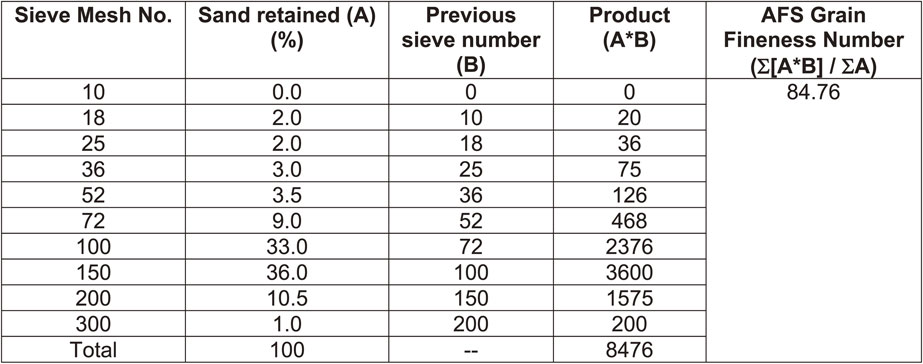
Table 2 Sieve analysis of sea beach sand.
The amount of clay in the sample was 4.9 wt%. The sea sand was washed multiple times using 10% NaOH solution for reducing its clay content prior to the making of green sand.
Two different grades of bentonite were prepared at a local manufacturer. These are designated as Bentonite 1 and Bentonite 2. Properties and chemical compositions of bentonite are shown in Table 3, and 4, respectively. The composition of two grades are similar even though their swelling index and methylene blue value differs significantly. The swelling index of Bentonite 1 is 36% which is less than those of Bentonite 2. The variation in swelling index of Bentonite 1 and Bentonite 2 is attributed to the variation in their dry density and initial moisture content. In general, swelling index increases with the increase in dry density. The swelling index increases with the increase in initial moisture content to a threshold value; beyond which, it decreases with the further increase in the initial moisture content.11)
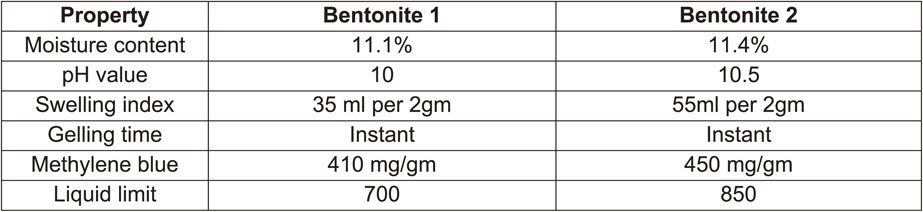
Table 3 Properties of two grades of bentonite.

Table 4 Chemical composition of Bentonite.
Samples of dimension 50 mm (diameter) × 50 mm (height) were prepared as per AFS 5222-13-S specification with varying composition. Following properties of sand mold samples were measured:
-
1)
Green and dry compression strengths of samples as per AFS 5202-19-S specification.
-
2)
Permeability of samples as per AFS 5224-13-S specification.
-
3)
Mold hardness and green shear strengths of samples were measured as per AFS standard practices.12)
Molding sand of various compositions was prepared in a Sand Muller for various Clay to Water (C/W) ratios. Further, at each value of C/W ratio, the amount of bentonite was varied to 4 levels. Various compositions of molding sand are shown in Table 5.

Table 5 Composition of molding sand samples for various C/W ratios.
Pressure plate was cast in mold made from sea sand and its surface roughness, hardness, tensile properties were measured. Metallographic samples were prepared as per ASTM E3 specification and etched using 4% Nital reagent for microstructural examination.
3. Results and Discussion
The effect of composition on various properties of sand mold sample are shown in Table 6 and discussed below.
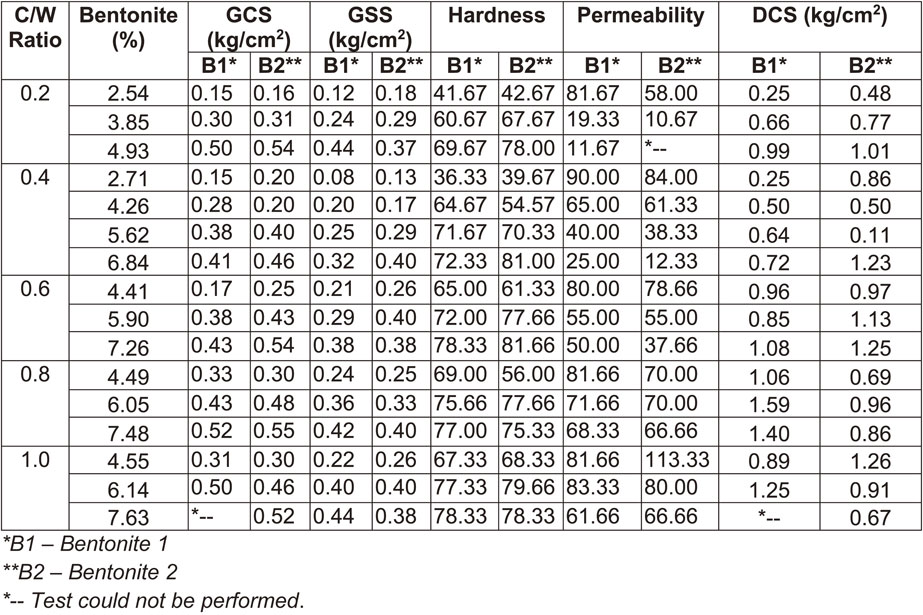
Table 6 Properties of green sand mold at various compositions.
As expected, the GCS value increases with the increase in clay content for both grades of bentonite. This is because clay enhances the adhering ability of sand grains. At a C/W ratio of 0.8, the highest GCS values of 0.52, and 0.55 kg/cm2 are noted using 7.48 wt% of Bentonite 1 and Bentonite 2, respectively. The typical recommended green compression strength of sand mold for casting gray cast iron ranges from 0.5–0.7 kg/cm2.13)
The trend in the variation of GSS value is similar to those of GCS value. The GSS value increases with the increase in clay content for both Bentonite 1 and Bentonite 2. The effect of bentonite type on GSS value is of mixed type and it depends on its amount and C/W ratio. No GSS value is reported for the amount of bentonite less than 3 wt% and C/W ratio in the range of 0.6–1.0. This is due to the poor green shear strength at higher C/W ratios (i.e. in the range of 0.6–1.0) and low bentonite content (i.e. less than 3 wt%).
3.2 Effect of bentonite content on Mold Hardness (MH)
In general, the MH of samples increases with the increase in bentonite content up to a certain threshold value depending on the C/W ratio; above which the effect of bentonite content on mold hardness is marginal. The highest mold hardness of 81.66 is achieved using 7.26 wt% of Bentonite 2 and a C/W ratio of 0.6. The typically recommended hardness value of sand mold for casting gray cast iron ranges from 75–85.13)
3.3 Effect of bentonite content on permeability
At a low C/W ratio in the range of 0.2–0.6, the permeability of green sand decreases significantly with the increase in bentonite content. However, at high C/W ratios of 0.8 and 1, the decrease in permeability with the increase in bentonite content is moderate. This is attributed to the decrease in the volume fraction of pores in the molding sand sample on increasing the amount of clay content. The typical permeability value of green sand mold is in the range of 80–100 mL/minute.13) An optimum level of permeability is required for allowing gases to escape the mold during sand casting. If the permeability is too low, then gases are entrapped in the sand mold resulting in defective casting and if the permeability is too high then mold strength becomes too low resulting in erosion of sand during pouring of molten metal. In both cases (i.e. high and low permeability), casting of poor quality is produced.
3.4 Effect of bentonite content on Dry Compressive Strength (DCS)
Dry compressive strength is a measure of the resistance of sand mold to stresses generated during the pouring of molten metal. In general, the high value of dry compressive strength implies stronger sand mold but greater is the difficulty associated with shakeout, cracks, and hot tears. The highest DCS value of 1.59 kg/cm2 is recorded using 6.05 wt% of Bentonite 1 and a C/W ratio of 0.8. Water plays an important role in the formation of clay film around sand grain that provides the required strength. In general, a higher amount of water results in the easy spread of the clay film and reduces mulling time. However, a higher amount of water forms thin clay film which reduces the strength of sand mold. Therefore, an optimum amount of water is required to produce sand molds of desired strength.
3.5 Statistical analysis
Regression analysis was performed to establish the role of independent variables on a dependent variable. The regression equation and its corresponding R2 value for various dependent variables are shown in Table 7–8. In Table 7, Y is the dependent variable and the independent variables are X1 (amount of water), and X2 (amount of bentonite) in the molding sand sample. The non-linear regression analysis is considered valid for properties namely, GCS, GSS, DCS, and DSS, as it resulted in higher R2 values as compared to linear regression analysis. Whereas, in case of permeability, linear regression is considered valid.

Table 7 Regression equation of various dependent variables.
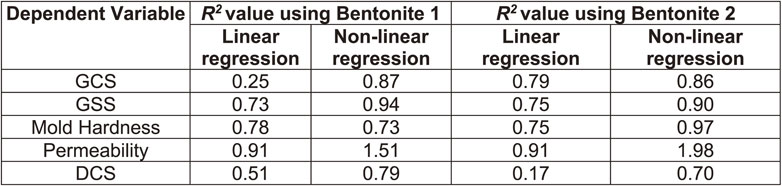
Table 8 Comparative R2 values between linear and non-linear regression analysis.
In general, regression analysis shows that Bentonite 2 is a superior grade as compared to Bentonite 1 for foundry application. Therefore, Bentonite 2 was selected as the preferred bonding agent for conducting trials in a local foundry. Various properties of the sand mold sample were calculated using respective valid regression equation by varying the amount of water from 2 wt% to 3.5 wt% and the amount of Bentonite 2 from 6 wt% to 8.5 wt%. The predicted value of sand mold properties at various compositions is shown in Table 9. The composition was optimized by comparing the predicted value of various properties with the required values of sand mold for cast iron foundry applications (Table 10). The optimum amounts of water and Bentonite 2 required for achieving desired sand mold properties are 3.125 wt% and 8.33 wt%, respectively. The industrial trial was conducted using optimum sand mold composition.

Table 9 Predicted sand mold properties for various compositions.
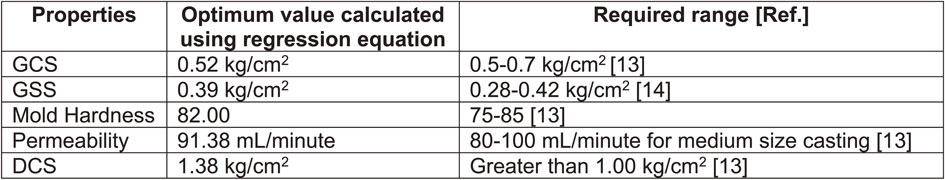
Table 10 Optimum properties of molding sand and range of their required values.
Compactibility test was performed on green sand consisting of sand, bentonite, and water. The compactibility of green sand was measured by filling a standard tube (4.75-inch high and 2-inch diameter) with green sand and the sample was rammed three times using a standard rammer as per AFS 5222-13-S specification. The distance from the top of the tube to the surface of rammed sand is a measure of compactibility. The test was performed at an optimum green sand composition (i.e. 3.12 wt% of water, 8.33 wt% of Bentonite 2). Three tests were performed for each sand sample. The average compactibility values of green sand made from river bed sand and sea beach sand are 40% and 32%, respectively. The recommended range of green sand compactibility is from 30 to 40% for foundry applications.
3.7 Performance test
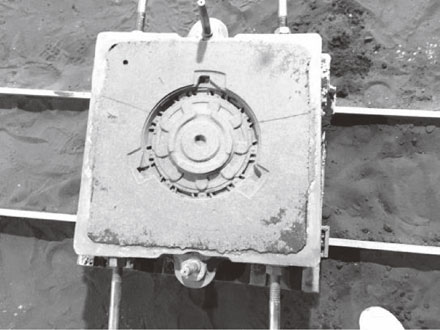
Coreless greensand molds were prepared by mixing 85 kg of sea sand, 8 kg of Bentonite 2 (i.e. 8.33 wt%), and 3 liters of water (i.e. 3.12 wt%) in a sand Muller. The casting is currently being produced on a commercial scale using river bed sand, bentonite, coal dust, and water as mold ingredients. The casting is used as a pressure plate. The casting was made of gray cast iron. An overview of sand mold is shown in Fig. 1. The sand mold was made by the machine molding method. The casting was made from a coreless mold of medium size and its mass was 6.27 kg.
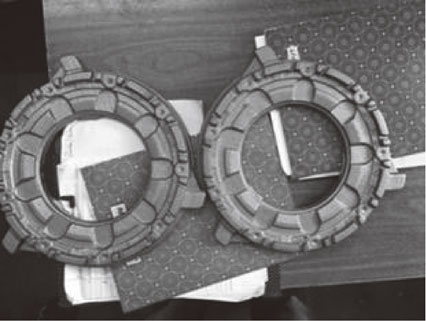
An overview of as–cast pressure plates produced in mold made from sea sand, Bentonite 2, and water is shown in Fig. 2. The visual and liquid penetrant inspection did not show any evidence of casting defects such as blowholes, sand inclusions, and hot tears on castings. Further, there was no evidence of adverse surface reaction between casting and molding material. Pressure plate cast in mold made from sea sand and Bentonite 2 conformed to the internal customer specification and was considered suitable for commercial production.
The average surface roughness (Ra) of casting produced using sea sand is 9.2 µm and its standard deviation is 1.2 µm. In contrast, the surface roughness (Ra) of casting produced using riverbed sand is 23.5 µm and its standard deviation is 3.5 µm. The average surface roughness (Ra) of gray iron casting produced in the mold using uncoated river bed sand (with Grain fineness number of 53), coal dust, bentonite, and water as molding material was in the range of 5.84–10.19 µm.15) Coal dust is primarily added to achieve a better surface finish and prevent metal penetration into the sand mold. However, the addition of coal dust also reduces permeability and thereby increases the volume fraction of blowholes and gas porosity due to gas entrapment in the casting. Therefore, this study shows that the usage of coal dust can be eliminated in producing casting using sea sand as molding material without compromising quality. Eliminating the usage of coal dust has a great ramification in reducing the cost of production and health hazard in foundries. Although there is no surface roughness standard for cast iron products, it is important to produce castings with a smooth surface finish. This is because it plays an important role in achieving the required dimensional tolerance of casting and minimizes secondary machining operations.
3.8 Microstructural analysis
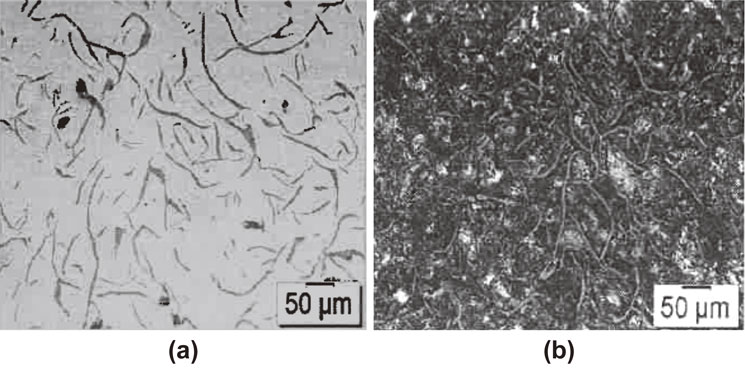
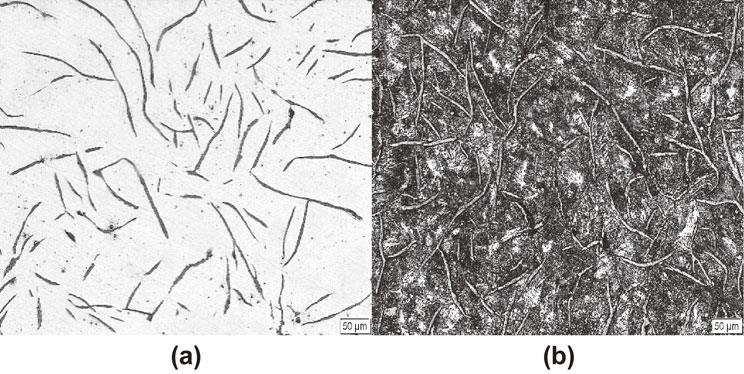
Microstructures of gray iron casting produced using sea sand and river sand in as-polished and etched conditions are shown in Fig. 3(a)–(b) and 4(a)–(b), respectively. The microstructure of both castings consists of typical graphite flakes of Type VII, size class 3, and Type A distribution in a matrix of pearlite as per ASTM A247-19 specification. The formation of Type A graphite in both castings signifies that the cooling rates during solidification are relatively low. In addition, ferrite was also present in the matrix. The image analysis results show that the area fraction of ferrite in casting made using sea sand and riverbed sand was 10.36%, and 9.37%, respectively. Therefore, the variation in microstructure in terms of graphite type, and area fraction of ferrite is marginal between the casting produced using sea sand and riverbed sand. A similar microstructure of gray cast iron without spheroidizing treatment has been reported elsewhere.16,17) Since the size and distribution of graphite and ferrite in the casting made from sea sand mold and river sand mold are similar, therefore, it is concluded that both castings have undergone a similar cooling rate during solidification. Mechanical properties of gray cast iron depend on its microstructure in terms of type and size of graphite flakes and ferrite phase in the perlite matrix.
The hardness and tensile properties of iron casting produced using sea sand are shown in Table 11. The average Brinell hardness number (BHN) of the casting is 181BHN and its standard deviation is 1.9BHN.
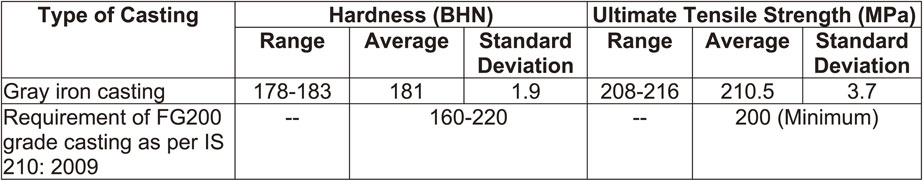
Table 11 Brinell hardness and tensile properties of iron casting produced using sea sand.
The average ultimate tensile strength (UTS) of the casting is 210.5 MPa, and its standard deviation is 3.7 MPa. The ultimate tensile strength of the casting conformed to grade FG200 as per IS 210: 2009 specification, which is equivalent to Class 30A of ASTM A48-94a specification.
4. Conclusions
-
(1)
Sea sand is successfully used for producing small/medium gray iron cavity less castings of good quality and has potential for similar coreless green sand molding applications.
-
(2)
Casting produced using sea sand has good surface finish. This is a promising result since the use of coal dust (commonly practiced in foundries) as an additive for achieving a better surface finish can be eliminated.
-
(3)
Regression analysis provides a good estimation of dependent variables as a function of independent variables. In general, the amount of bentonite is the primary dominant factor affecting various dependent variables as compared to the amount of water.
-
(4)
Visual and liquid penetrant inspection does not reveal any evidence of blowholes, sand inclusion and cracks on the surface of the casting.
-
(5)
Ultimate tensile strength and hardness of iron casting conformed to FG200 grade of IS 210-2009 specification.
Acknowledgments
The support received from Mr. Sanjay Desai, RBD Engineering Private Limited, Gujarat, India in conducting trials is gratefully acknowledged. The technical help received from Mr. Amit Dave of Met-Heat Engineers Private Limited, Vadodara, India and Mr. Hemant Jani, Western Refra Cast, India is highly appreciated.
REFERENCES
- 1) M.C. Zanetti and S. Fiore: Resour. Conserv. Recycling 38 (2003) 243–254. doi:10.1016/S0921-3449(02)00154-4
- 2) S. Kumar, P.S. Satsangi and D.R. Prajapati: Int. J. Adv. Manuf. Technol. 55 (2011) 23–34. doi:10.1007/s00170-010-3029-0
- 3) K.C. Bala and R.H. Khan: Leonardo J. Sci. 23 (2013) 77–83.
- 4) M.V. Mohiuddin, S.F. Hussain, A. Krishnaiah, P. Laxminarayana and S. Sundarrajan: J. Mech. Civ. Eng. 11 (2014) 1–6.
- 5) T. Zaman, A. Al Mahmood and H. Zaman: International Conference on Mechanical, Industrial, and Materials Engineering, (Rajshahi, Bangladesh, November 2013).
- 6) S. Shahria, M. Tariquzzaman, M.H. Rehman, M. Al Amin and M.A. Rahman: Int. J. Mech. Eng. Appl. 5 (2017) 155–161.
- 7) R. Banchhor and S.K. Ganguly: Int. J. Adv. Eng. Technol. V (2014) 25–29.
- 8) N. Poulose and E. George: Int. J. Eng. Trends Technol. 9 (2014) 331–333. doi:10.14445/22315381/IJETT-V9P264
- 9) S. Ueno, H. Kashimura, Y. Sano, T. Toyoda, H. Makino and M. Yoshida: Mater. Trans. 59 (2018) 957–962. doi:10.2320/matertrans.F-M2018817
- 10) C. Saikaew and S. Wiengwiset: Appl. Clay Sci. 67–68 (2012) 26–31. doi:10.1016/j.clay.2012.07.005
- 11) C. Huang, X. Wang, H. Zhou and Y. Liang: Adv. Civ. Eng. (2019) 1–13.
- 12) American Foundry Society: Mold and Core Test Handbook, ed. by AFS Molding Methods and Materials Division and S. Thomas, (Des Plaines, Illinois, 2001).
- 13) T.V.R. Rao: Metal Casting Principles and Practice, (New Age International (P) Limited, New Delhi, 1996) p. 35.
- 14) R.W. Heine, C.R. Loper, Jr. and P.C. Rosenthal: Principles of Metal Casting, (McGraw Hill, New York, 1967).
- 15) J.W. Torrance and D.M. Stefanescu: AFS Trans. 04-013 (2004) 1–16.
- 16) A. Almanza, M.J. Perez and E. Almanza: Int. J. Met. Cast. 9 (2015) 84–86. doi:10.1007/BF03355609
- 17) T. Hara, T. Kitagawa, K. Kuroki, S. Saikawa, K. Terayama, S. Ikeno and K. Matsuda: Mater. Trans. 55 (2014) 1500–1505. doi:10.2320/matertrans.M2014167