Microstructure of Materials
Modelling Effects of Copper on Microstructure and Properties of Al–Si–Cu Alloys
2023 年 64 巻 1 号 p. 177-183

詳細
2023 年 64 巻 1 号 p. 177-183
The combined impacts of copper content, cold working and homogenization in aluminium–silicon alloys were examined using microstructure study, thermodynamic modelling, image analysis and hardness measurement. Two aluminium alloys of varying copper contents were cast in a permanent mould using induction furnace. Microstructural observation revealed the formation of varying amount of intermetallic phases due to the presence of copper. Image analysis confirms the relative changes in percent phase fractions owing to presence of copper as intermetallic phases increases. Al2Cu phase was most favoured with increasing copper. Cold working was performed by reduction of 5%, 10% and 15% of the cast alloys by equal amounts of strain. Hardness measurements indicated increase in hardness values attributed to both higher amounts of copper and cold working. Al2Cu phase was predicted contribute compared to Al7Cu4Ni and Alpha phases. Homogenization at 300°C for 4 hr would suffice to obtain a uniform structure. The reasons for changes in microstructure and mechanical properties for different copper content were established by thermodynamic phase fraction calculation. Higher amounts of copper leads to greater volume fractions of intermetallic phases. Using solidification calculations, it is found that copper in liquid encourages dendrite formation which was also evident from microstructure.
Addition of copper in aluminium alloys can significantly alter the secondary phase formation, with abrupt changes in liquidus and solidus temperatures and solidification regions. At the same time, hardness values are also adjusted based on the phases predicted. Copper has more affinity for the Al2Cu phase compared to Al7Cu4Ni in the investigated alloys systems.
Aluminium is the most abundant metal in the earth’s crust. It makes up about 8% by weight of the earth’s solid surface. Aluminium alloys with a wide range of properties are used in engineering structures. These properties can be largely modified by changing the alloy composition. Silicon, copper, zinc and magnesium are the most commonly used alloying elements in aluminium, which have sufficient solid solubility.
The effect of copper additions on the structural features and mechanical properties of aluminium–silicon–copper alloy have shown that copper additions increase the strength of these alloys.1–5) Yield strength, hardness and microhardness increase with increase in the copper content regardless of the alloy.6) Copper also improves machinability; however, castability, ductility and corrosion resistance are all typically lessened. Commercial aluminium–silicon–copper alloys have been available for many years and compromises have been reached between these various properties. Compositions lie mostly within the ranges 3.0–10.5% silicon and 1.5–4.5% copper. The higher silicon alloys (e.g., aluminium–10silicon–2copper) are used for pressure die castings, whereas alloys with lower silicon and higher copper (e.g., aluminium–3silicon–4copper) are used for sand and permanent mould castings. In general, aluminium–silicon–copper alloys are used for many of the applications of Al–Si alloys where higher strength is needed. One example is the use of alloy 319 (aluminium–6silicon–3.5copper) for die cast (permanent mould) automotive engine blocks and cylinder heads in place of cast iron.7)
The as-cast microstructure of cast aluminium alloys normally displays significant segregation and supersaturation.8) For this, homogenization of aluminium alloys is often done to improve workability and mechanical properties by dissolving the non-equilibrium, brittle, interdendritic constituents and by providing a more homogeneous structure.
Thermodynamic models have been developed for the calculation of various thermo-physical and physical properties with the aim of providing thermo-physical and physical properties for various types of multi-component alloys during solidification. Calculation of Phase Diagrams method calculates a wide range of materials properties for alloys and is particularly aimed at multi-component alloys.9) Using phase analysis by this thermodynamic method and microstructure analysis from optical images, the phases can be predicted which have direct influences on the mechanical properties of different alloys.
In this work, the effects of copper content, extend of cold working and influences of homogenization treatments on microstructure and mechanical properties were studied.
Two aluminium alloys were prepared by using slightly pure aluminium ingot and pure copper wire. The raw materials were melted into a gas-fired crucible pit furnace and were cast in a permanent mould in the shape of a long rectangular bar. For changing the alloy composition, second casting was done similarly. The size of the bar was 170 mm in length with a diameter of 17 mm. For both alloys, the melt was heated up to 850°C and poured at 800°C. Compositions of both alloys were measured by Optical Emission Spectrometer (Shimadzu PDA 700), Table 1.

For cold deformation of both alloys, cylindrical pieces were made by machining (length 50 mm and diameter 17 mm, maintaining the ratio L/D = 3).10) Compression of 5%, 10% and 15% of the samples was done in a Universal Testing Machine.
Homogenization of the alloys was carried out in a BlueM Electric furnace at 300°C for 1, 2 and 4 h. After homogenization, the samples were quenched in running tap water.
The hardness of the alloys at several steps was measured by a hardness testing machine in Rockwell B scale.
Microstructures of all samples were studied in unetched condition. All images were acquired in an Optica B-600 MET trinocular upright metallurgical microscope, using OpticaTM Vision Pro software. Images were taken in same X500 magnification for comparing. Image of graticule scale (1 div = 0.01 mm) was also taken in same magnification to quantify the dimensions of microstructure.
Image analysis was performed using ImageJ version 1.43u to find out the amounts of different phases. 50 microstructures for each alloy were taken and analysed to find out the average values of the amount of phase areas. Modelling of the alloys were predicted using JMatPro software package, to assume the relationship between composition, temperature, phases and properties.
Presence of silicon and several intermetallic compounds in the aluminium matrix were identified, Fig. 1. The microstructure of the alloy B changed considerably owing to copper addition, compared to alloy A. Both silicon and intermetallic compounds were present as much smaller particles than before and were spaced closely with each other. Different secondary phases were determined using Energy Dispersive Analysis in a scanning electron microscope.

Microstructure of as-cast (a) alloy A and (b) alloy B.
The cold working did not produce any significant changes in the microstructure of both alloys, Figs. 2 and 3. For alloy A, both silicon and intermetallics are present as large size particles as before. The microstructure of the alloy B also remained almost same after cold working. Also, no significant variation can be observed with increased working. The particle breakdown was evident in both alloys.
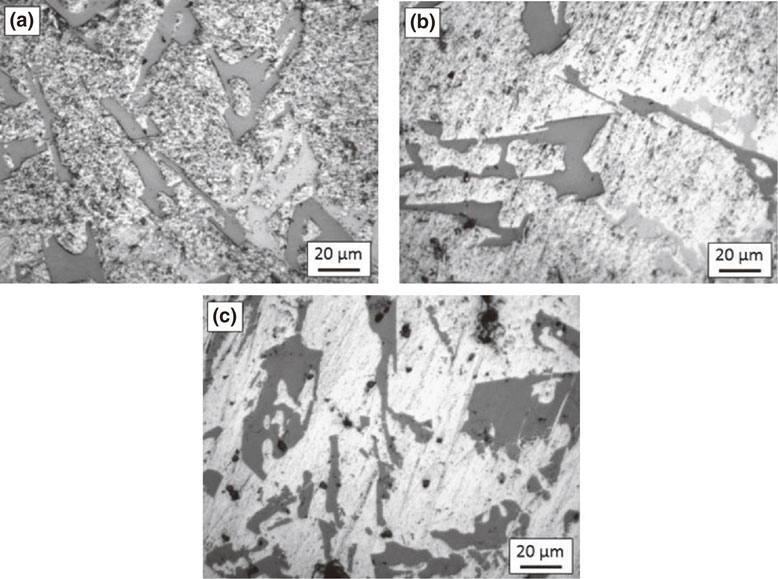
Microstructure of alloy A after reduction by (a) 5%, (b) 10% & (c) 15%.
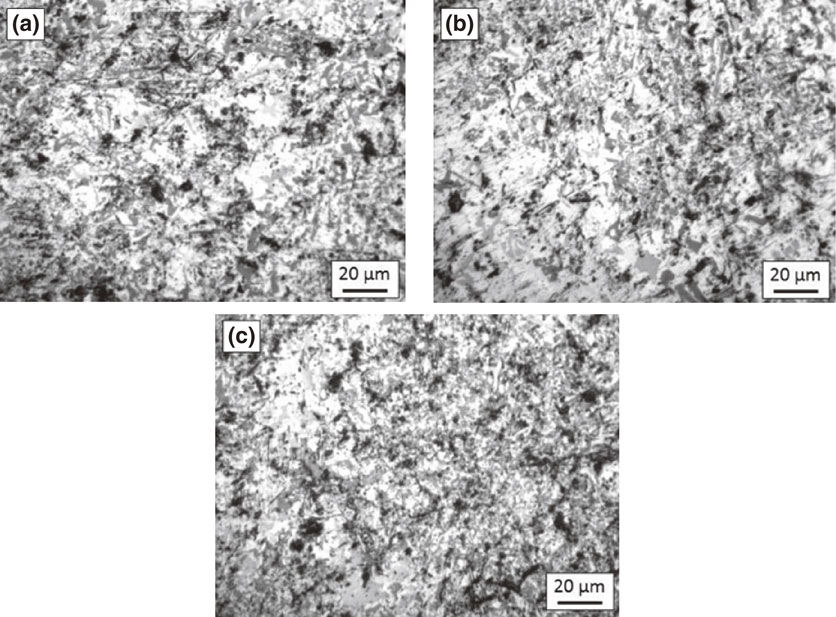
Microstructure of alloy B after reduction by (a) 5%, (b) 10% & (c) 15%.
After homogenization of 1 hour at 300°C, the fine particles of silicon and intermetallics are observed to be distributed around the dendritic pure aluminium matrix, Fig. 4. With increased homogenization time, the dendrites start to remove, and the particles become larger by diffusion as can be seen after 2 hours. But after 4 hours, dendrites are eliminated completely, whereas the particles have grown all throughout the matrix.
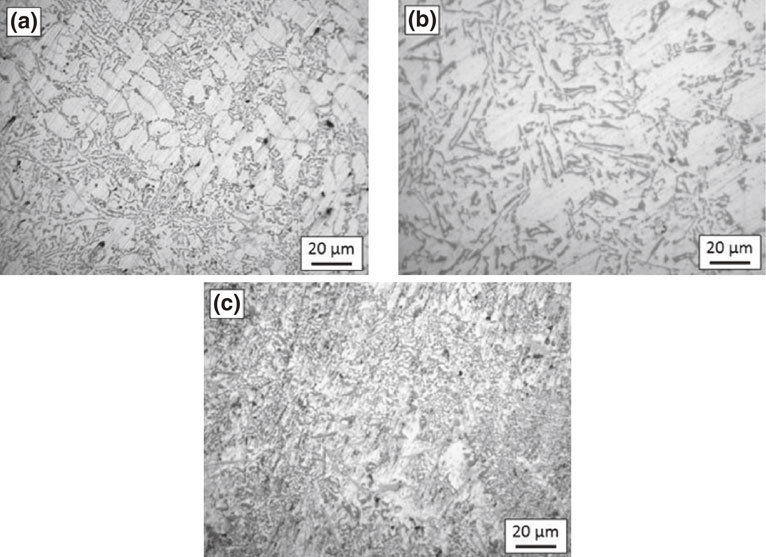
Microstructure of alloy B after heating at 300°C for (a) 1 h, (b) 2 h and (c) 4 h.
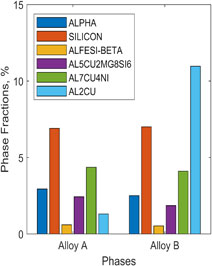
Using ImageJ software package, the image analysis was carried, Fig. 5. It is obvious that the amount of total intermetallic compounds has increased significantly in alloy B due to copper addition.

Image analysis result of phase fractions for alloy A and alloy B from optical images.
From the Step Temperature calculation with JMatPro software package in the equilibrium condition, the stability of the predicted phases is clearly visible, Fig. 6. The aluminium matrix is just above 80% (not shown) and the rest is comprised with silicon and other intermetallic phases. Silicon phase was found to form early.
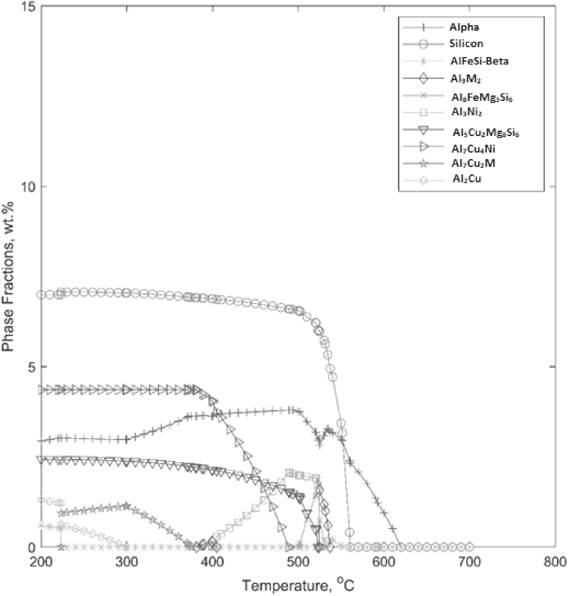
Step temperature modelling of alloy A.
Aluminium–nickel phase (Al3Ni2) evolves at about 520°C, grows up to 2 wt% and then totally eliminates at 400°C. While this phase lowers, another Aluminium–copper–nickel phase (Al7Cu4Ni) evolves at 490°C, grows to 4.4 wt% and then remains stable with lowering temperature. So, those aluminium and nickel contents in aluminium–nickel phase are transferred to the new Al–Cu–Ni phase.
Also, the alpha solid solution grows to 3.8 wt% after nucleating at 620°C, and lowers to 2.5 wt% with lowering temperature. At the same period, an Aluminium–copper–magnesium–silicon phase (Al5Cu2Mg8Si6) continues to grow from 1.5 to 2.5 wt%.
An unstable Aluminium–iron–magnesium–silicon phase (Al8FeMg3Si6) was present between 520°C to 500°C. The aluminium, iron and silicon content of this phase goes to another aluminium–iron–silicon phase (β-AlFeSi) which is stable below 220°C. The magnesium content of that phase goes to the aluminium–copper–magnesium–silicon phase stated earlier.
CALPHAD modelling of Alloy A reveals the amount of liquid present at different temperatures. It was calculated that solidification started at 620°C and completed at 520.89°C. Consequently, the solidification range becomes 99.11°C. Aluminium alloys show considerable shrinkage and dendrite formation.11) The situation of the mushy zone of the alloy during solidification reveals that the density of the liquid phase increases up to about 2.75 g cm−3 due its enrichment with copper and other elements, Fig. 7.
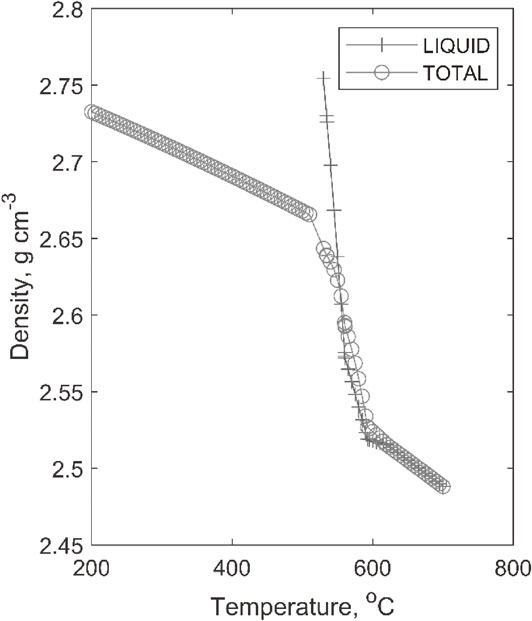
Condition of mushy zone in alloy A.
The amounts of aluminium–copper phases increased considerably due to copper content as compared to Alloy A, Fig. 8. The transformation of aluminium–nickel phase to aluminium–nickel–copper phase is seen for a very brief period here (between 520–515°C). Also, the aluminium–iron–magnesium–silicon phase does not form as occurred in the other alloy. Silicon nucleation temperature remained similar to that for alloy A. However, Alpha phase appeared to form early and may became a heterogeneous site nucleation of other second phases. This, in turn, might favoured the very early (509°C instead of 298°C) formation of Al2Cu phase from the liquid, compared to alloy A. Consequently, phase fraction of Al2Cu phase would increase prominently. Al3Ni2 phase was formed briefly at 527°C and went back to the solution at 522°C. With the presence of more copper this phase seemed to thermodynamically less stable. CALPHAD modelling of alloy B also revealed the amount of liquid present at different temperatures. It was calculated that solidification started at 615.28°C and completed at 509.65°C. Consequently, the solidification range becomes 105.5°C. Apparently, greater amount of copper modified both solidus and liquid temperatures and yielded a higher solidification range. The liquid density increased like before with lowering temperature, but to a greater value of 2.95 g cm−3, compared to 2.75 g cm−3 for alloy A, Fig. 9. The total density is also increased, which is an influence of copper content. Copper in liquid increases to 24 wt% in alloy B, compared to only 14 wt% for alloy A. This explains that the liquid enrichment is mostly caused by copper content.
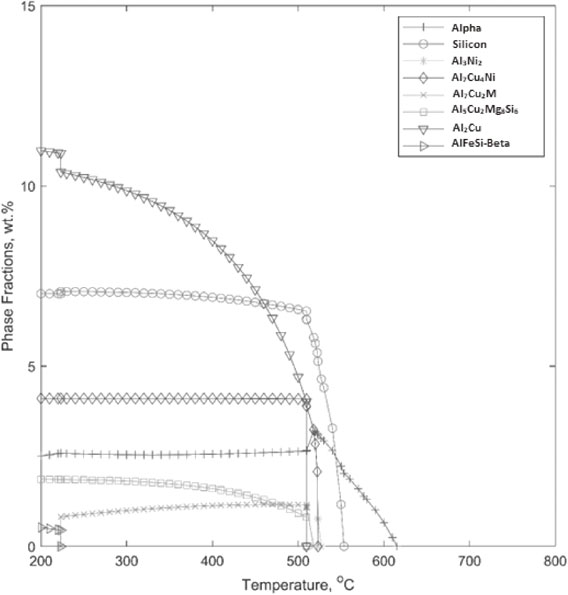
Changes in intermetallic phases in alloy B.
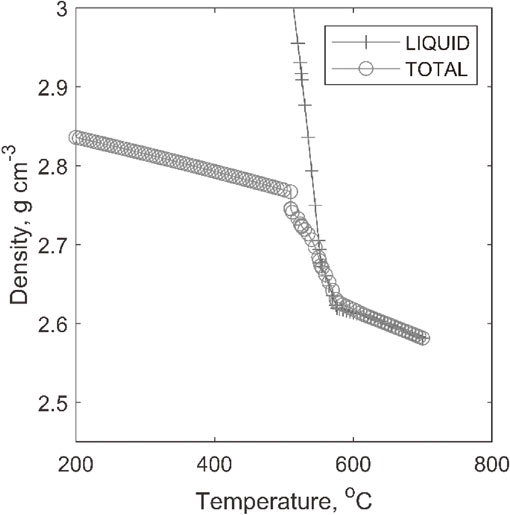
Condition of mushy zone in alloy B.
If all predicted secondary phases in both alloys are compared, it is interesting to note that for alloy A total phases are 18.5%, whereas in alloy B it was 26%, Fig. 10. The major difference is apparent from the Aluminium–copper containing phase. The values here are referring to area fractions of the images. The values are slightly deviated compared to the actual phases present in the microstructure, Fig. 5. Nevertheless, the variation is largely recognized for the efficiency of gray-values selected for the image analysis.

Amounts of secondary phases in alloy A and alloy B.
The hardness value of the alloy A is approximately 28 Rockwell B Scale, which increases significantly to 45 Rockwell B Scale in alloy B due to copper content, Fig. 11. The major difference between alloys A and B is Al2Cu. There are changes in other second phases as well. However, in alloy B, phase fraction of Al2Cu increased significantly. Evidently, the improvement in hardness of alloy B compared to alloy A may thus be attributed to Al2Cu, compared to Al7Cu4Ni or Al5Cu2Mg8Si6 phases.

Effect of copper addition in hardness of alloy A and alloy B.
By cold working of the alloy A, hardness values increased gradually with the increasing amount of reduction, Fig. 12. Cold working of alloy B also produced similar result, Fig. 13.

Effect of cold working in hardness for alloy A.

Effect of cold working in hardness for alloy B.
Homogenization of the alloy B produced gradual increase in hardness after heating at 300°C for 1 and 2 hours. The reason may be due to age-hardening of the alloy. However, it decreased considerably after heating for 4 h, Fig. 14. This might have happened due to over-ageing.
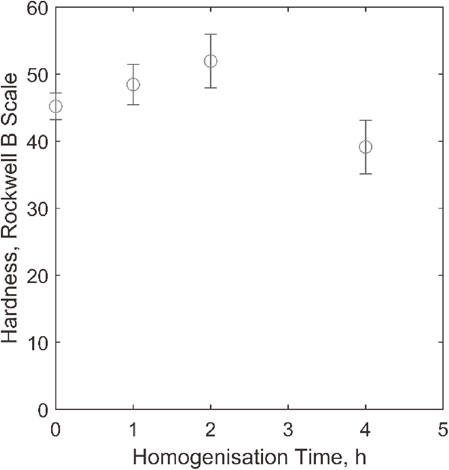
Effect of homogenization in hardness for second alloy.
The change in hardness by homogenization is related to the precipitation of particular phases.12) From single temperature calculation at homogenization temperature (300°C) and room temperature, Al2Cu, Al3Ni2 and alpha phases precipitate out at 300°C, Fig. 15. Thus, up to 1 and 2 h, these phases precipitate and cause hardening because of their finer size and coherency in the matrix, by distorting the crystal lattice and creating resistance to dislocation motion. The number of precipitates increases with increasing time thus increasing the strength of the alloy. However, after 4 h, they become coarse and incoherent in the matrix, which causes decrease in hardness.

Phases of second alloy at 25°C and 300°C.
Two alloys having different copper contents were studied. Thermodynamic modelling of alloys by CALPHAD method predicted greater amount of second phases for the higher copper containing alloys. Presence of copper promoted the stability of Alpha and Al2Cu phases. It was also depicted that in the presence of copper, Alpha phase formed earlier and acted as nucleation site for Al2Cu. Consequently, Al2Cu started to precipitate early around 509°C compared to 298°C in alloy A. Formation of silicon phase was totally undisturbed by the amount of copper present in the microstructure. Al7Cu4Ni and Al5Cu2Mg8Si6 phases were slightly modified in amount with more copper.
The presence of copper lowers the solidus and liquidus temperatures. Addition of copper thus increases the size of mushy zone, enriches the liquid as evident from density calculations and affects segregation and dendrite formation. Homogenisation at 300°C was found to dissolve most phases and form a uniform microstructure. Homogenisation temperature was thus correctly calculated using Thermodynamic modelling CALPHAD method. Homogenisation of the alloy B (higher copper content) instigated the removal of dendrites, and gradual increase in size of the particles and their growth throughout the matrix.
Thermodynamic modelling shows that increase in copper content promotes formation of Al2Cu and alpha phases at 300°C which obviously contributes to the observed higher hardness values. However, with increase of annealing time, diffusion accelerates phase coarsening, which affects dislocation distribution adversely and results in lower hardness values observed.
By cold working, hardness values rise with increased amount of permanent set in both alloys. Such increase is recognised to the increase in dislocation density during cold work.
The authors are grateful to Bangladesh University of Engineering and Technology for providing support for the work.