Mechanics of Materials
Cr Effects on the Local Plasticity Evolution and Fracture Behaviors of Ni–Cr Alloys Tensile-Tested under Hydrogen Charging
2023 年 64 巻 1 号 p. 212-219

詳細
2023 年 64 巻 1 号 p. 212-219
The Cr effects on hydrogen embrittlement behaviors in pure Ni, Ni–20Cr, and Ni–44Cr alloys with similar grain sizes were investigated using tensile tests under electrochemical hydrogen charging and microstructure observations. The relative elongation (defined as elongation under hydrogen charging divided by elongation in air) in the pure Ni was higher and lower than those of the Ni–20Cr and Ni–44Cr alloys, respectively. The behaviors of the hydrogen-charged specimens were as follows. The hydrogen embrittlement susceptibility nonmonotonically varied with an increase in the amount of Cr substitution. The fracture surfaces of the pure Ni and Ni–20Cr alloy showed intergranular fractures, and that of the Ni–44Cr alloy showed a fully ductile feature. Post-mortem electron backscattered diffraction analyses revealed that grain reference orientation deviation (GROD) values, which correspond to local plasticity-induced lattice distortions, were high around grain boundary triple junctions, and the maximum value in the pure Ni at the grain boundary triple junction (18°) was nearly the same as that of the Ni–20Cr alloy (17°), although the total elongation of the pure Ni was twice that of the Ni–20Cr alloy. This result indicated that Cr addition promoted the plasticity-induced local stress evolution associated with dislocation pile-up. Moreover, the maximum GROD value of the pure Ni near the fracture surface was 56°, which is considered to be the critical level for plasticity-induced cracking in pure Ni. Interestingly, the Ni–44Cr alloy showed a similar GROD value (55°) even in the uniformly deformed portion of the fractured specimen, while showing ductile fracture and no cracks in the fractured specimen. This result indicated that the Ni–44Cr alloy had higher grain boundary strength than that of the pure Ni even after hydrogen charging.
This Paper was Originally Published in Japanese in J. Japan Inst. Met. Mater. 86 (2022) 77–84.
The use of hydrogen has been noted to achieve sustainable development goals. In this context, hydrogen embrittlement fracture, which occurs in metallic structural components exposed to a hydrogen environment, is regarded as a consequential problem in the development of hydrogen energy-based infrastructures. In this regard, crystallographic structure is the primary factor in the resistance to hydrogen embrittlement in metallic materials. In particular, the hydrogen embrittlement susceptibility of face-centered cubic (FCC) metals is lower than that of body-centered cubic (BCC) metals. Therefore, austenitic stainless steels have attracted attention as hydrogen-resistant ferrous alloys. However, a group of austenitic steels such as SUS304 exhibits deformation-induced martensitic transformation. When the deformation-induced FCC-BCC martensitic transformation occurs, the BCC martensite is more susceptible to hydrogen than the pre-existing BCC phase. Specifically, the BCC martensite takes over a large amount of hydrogen from austenite with a high solubility of hydrogen, which enables distinct hydrogen embrittlement.1,2) That is, the hydrogen embrittlement susceptibility significantly decreases with increasing austenite phase stability. The compositional effect on austenite phase stability can be comprehensively expressed by the equivalent Ni concentration (Nieq).3,4) Figure 1 shows the relative reduction in area (R.R.A.), which is defined as R.A. with hydrogen divided by R.A. without hydrogen, plotted against Nieq.5) The hydrogen embrittlement resistance increased with increasing austenite stability, and SUS316L (with no martensitic transformation until fracture) did not suffer from the hydrogen effect under the experimental conditions, as shown in Fig. 1.
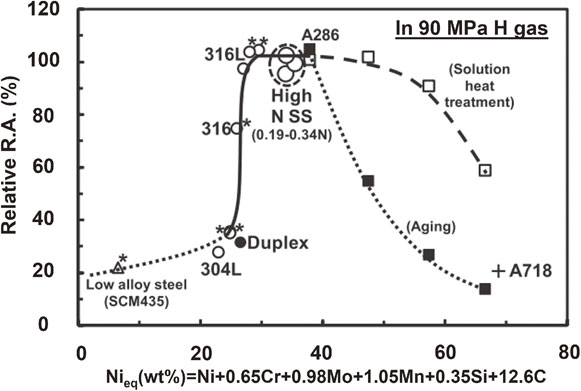
Hydrogen embrittlement susceptibility plotted against Ni equivalent.5) A286, A718, and alloys with Nieq over 40% are Ni-based alloys.
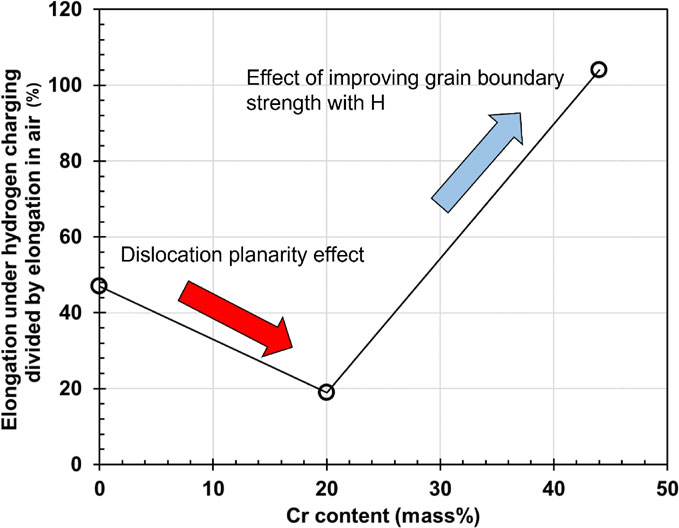
However, Ni-based superalloys and A718, which have high stability of the FCC phase, have been reported to exhibit hydrogen embrittlement. As shown in Fig. 1, hydrogen embrittlement occurs even when all alloying elements of the Ni-based alloys are in the solid solution state. This result indicates that the compositional dependence of hydrogen embrittlement resistance cannot be fully understood only by the effect of phase stability. The roles of hydrogen in the embrittlement as an additional factor have been discussed through various mechanisms, such as hydrogen-enhanced lattice decohesion,6,7) hydrogen-enhanced localized plasticity,8,9) and hydrogen-enhanced strain-induced vacancy formation,10,11) which are still under debate. However, even without considering the complex hydrogen effect, the hydrogen embrittlement resistance can be predicted and designed based on the material properties without hydrogen. More specifically, grain boundary strength and the dislocation planarity are the material properties primarily related to hydrogen embrittlement resistance. Grain boundary strength is crucial for explaining the hydrogen embrittlement in stable austenitic steels such as high-Mn steels.12,13) Dislocation planarity is an intrinsic factor controlling the stress concentration at the grain boundaries associated with the dislocation pile-up. Basically, the fracture is controlled by the interface strength, stress concentration on the fracture path, and localized plasticity-driven shear failure. Therefore, when the addition of alloying elements decreases the resistance to hydrogen embrittlement in an FCC alloy, we must consider an increase in the dislocation planarity as well as a reduction in the interface strength. In the Ni–Cr and Ni–Cr–Fe alloys, an increase in the Ni content increases hydrogen embrittlement susceptibility.14) When hydrogen embrittlement stems from an intergranular fracture, the primary factor causing hydrogen embrittlement of the Ni-based alloys is a reduction in grain boundary strength, because Ni addition decreases the dislocation planarity. On the other hand, an addition of Cr to Ni alloys increases the dislocation planarity,15,16) which enhances the stress concentration at grain boundaries. Therefore, excessive additions of Ni and Cr in FCC alloys can decrease their resistance to hydrogen embrittlement.
Pure Ni is the simplest chemical composition of FCC metals and alloys that consist of combinations of Fe, Cr, and Ni as the major alloying elements in stainless steels. Therefore, pure Ni is a primarily important material for examining the factors controlling the hydrogen embrittlement susceptibility of austenitic stainless steels and Ni alloys. The stacking fault energy (SFE) of pure Ni is 120–130 mJ m−2,17) which is two or three times higher than that of austenitic stainless steels such as SUS310S and SUS316L.18,19) It means that the dislocation planarity of pure Ni was low. However, the reduction in grain boundary strength by the presence of Ni can cause hydrogen embrittlement even in pure Ni. Similarly, the hydrogen embrittlement susceptibilities of Ni–Cr and Ni–Cr–Fe alloys have been reported to increase with increasing Ni content.20) Conversely, replacing Ni by Cr decreases the SFE15) and enhances the contribution of short-range ordering,21,22) which increases the dislocation planarity. However, the effect of Cr on hydrogen embrittlement susceptibility is not monotonic with respect to Cr content. A Ni–20Cr alloy (hereafter, the chemical composition is given in mass%) shows higher hydrogen embrittlement susceptibility than that of pure Ni. A further increase in Cr content decreases the hydrogen embrittlement susceptibility.14,23) In a previous study,24) the increase of hydrogen embrittlement susceptibility by the addition of 20% Cr to pure Ni was investigated from the viewpoint of grain boundary strength and stress concentration at grain boundaries. Specifically, the effects of 20%Cr-enhanced dislocation planarity on hydrogen embrittlement were analyzed using pure Ni and Ni–20Cr alloy specimens with different grain sizes because grain size alters the local stress at grain boundaries.24)
The grain refinement improved the hydrogen embrittlement resistance in the Ni–20Cr alloy with a relatively low SFE, but not in the pure Ni. The improvement of hydrogen embrittlement resistance has been reported in twinning-induced plasticity steels, which are known as a low SFE material.25,26) According to previous studies,27,28) grain refinement suppresses the stress concentration associated with the planar dislocation pile-up, which significantly improves the hydrogen embrittlement resistance. The effect of the dislocation pile-up at the grain boundaries is crucial in the Ni–20Cr alloy because a distinct planar dislocation slip occurs owing to the effects of low SFE and short-range ordering. Therefore, the Ni–20Cr alloy showed a remarkable effect of grain refinement on reducing the stress concentration and associated improvement of the hydrogen embrittlement resistance.24) The remaining issues are as follows: (1) A comparison of hydrogen embrittlement susceptibility between pure Ni and Ni–20Cr alloy with an identical grain size is required because there was a significant difference in the grain size between the two metal/alloys in the previous study owing to the difference in grain boundary mobility; (2) The mechanism of the improvement of hydrogen embrittlement resistance by Cr content over 20%,17,18) which is contrary to the case of Cr content at and below 20%, must be clarified. To solve these two issues in this study, based on previous studies, we investigated the hydrogen embrittlement resistance and the associated microstructure evolution in Ni–Cr alloys with a similar grain size when the Cr content was in a range from 0 to 44%.
In this study, commercially pure Ni (JIS H4552), Ni–20Cr alloy, and Ni–44Cr alloy were used. Their chemical compositions are listed in Table 1. The Ni–20Cr and Ni–44Cr alloys were prepared through casting. The samples were heated at 1100°C for 3 hours and subsequently hot-forged to a thickness of 60 mm, a width of 120 mm, and a length of 200 mm. The forged samples were re-heated at 1100°C for 1 hour and subsequently hot-rolled to a thickness of 20 mm, a width of 150 mm, and a length of 480 mm. After hot rolling, the bars were solution-treated at 1100°C for 1 hour, which was followed by water quenching. The Ni–44Cr tensile specimens were obtained from the solution-treated bar. The pure Ni and Ni–20Cr alloy bars were further cold-rolled to a 93% reduction in thickness. The plates were cut via spark machining to produce dog-bone-type tensile specimens with gauge dimensions of 1.2 mm in thickness, 4 mm in width, and 10 mm in length (total length including grip sections was 65 mm). The pure Ni and Ni–20Cr specimens were recrystallized through annealing at 1000°C for 30 minutes and 1100°C for 30 minutes, respectively. The recrystallized specimens were subsequently water-quenched. After the heat treatments, all alloys were confirmed to consist of a single FCC phase. Figure 2 shows the initial microstructure (backscattered electron image) of the heat-treated specimens. The Ni–20Cr and Ni–44Cr alloys exhibit numerous annealing twin boundaries. The average grain sizes, including the annealing twin boundaries, were measured using an interception method with micrographs, as listed in Table 2. Although the grain size of pure Ni is larger than that of the others, the intergranular stress concentration owing to the dislocation pile-up depends on the square root of the grain size. Therefore, there is only a small difference in the square root of the grain sizes because the values of the pure Ni, Ni–20Cr alloy, and Ni–44Cr alloy were 11, 8, and 9 µm1/2, respectively.

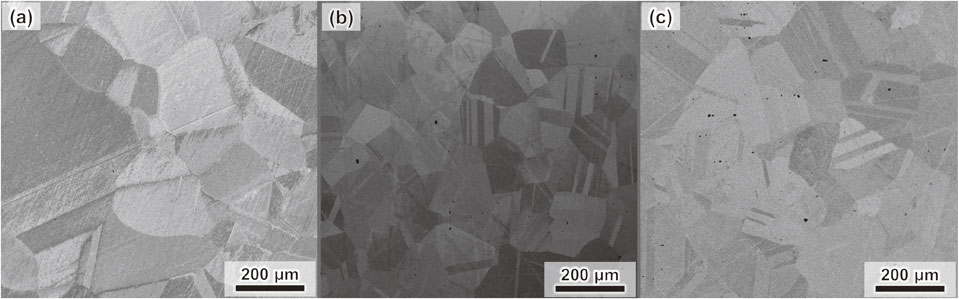
As-annealed microstructures (backscatter electron images) of the (a) pure Ni, (b) Ni–20Cr alloy, and (c) Ni–44Cr alloy.

Tensile tests were performed at an ambient temperature at an initial strain rate of 1 × 10⁻⁴ s−1. Hydrogen was introduced through electrochemical charging during the tensile testing24) at 10 A m−2 in a 3 mass%NaCl aqueous solution. Hydrogen charging was initiated when the tensile tests were initiated. The strains in the tests in air were measured using a video extensometer. Strains in the test under hydrogen charging were calculated from the crosshead displacement. This displacement was based on a regression equation obtained using an approximation curve (second polynomial function) for the relationship between the strain and crosshead displacement in air.
2.3 Microstructural and fractographic observationsAfter the tensile tests, the specimens were rinsed for fractographic observations through scanning electron microscopy at an acceleration voltage of 15 kV. To analyze the microstructure and local plasticity, electron backscatter diffraction (EBSD) measurements were conducted on the fractured specimens at an acceleration voltage of 20 kV, probe current of 10 nA, and a working distance of 15 mm with a beam step size of 0.2 µm. The specimens used for the EBSD measurements were mechanically polished. The final polishing was performed using colloidal silica with a particle diameter of 60 nm.
Figure 3 shows the stress-strain curves of the respective alloys. The total elongation of the hydrogen-charged pure Ni was 23%, which was half that of the uncharged specimen (Fig. 3(a)). When 20%Cr was added, the total elongation decreased to 10%, which is one-fifth that of the uncharged Ni–20Cr alloy (Fig. 3(b)). That is, the addition of Cr remarkably increased the hydrogen embrittlement susceptibility even with the same grain size.
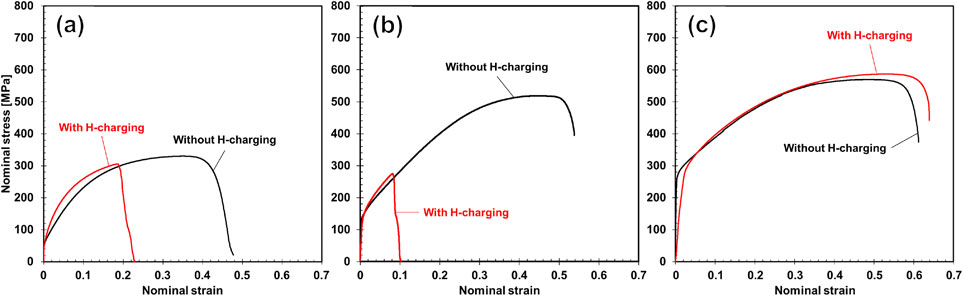
Nominal stress-strain curves of the (a) pure Ni, (b) Ni–20Cr alloy, and (c) Ni–44Cr alloy.
Additionally, a further increase in the Cr content to 44% did not result in hydrogen embrittlement, and the alloy showed fracture after cracking, as shown in Fig. 3(c). According to a previous study,24) an increase in Cr content decreases the SFE and enhances short-range ordering, which assists stress concentration at grain boundaries and the associated intergranular fracture. However, the addition of Cr simultaneously increased the grain boundary strength, thereby improving the hydrogen embrittlement resistance at a significantly high Cr content. Compared to the SFE reduction by the addition of 20%Cr to pure Ni, a further increase in Cr content from 20% shows only a slight reduction15,29) or does not decrease the SFE.30) Therefore, in terms of the SFE, the difference in the degree of stress concentration at the grain boundaries between the pure Ni and Ni–20Cr alloy is smaller than that between the Ni–20Cr and Ni–44Cr alloys. Accordingly, the effect of enhancing the grain boundary strength appeared distinctly in the macroscopic mechanical behavior when the Cr content exceeded 20%. Consequently, the comparison of the hydrogen embrittlement susceptibilities of the three alloys revealed the underlying Cr effect as discussed above. To support the discussion, we report the results of fractographic and microstructural analyses.
3.2 Comparison of the fractographic featuresFigure 4 shows fractographs of the uncharged specimens of the respective alloys. All the specimens show necking and typical ductile feature involving dimples. Conversely, the hydrogen-charged pure Ni showed intergranular and quasi-cleavage fracture features (Fig. 5(a)). Although the corners of the specimen – a plausible site of crack initiation – showed an intergranular feature (Fig. 5(a′)), a significant area fraction of quasi-cleavage fracture surface was also observed (Fig. 5(a′′)). Plasticity-related traces were observed on the surfaces of both the intergranular and quasi-cleavage fractures. This is the same feature as that observed in the previous study,24) which indicates crack tip blunting.
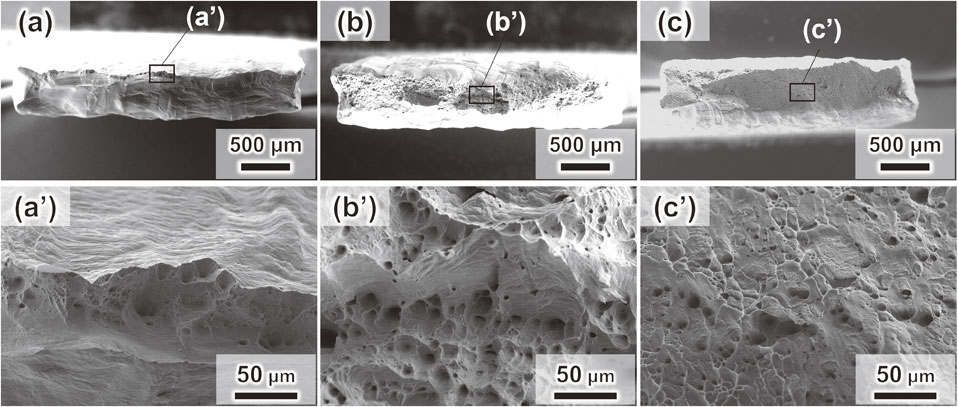
Fractrographs with different magnifications obtained in the uncharged specimens of (a), (a′) pure Ni, (b), (b′) Ni–20Cr alloy, and (c), (c′) Ni–44Cr alloy.
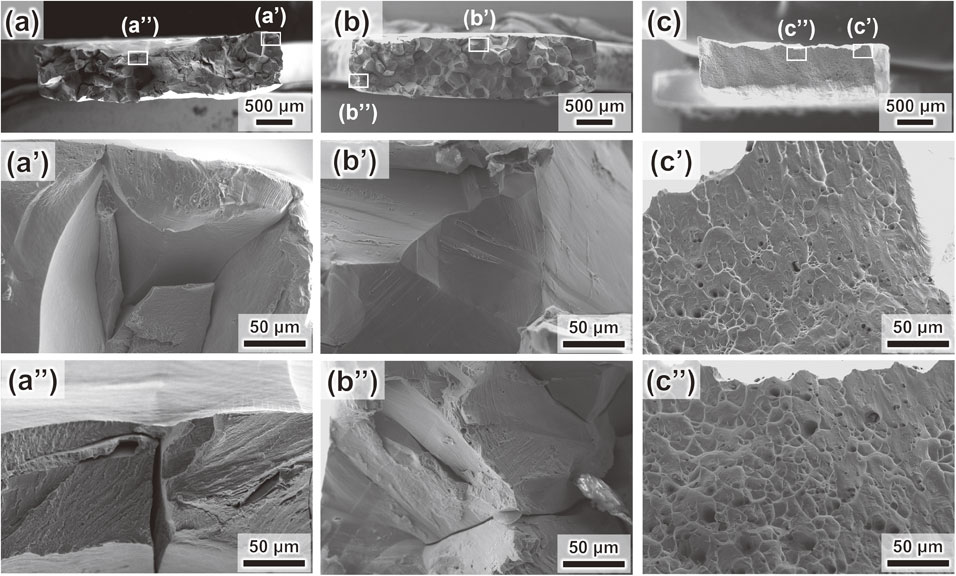
Fractrographs with different magnifications obtained in the hydrogen-charged specimen of (a), (a′), (a′′) pure Ni, (b), (b′), (b′′) Ni–20Cr alloy, and (c), (c′), (c′′) Ni–44Cr alloy.
In contrast, a major portion of the fracture surface of the Ni–20Cr alloy showed intergranular features (Fig. 5(b)) and linear shallow traces (Fig. 5(b′)). Non-intergranular features were also rarely observed (Fig. 5(b′′)), which can result from the coalescence of multiple cracks. These fractographic features of the pure Ni and Ni–20Cr alloy were similar to those observed in a previous study with different grain sizes.24)
Hydrogen charging in the Ni–44Cr alloy did not result in a significant change in the fractographic features. The specimen showed distinct necking (Fig. 5(c)), and the fracture surface was fully covered with dimples in the corner (Fig. 5(c′)) and other portions (Fig. 5(c′′)). That is, the hydrogen in the Ni–44Cr alloy had almost no impact on the stress-strain response and fracture behavior. Additionally, a quasi-cleavage fracture feature, which was observed in pure Ni, did not appear. This indicates that the addition of Cr suppressed the plasticity-driven cracking on a specific crystallographic plane, although the suppression mechanism of the quasi-cleavage fracture is unclear. In the next section, we present the analysis results of the crystallographic orientation gradient to discuss the dislocation planarity-related stress concentration near the grain boundaries.
3.3 Comparison of microstructure and local plasticity in pure Ni and Ni–20Cr alloyThe increase in the local stress near the grain boundaries is a crucial factor in causing the hydrogen-induced intergranular fracture. Figure 6 shows the grain reference orientation deviation (GROD) map around the grain boundary triple junction in the fractured specimen. The GROD is the difference in crystallographic orientation at an arbitrary point from the average orientation of each grain, which increases with increasing plastic strain.31–33) Additionally, the formation of a long-range stress field arising from the dislocation pile-up induces a higher GROD than that without the dislocation pile-up at an identical dislocation density. As shown, the GROD values were high near the grain boundaries. Regions near the grain boundary triple junctions showed significantly high GROD values owing to elastic misfit. Compared to the results for pure Ni, the average GROD value in the Ni–20Cr alloy was low, and the area where high GROD values appeared was small (Fig. 7). This was attributed to the lower elongation of the hydrogen-charged Ni–20Cr (10%) than that of the hydrogen-charged pure Ni (23%), as summarized in Table 3. However, the most important parameter is the maximum value because cracking occurs at the weakest location. The maximum GROD value in this measurement was 18° for the pure Ni and 17° for the Ni–20Cr alloy, which indicates that there is no significant difference in the maximum GROD values between the two specimens. Additionally, a high GROD value of approximately 17° in the Ni–20Cr alloy was observed only near the grain boundary. The similar maximum GROD value with the lower macroscopic strain (uniform elongation) in the Ni–20Cr alloy (compared to that of pure Ni) is considered to arise from the higher dislocation planarity. According to a previous report,21) the addition of Cr over 10% increases dislocation planarity in the Ni–Cr binary system, which supports that the high maximum GROD value in the Ni–20Cr alloy is attributed to high dislocation planarity. That is, as discussed in the previous study24) and the previous section, the addition of 20Cr suppressed cross slip owing to a reduction in the SFE and short-range ordering, which enhanced stress concentration at grain boundaries owing to the dislocation pile-up. The dislocation-driven local stress can act as a driving force for crack formation. Because the local stress at the grain boundary reached the critical value for cracking and fracture earlier in the Ni–20Cr alloy, the total elongation was lower than that of pure Ni.
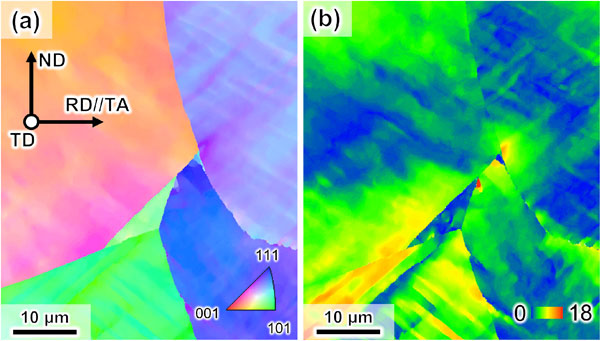
(a) Rolling direction (RD // tensile direction axis)-inverse pole figure (IPF) map and (b) grain reference orientation deviation (GROD) map at a region including a grain boundary triple junction in the hydrogen-charged pure Ni. The nearest grain boundary triple junction to the fracture surface was selected. The total elongation of the specimen is 23%. The maximum GROD value is 18°.
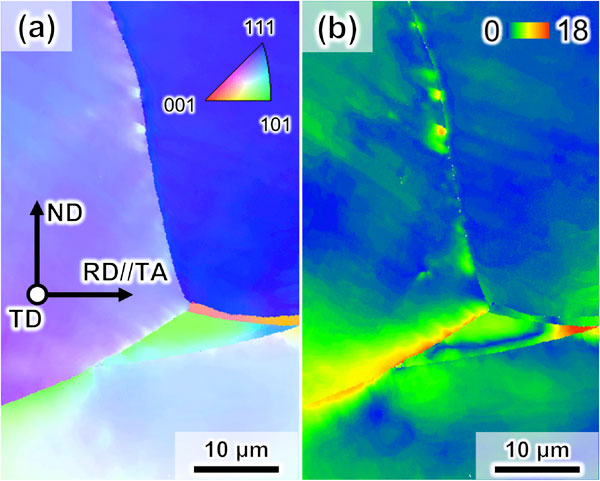
(a) RD-IPF map and (b) GROD map at a region including a grain boundary triple junction in the hydrogen-charged Ni–20Cr alloy. The nearest grain boundary triple junction to the fracture surface was selected. The total elongation of the specimen is 10%. The maximum GROD value is 17°.

Here, we note the microscopic behavior of the Ni–44Cr alloy. Figure 8 shows a GROD map of the hydrogen-charged pure Ni in the region near the fracture surface where the maximum plastic strain occurs. The GROD values near the fracture surface were higher compared to those in the uniformly deformed region shown in Fig. 6, and the maximum value was 56°. The maximum value can be regarded as the critical GROD (dislocation-driven stress concentration) required for hydrogen-assisted cracking at the strongest grain boundary in the fracture path of the pure Ni specimen. Figure 9 shows a GROD map of the uniformly deformed portion of the fractured hydrogen-charged Ni–44Cr alloy specimen. The maximum GROD value near the grain boundaries was 55° (even in the uniformly deformed region), which is comparable to that of the maximum GROD value near the fracture surface of the pure Ni (56°). However, no cracks were observed (even in the high GROD region), and the fracture behavior was fully ductile, as exhibited in Section 3.2. Thus, although the local stress at grain boundaries increases with increasing Cr content, the grain boundary strength of the Ni–44Cr alloy is sufficient to resist the high local stress. That is, the substitution of Ni with Cr increases the grain boundary strength. These results support the interpretation of the effect of Cr on hydrogen-assisted intergranular fractures in a previous study.24) Furthermore, for the effect of Cr on the grain boundary strength, the following specific factors can be considered:
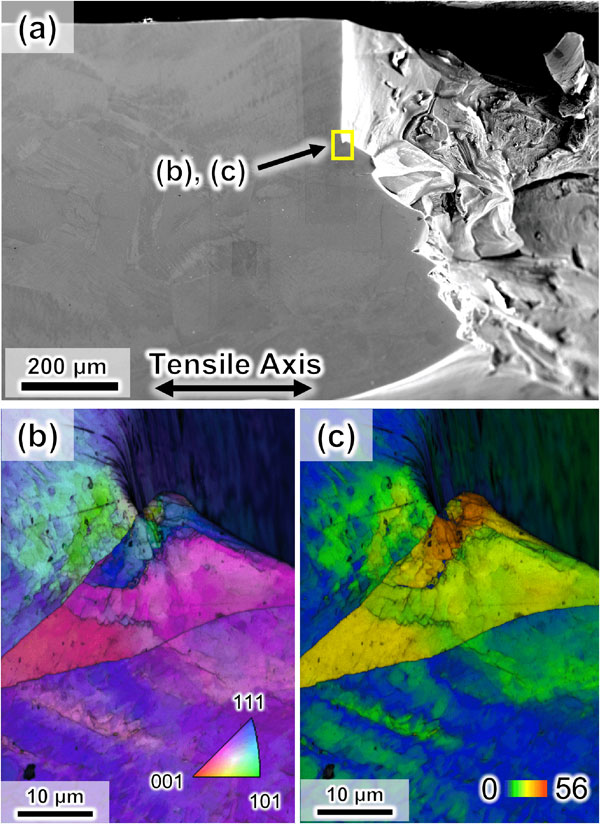
(a) Secondary electron image showing the observation region of (b), (c). (b) RD-IPF and (c) GROD maps in the region where the maximum GROD values appeared in the hydrogen-charged pure Ni. The maximum GROD value is 56°.
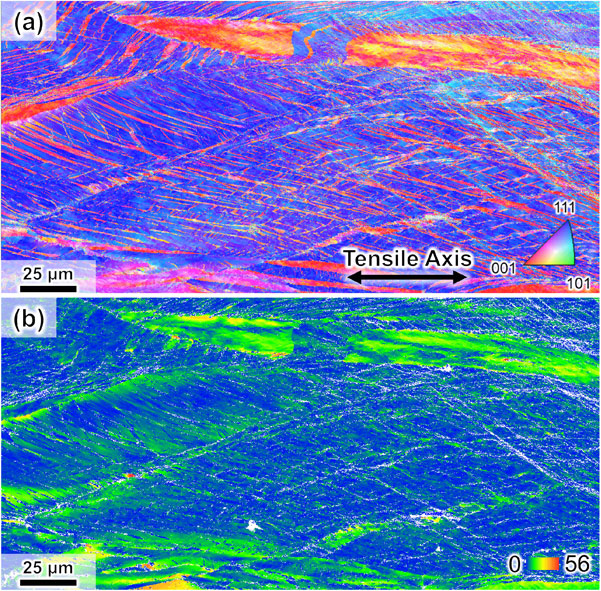
(a) RD-IPF and (b) GROD maps in the uniformly deformed region of the hydrogen-charged Ni–44Cr alloy. The maximum GROD value is 55°.
In this study, pure Ni, Ni–20Cr alloy, and Ni–44Cr alloy with similar grain sizes were prepared to comparatively investigate their hydrogen embrittlement behavior and the associated microstructure evolution. Particularly, we aimed to clarify the following Cr effects: (i) increase in grain boundary strength and (ii) increase in the local stress at grain boundaries. The results and insights obtained are presented below:
This work was financially supported by JSPS KAKENHI (JP20H02457).