Abstract
The Al–Si–Mg casting alloy was modified by strontium, and the microstructural classification of unmodified and Sr modified samples was accomplished by using our originally developed methods and machine learning techniques. The classification rates of unmodified and modified samples were at high levels and the highest rate reached 97.5% accuracy when using statistical data and the support vector machine as the classifier. The additive of Sr caused the distribution of eutectic-Si particles to change from a random distribution to a clustering arrangement, and decreased the particle size of eutectic-Si. The tensile properties of the alloy were significantly increased after modification due to the refinement of the eutectic-Si phase.
1. Introduction
In recent years, reducing vehicle weight has become increasingly important based on legislation and environmental pressures on the automotive industry, which increasingly requires the production of lighter, more fuel-efficient vehicles with lower emissions. Al–Si casting alloys have been used commercially to produce important components such as engine blocks because of their high strength-to-weight ratio, excellent castability and corrosion resistance, and especially good mechanical properties under heat treatment conditions.1) High fatigue strength and good wear resistance are key properties for the life of engine blocks. Eutectic silicon particle size and morphology are thought to have an important influence on fatigue crack expansion behavior, and finer eutectic silicon particles are effective in improving fatigue crack expansion resistance.2)
The eutectic Si in untreated cast Al–Si alloys is usually in a plate-like morphology and coarse. Among the various methods to refine the size and morphology of eutectic Si, modification of cast Al–Si alloys by additive of modification elements is a common and easy to implement method, and has been widely used in industrial production for a long time.3) Many modifier elements such as Sb,4–6) Sr,7–12) Y13) and rare earth elements (Eu, Nd, Yb, etc.)14–16) have been shown to refine and improve the eutectic silicon phase in Al–Si casting alloys. Sr is one of the most commonly used modifiers, and the addition of Sr results in a fully modified fibrous eutectic-Si morphology.17)
Due to the effect of the modification on the eutectic silicon, the microstructures of the Al–Si alloy changes after the modification, which will eventually lead to changes in the mechanical properties of the alloy. Microstructural analysis is one of the most important parts in materials science. With the development of computer technology, more image analysis methods are available for microstructural analysis, which can significantly improve the efficiency of the process. In the present study, machine learning techniques were used to classify the microstructures of Al–Si–Mg alloys before and after Sr modification, and our original developed methods were used to quantitively analyze the size and distribution of eutectic silicon in the matrix of the alloys before and after modification, and we also tried to relate these features, which represent the characteristics and distribution of the second phase, to the mechanical properties of the material.
2. Experimental
The material used in this experiment was Al–7%Si–0.3%Mg (mass%) casting alloy, and the alloy was modified with 0.01% and 0.02% (mass%) Sr by adding a certain amount of Al–10%Sr (mass%) master alloy. The molten alloy was well stirred and injected into a copper mold heated to 140 degrees Celsius and cooled naturally to room temperature in air, and the measured cooling rate was 5 K/s. The samples were rectangular in shape, and the core of the middle section of the casting was taken and cut into rectangles with a cross-section of about 10 × 10 mm for subsequent microstructure photography and mechanical property testing.
The cross section of the unmodified and modified samples was polished with waterproof abrasive paper and diamond grinding paste to observe the microstructure, and several microstructure photographs with 500× magnification were taken with an optical microscope for machine learning and classification. The resolution of each image was 1280 × 960 pixels.
2.1 Machine learning process
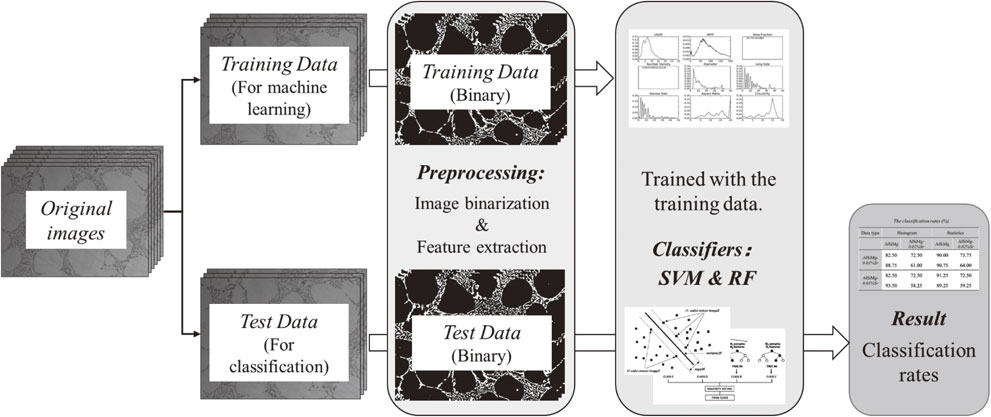
The machine learning process was shown in Fig. 1. The image data will be randomly divided into 2 parts, one part for training, and the other part for test. The original images will be turned into binary images though brightness adjustment, filtering and thresholding. Next, we use our software to measure various features that represent the morphological structure and distribution of second-phase particles on the binary images. The program detects the center of gravity, area, perimeter, and circumferential rectangle of each second-phase particle automatically, and measures the IMFP (image mean free path) and the LN2D (2-dimensional local number) of each image. IMFP and LN2D are our originally developed methods to quantitatively analyze the distribution of second phase particles.
LN2D is a statistical method that abstracts all second-phase particles as points (gravity centers) on a two-dimensional plane (alloy matrix) and characterizes the uniformity degree of dispersion of second-phase particles by measuring the number of gravity centers in a circle with a large number of statistics. The radius of the measuring circle is given by eq. (1):18)
| \begin{equation}
\frac{7}{\pi R_{2D}^{2}} = \lambda_{A} \to \left(\frac{7}{\pi \lambda_{A}}\right)^{1/2} {}= \frac{1{,}493}{\lambda_{A}^{1/2}},
\end{equation}
| (1) |
where λ
A is the number density of all particles. It has two types of measurement including LN2D and LN2DR (LN2D random), according to whether the location of the measurement circle is chosen as an arbitrary center of gravity center or a random point. The variance of LN2DR was used as one of the features in this work.
The IMFP calculates the displacement from a random position in the alloy matrix until it encounters the obstruction of the second phase particles, which is using image mean free path to roughly simulate the pinning effect of the second phase particles on the dislocation slip in dislocation motion. It has been concluded in our previous study19) that in Al–Si alloys, the tensile properties of the material are inversely proportional to the IMFP value, which means a lower value of IMFP will lead to higher tensile performance.
After the preprocessing, the data of extracted features, including histogram data and statistical data, will be used to train the model and a classifier will be used for the classification. Histogram data is the relative frequency of the features, while statistical data is average values and standard deviation of the features. Two kinds of classifiers, SVM and random forest, were used in this work. Finally, we derive the accuracy of the classification by counting the number of correct ones in the test data as a percentage of the total.
2.2 Mechanical properties test
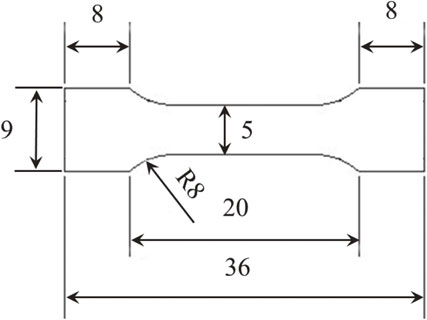
The tensile tests were carried out by a Shimadzu tensile testing machine with a load of 1000 kgf at a stretching speed of 0.5 mm/min. The dimensions of the tensile specimen are shown in the Fig. 2, which is a sheet tensile specimen with a thickness of 1 mm along the length of the rectangular specimen.
3. Results and Discussions
3.1 Microstructures
The Fig. 3(a), (c) and (e) shown the microstructures of unmodified, 0.01% Sr and 0.02% Sr modified samples taken by optical microscopy in the magnification of 500 times, respectively. It could be noticed that more large areas of eutectic Si structures and finer eutectic Si particles could be found in the microstructures after modification. And the micrographs of the samples after binarization were shown in the Fig. 3(b), (d) and (f), respectively. The black part of the binarized image was the aluminum matrix, and the white part was the second phase. It could be seen that the binarized image reproduced the morphological details of the second phase particles and their distribution in the matrix relatively well, which can extract feature quantities from binary images to describe the microstructural features more accurately.
3.2 Classification
In our previous work,20) we have concluded that 60–80 images using for training was suitable for this kind of material in machine learning process. More images in training data will spend more time on learning, especially on feature extraction process, which will lead to a decrement of machine learning efficiency.
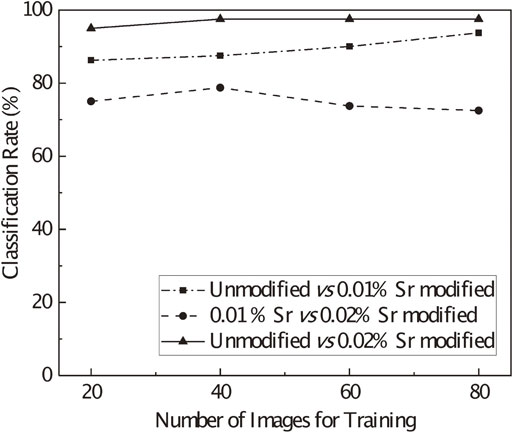
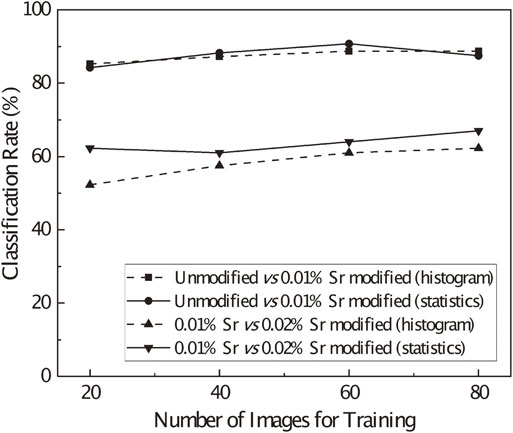
The classification rates change of unmodified and Sr modified samples with number of images for training was tested, the number of which increased from 20 to 80. The results of random forest were shown in Fig. 4. It could be noticed that the data type (histogram or statistics) didn’t have much effect on the accuracy, while the classification rates were increased with more images for training. It can be concluded that 60 was a suitable number for training to get the highest accuracy and efficiency. Therefore, the classification rates of modified samples were much lower than the rates between unmodified and modified ones. Classification rates of unmodified and modified samples reached 85% to 90% accuracy, but the rates of modified samples only reached 60% to 70% accuracy. The similarity of morphology and distribution of eutectic Si phase in the modified samples lead to no large difference of the features, which may be the reason caused the low accuracy of classification. The results of SVM when using the statistical data was shown in Fig. 5. The accuracy of 0.01%Sr modified and unmodified samples was still around 85% to 90%, but the classification rates of 0.02%Sr modified and unmodified samples reached the highest level in all the classification results.
In order to more clearly compare the results obtained using the two classifiers, the classification results using 60 images for training were listed in Table 1. Although the classification accuracy of modified samples had increased when using SVM as classifier, it was still the lowest. The accuracy of classification between 0.01%Sr modified and unmodified samples slightly increased when using Random Forest as classifier, compared to the SVM results. Notably, when using statistical data, the SVM achieved an impressive 97.5% classification rate for unmodified and 0.02%Sr modified samples, which was the highest in all the classification results.

Table 1 The classification rates of the classifiers using different types of data, when using 60 images for training (%).
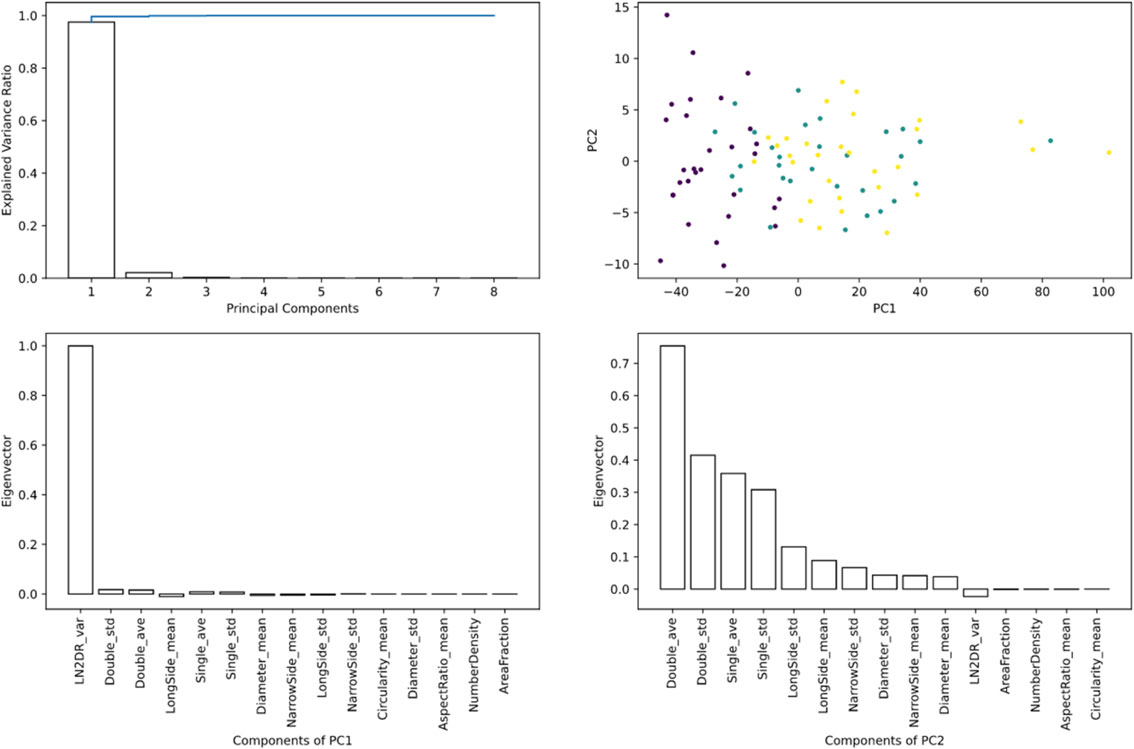
The results of PCA (principal component analysis), the goal of which is to extract the most important information from the data table, were shown in Fig. 6. The results of PCA shown that LN2DRvar (Variance of LN2DR) was the first principal component during the classification. This indicated that the spatial distribution of the second phase particles has an important effect on differentiating the microstructures of the samples before and after the modification. This is also consistent with previous observations on microstructural images.
Therefore, we used the training data to measure the values of LN2DRvar for the three samples. Considering the effect of the modification on the refinement of the second-phase particles, we also measured the average values of Diameter, which is the equivalent circle diameter of the second phase particle, representing the particle size of eutectic Si in samples. The values of LN2DRvar and average values of Diameter of the samples were shown in the Fig. 7. It could be easily found that the values of LN2DRvar were increased with more additive of Sr.
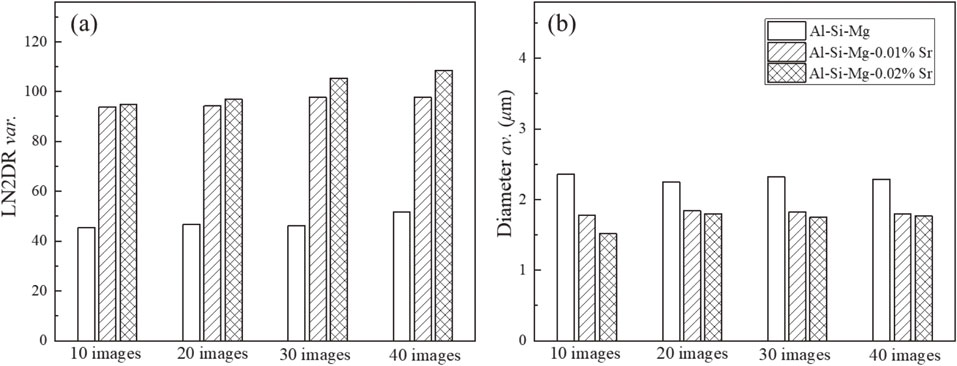
Sr modification significantly increased the value of LN2DRvar, resulting in a large difference between the unmodified and modified samples. In contrast, for the modified samples, although the value of LN2DRvar increases with more Sr additions, the overall difference is not significant, which leads to a lower level of classification rates for the modified samples. Besides, it can be found that this difference increased with the number of images used for measurement, and since LN2DRvar was the first principal component during the classification, this could be the reason for the increment in classification accuracy with the increase in the number of images used for training.
From the measurement results of the Diameter average, it can be noticed that the modification did refine the size of the second phase particles, but the average size difference before and after the modification was less than one micron, which is too small compared to the huge difference that appears in the values of LN2DRvar, so the contribution of the feature values representing the size of the second phase particles to the classification is very small.
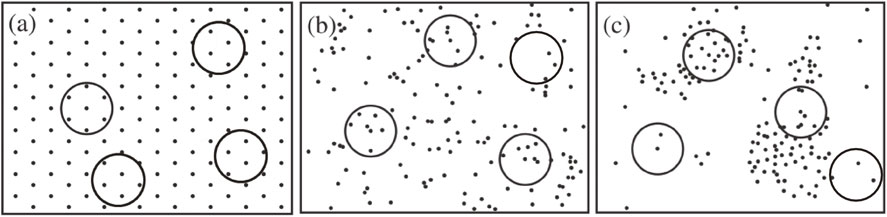
Usually there are 3 kinds of 2-dimensional arrangement types of the gravity centers,21) the schematic diagram of which were shown in Fig. 8. During the measurement of LN2DR, the measurement circle will be located at a random point of the image, while the measurement will repeat at least 1000000 times. The average value of LN2DR is always 7, and a lower variance value of which indicates a more uniform particle distribution. Figure 8(a) is a hexagonal closest ordering, that the distribution of particles is perfectly uniform, and in this situation, the value of LN2DRvar is about 0.5. And then the random distribution and clustering arrangement. The LN2DRvar value of clustering arrangement is higher than that of random distribution. It was found that the modification made the arrangement of the eutectic-Si particles from random to clustering distribution, which lead to an increment of LN2DRvar value.
3.3 Tensile properties
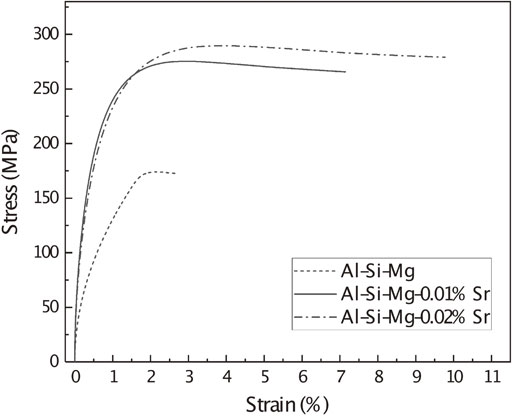
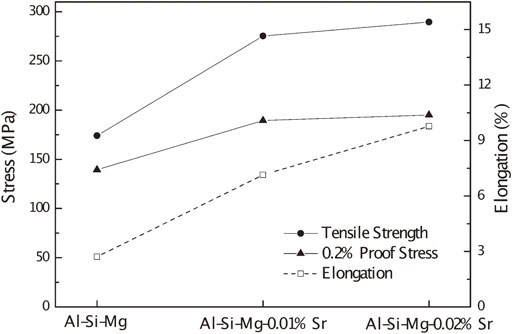
The stress-strain curves of the samples were shown in Fig. 9. After the modification, the tensile properties of the alloy were significantly increased. The tensile strength, 0.2% proof stress and elongation of the samples were shown in Fig. 10. All of these properties increased with more addition of Sr. The tensile strength increased over 100 MPa, and 0.2% proof stress increased about 50 MPa after modification. Besides, the elongation of the samples was even two to three times higher than before the modification. It indicated that Sr modification not only improved the tensile properties of the Al–Si–Mg casting alloy, but also greatly increased the ductility of the alloy, which is a greater advantage than work-hardening and other strengthening methods.
3.4 Correlation between microstructural features and tensile properties
A database system that we are developing to integrate data from the processing parameter, microstructural features and properties of materials, with all the functionality previously developed, was used attempting to find a possible relationship between microstructural features and mechanical properties. Figure 11 shown the correlation matrix for each parameter in this work. It was found that there was a strong correlation between LN2DRvar to tensile properties, whose correlation rate was 0.7 of 1.0, and the correlation rate between mean of Diameter and tensile properties was 0.5 of 1.0. The minimum and average values of Diameter were negatively correlated with the tensile properties, which means that the finer the size of the second phase can improve the tensile properties of the alloy. The role of Sr modification is to refine the eutectic silicon phase to improve the mechanical properties of the Al–Si casting alloy. So, this result is consistent with the experimental results. And LN2DRvar is positively correlated with the tensile properties, because LN2DRvar is the first principal component and increased with the addition of Sr, which is consistent with the increase of tensile properties. However, it is still worth discussing and further investigating about why the increase of LN2DRvar lead to the enhancement of tensile properties.

4. Conclusion
The unmodified and strontium modified Al–7%Si–0.3%Mg casting alloys (mass%) were solidified at the cooling rate of 5 K/s. The large areas of eutectic-Si structure and finer eutectic-Si particles could be found in the microstructures of the samples after modification.
The classification of the microstructures was accomplished by using machine learning techniques, and high classification rates were obtained. The classification rate of unmodified and 0.02% Sr modified samples reached the highest point of 97.5% accuracy when using the statistical data and SVM as classifier. The results of PCA shown that LN2DRvar was the first principal component during the classification, which indicated the importance of second phase distribution on differentiating the microstructures of the samples before and after the modification. The modification changed the arrangement of the eutectic-Si particles from random to clustering distribution, which lead to an increment of LN2DRvar value.
The tensile properties of the samples were significantly increased after modification because of the refinement effect of Sr to the eutectic-Si phase.
REFERENCES
- 1) H. Ye: J. Mater. Eng. Perform. 12 (2003) 288–297. doi:10.1361/105994903770343132
- 2) S. Kumai, J. Hu, Y. Higo and S. Nunomura: Keikinzoku 45 (1995) 198–203. doi:10.2464/jilm.45.198
- 3) A. Mazahery and M.O. Shabani: JOM 66 (2014) 726–738. doi:10.1007/s11837-014-0968-1
- 4) N. Fatahalla, M. Hafiz and M. Abdulkhalek: J. Mater. Sci. 34 (1999) 3555–3564. doi:10.1023/A:1004626425326
- 5) S. Farahany, A. Ourdjini, M. Idrsi and S. Shabestari: Thermochim. Acta 559 (2013) 59–68. doi:10.1016/j.tca.2013.02.024
- 6) O. Uzun, F. Yılmaz, U. Kölemen and N. Başman: J. Alloy. Compd. 509 (2011) 21–26. doi:10.1016/j.jallcom.2010.09.037
- 7) M. Haque and M. Maleque: J. Mater. Process. Technol. 77 (1998) 122–128. doi:10.1016/S0924-0136(97)00409-3
- 8) S. Derin, U. Aybarç and Y. Birol: Int. J. Met. Cast. 11 (2017) 688–695. doi:10.1007/s40962-016-0117-4
- 9) M. Timpel, N. Wanderka, G.V. Kumar and J. Banhart: Ultramicroscopy 111 (2011) 695–700. doi:10.1016/j.ultramic.2010.12.023
- 10) Q. Wang and C. Davidson: J. Mater. Sci. 36 (2001) 739–750. doi:10.1023/A:1004801327556
- 11) B. Closset and J. Gruzleski: Metall. Trans. A 13 (1982) 945–951. doi:10.1007/BF02643389
- 12) M. Timpel, N. Wanderka, R. Schlesiger, T. Yamamoto, N. Lazarev, D. Isheim, G. Schmitz, S. Matsumura and J. Banhart: Acta Mater. 60 (2012) 3920–3928. doi:10.1016/j.actamat.2012.03.031
- 13) G. Mao, H. Yan, C. Zhu, Z. Wu and W. Gao: J. Alloy. Compd. 806 (2019) 909–916. doi:10.1016/j.jallcom.2019.07.107
- 14) C. Xu, Q. Jiang, Y. Yang, H. Wang and J. Wang: J. Alloy. Compd. 422 (2006) L1–L4. doi:10.1016/j.jallcom.2005.03.128
- 15) K. Nogita, S.D. McDonald and A.K. Dahle: Mater. Trans. 45 (2004) 323–326. doi:10.2320/matertrans.45.323
- 16) J. Li, X. Wang, T. Ludwig, Y. Tsunekawa, L. Arnberg, J. Jiang and P. Schumacher: Acta Mater. 84 (2015) 153–163. doi:10.1016/j.actamat.2014.10.064
- 17) K. Nogita, H. Yasuda, M. Yoshiya, S. McDonald, K. Uesugi, A. Takeuchi and Y. Suzuki: J. Alloy. Compd. 489 (2010) 415–420. doi:10.1016/j.jallcom.2009.09.138
- 18) K. Sugio, Y. Momota, D. Zhang, H. Fukushima and O. Yanagisawa: Mater. Trans. 48 (2007) 2762–2767. doi:10.2320/matertrans.MER2007125
- 19) K. Sugio, S. Furukawa, T. Kengai, J. Tabata and G. Sasaki: Mater. Sci. Forum 783–786 (2014) 240–245. doi:10.4028/www.scientific.net/MSF.783-786.240
- 20) Z. Qiu, K. Sugio and G. Sasaki: Mater. Trans. 62 (2021) 719–725. doi:10.2320/matertrans.MT-MBW2020002
- 21) D. Zhang, K. Sugio, K. Sakai, H. Fukushima and O. Yanagisawa: Mater. Trans. 48 (2007) 171–177. doi:10.2320/matertrans.48.171