Abstract
Yield phenomena during the tensile testing of pure titanium sheets of 0.2 mm and 0.4 mm in thickness were investigated in detail focusing on the effects of grain size (d), thickness (t), t/d ratio and tensile direction. With decreasing grain size, the yielding behavior changed from continuous yielding to one accompanied with yield point drop. Upper and lower yield stresses and 0.2%-proof stress followed the Hall–Petch relationship; however, coarse-grained specimens (d ≧ 20 µm) showed larger scatter in 0.2%-proof stress than the others. Consequently, the Hall–Petch coefficient (k) and friction stress (σ0) derived from 0.2%-proof stress are not accurate enough. The values of k and σ0 derived from various yield stresses and tensile directions were in the range of 250–600 MPa·µm0.5 and 30–180 MPa, respectively. Therefore, the validity of stress for yield stress was a concern, and the combination of the lower yield stress in the fine-grain range (d ≦ 20 µm) and 0.2%-proof stress excluding work-hardening in the coarse-grain range (d > 20 µm) was suggested to obtain reliable values of k and σ0, resulting in values of 370–460 MPa·µm0.5 and σ0 65–140 MPa, respectively. Moreover, it was revealed that k decreased and σ0 increased with the increasing angle of tensile direction to the rolling direction, regardless of thickness. The anisotropy of k is presumed to be affected by the grain boundary character rather than the Schmid factor, and neither rigidity nor the length of the Burgers vector are responsible. Meanwhile, the anisotropy of σ0 is verified to be affected by Schmid factors. Furthermore, it was clarified that the t/d ratio hardly affects upper and lower yield stresses (t/d > 14) nor 0.2%-proof stress (1.5 ≦ t/d ≦ 14).
This Paper was Originally Published in Japanese in J. Japan Inst. Met. Mater. 86 (2022) 53–61. The captions of Table 1 and Figs. 2–16 except for Fig. 5 were slightly modified.
1. Introduction
Titanium has applications in a wide range of fields such as chemical plants, heat exchangers using seawater and aircrafts, as industrial metals like steel and aluminum, owing to its excellent strength and corrosion resistance. However, its history in practical applications is relatively short, and the mechanical properties of titanium are often not entirely understood. Focusing on the yield stress of pure titanium, many reports have indicated that the yield stress follows the Hall–Petch relation.1,2) Nevertheless, various Hall–Petch coefficients have been reported in the literature.3–10) Furthermore, uncertainties have been noted regarding the size effect. The size effect is a phenomenon in which the mechanical properties of a material are affected by the sample dimensions, and it has been reported for various metals. Miyazaki et al. reported that the yield stresses of pure iron, aluminum alloys, copper alloys, etc., decreased when the ratio t/d of the sheet thickness (t) to the grain size (average diameter) (d) fell below a critical value.11) Similarly, Fukumaru et al. reported that the 0.2% proof stress of austenitic stainless steel SUS316L wire rods decreased when the ratio D/d of the wire diameter (D) to the grain size (d) was under five.12) The authors were unable to confirm a clear t/d dependence in the 0.2% proof stress of a pure titanium JIS class 1 cold-rolled sheet.10,13) It is unclear why this phenomenon, which occurs in various metals, cannot be confirmed in pure titanium. Clarifying these uncertainties could lead to an increase in the application areas for titanium, as well as its reliability.
First, the fact that the reported Hall–Petch coefficients vary considerably is examined. It is thought that this is owing to an experimental cause. Certain reported Hall–Petch coefficients have been incidentally derived with a small amount of data, such as three-point data, in studies with other aims. Meanwhile, the accuracy of the obtained value can be low even if there are many data points in the biased grain size range. Another influencing factor is that the yield stress used in many reports is the 0.2% proof stress. The 0.2% proof stress is often adopted as the yield stress in cases of continuous yielding, but the 0.2% proof stress is a yield stress incorporating an additional dislocation strengthening after yielding. There are no problems if the work-hardening amount at the 0.2% plastic strain does not depend on the grain size; however, if there is a grain size dependence, then the obtained Hall–Petch coefficient may be significantly influenced by the work hardening, depending on the grain size. Moreover, a discontinuous yield occurs in the fine grains; correspondingly, the yield stress clearly appears, and the influence of the work hardening can be excluded. Therefore, a more reliable Hall–Petch coefficient can be obtained in this case. Second, the large scatter of the Hall–Petch coefficient is considered from a materials perspective. Pure titanium has a hexagonal close-packed structure, making it strongly anisotropic, and the Hall–Petch coefficient is significantly affected by the texture. Wang et al. reported that in magnesium (which has the same crystal structure as titanium), the Hall–Petch coefficient, depending on the tensile direction, was affected by the Schmid factor as determined by the texture, magnitude of the Burgers vector owing to differences in the deformation mode (twinning deformation, basal slip), and critical resolved shear stress.14) Therefore, it is expected that the texture of pure titanium has a large influence on the Hall–Petch coefficient; however, there are few reports on this aspect. These factors are presumably the reasons for the large scatter in the Hall–Petch coefficient.
Furthermore, the 0.2% proof stress of pure titanium does not show a dependence on t/d, because, as mentioned above, the 0.2% proof stress is affected by work hardening. Therefore, consideration of this aspect is expected to rigorously clarify the dependence of the yield stress on t/d.
Therefore, in this study, using pure titanium sheets, we investigated the effects of the grain size, sheet thickness, and tensile direction on the yield stress over a wide range of grain sizes, from continuous to discontinuous yields.
2. Experimental Method
2.1 Test materials
The test materials were the same as those in a previous study,13) with industrial pure titanium JIS Class 1 hot-rolled sheets (Fe: 0.026%, O: 0.056%, C: 0.005%, N: <0.004%, H: 0.0034%, %: mass%) used as the starting material. As shown in Fig. 1, the primary cold rolling was conducted with 50% and 75% reductions, followed by primary annealing at 800°C for 1 min and then air cooling. The descaling after the annealing was conducted via shot blasting and pickling with a 3% HF + 5% HNO3 aqueous solution. After the descaling, secondary cold rolling with an 80% reduction was conducted to obtain cold-rolled sheets with sheet thicknesses of 0.2 mm and 0.4 mm. Vacuum annealing was then performed at 560–830°C for 1 h followed by cooling in Ar gas over a wider temperature range than in the previous study, so as to control the grain size within a wider range. Finally, all test materials were subjected to vacuum annealing at 500°C for 1 h and then cooled in a vacuum oven to remove residual stress.

The microstructural observations were conducted using optical microscopy (OM) and scanning electron microscopy (SEM). The JSM-7200F (JEOL Ltd.) was used for the SEM observations, and a crystal orientation analysis was conducted using the electron backscattering diffraction method. The crystal orientation was measured with an acceleration voltage of 15 kV from the transverse direction (TD) perpendicular to the normal direction (ND) and rolling direction (RD) at a step size of 0.2–3 µm in the area of the sheet thickness of t × 5–10 mm.
The observation sample was embedded in epoxy resin and underwent wet mechanical polishing with a #120–#1500 emery paper before being polished with a colloidal silica suspension. The polished samples were etched with a 3% HF + 5% HNO3 aqueous solution prior to observation.
2.3 Tensile test
A 5-kN autograph manufactured by the Shimadzu Corporation was used for the tensile tests. Considering the in-plane anisotropy of the 0.2% proof stress shown in a previous study,13) the JIS13B sub-size test piece (parallel width of 6.25 mm, parallel length of 32 mm, and gauge length of 25 mm) was collected such that the angles θ between the RD and tensile direction were 0°, 45°, 60°, and 90°, respectively. The stroke speed was 1 mm/min with a strain rate of approximately 5.0 × 10⁻⁴/s during uniform deformation.
3. Experimental Results
3.1 Microstructure and texture
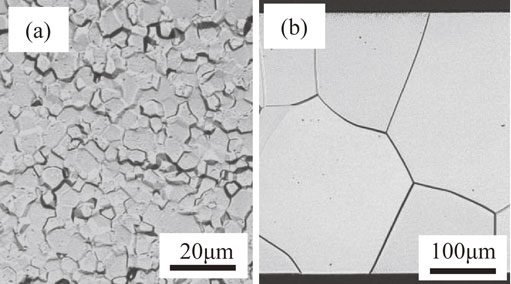
Figure 2 shows the OM images of the 0.4-mm-thick materials as annealed at 560°C and 830°C. Both have equiaxed grains and α-single-phase structures, and as in a previous study,13) the grains become coarser as the annealing temperature increases. A wider grain size range than in the previous report is obtained in the present report, with grain ranges of 5.3–133 µm and 4.4–155 µm for materials with sheet thicknesses of 0.2 and 0.4 mm, respectively. Figure 3 shows the (0001) pole figures of the 0.4-mm thick materials annealed at 560°C and 830°C. In both cases, the α-phase has a well-known typical split-TD type B-texture with an inclination of [0001] approximately 35° in the TD with respect to the ND. It is also clear that a larger average grain size results in a higher maximum intensity and sharper texture.
3.2 Tensile properties
3.2.1 Continuous yield and discontinuous yield
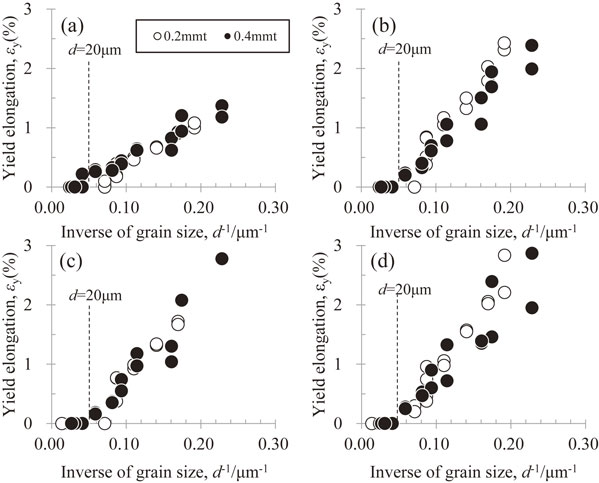
Figure 4 shows the nominal stress–nominal strain curves of the 0.4-mm thick sheets. A smaller grain size results in a discontinuous yield accompanied by a yield drop, regardless of the tensile direction. The smaller grain size also increases the yield-point elongation occurring during the discontinuous yield. This phenomenon has also been reported for metals such as aluminum.15–21) Figure 5 shows an enlarged view of the test materials exhibiting the continuous yield shown in Fig. 4(b). When the grain sizes are 32 µm and 75 µm, the test material with the smaller grain size clearly has a smaller work-hardening amount after yielding. Therefore, cases where the 0.2% proof stress is adopted as the yield stress can exhibit different work-hardening amounts depending on the grain size. Figure 6 shows the relationship between the grain size and yield point elongation. The phenomenon in which the yield drop cannot be clearly seen occurs when the grain size is 20 µm or more, regardless of the tensile direction. Therefore, in this report, cases where the grain size is 20 µm or less are considered as showing a discontinuous yield, and cases where the grain size exceed 20 µm are considered as showing a continuous yield. The yield point elongation increases in proportion to the reciprocal of the grain size for each tensile direction. Furthermore, the yield point elongation increases with increases in θ up to 45°, but there are no differences when θ is between 45° and 90°.

Figures 7 and 8 show the relationships between the grain size of the 0.4-mm- and 0.2-mm-thick sheets and the upper yield stress, lower yield stress, and 0.2% proof stress. The 0.2% proof stress was used as the yield stress in a previous report,13) but the upper yield stress is also shown in this report, as expanded to the finer grain range. The solid lines show the upper and lower yield stresses, and the dotted line shows the approximate straight line obtained by the least-squares method for the 0.2% proof stress. When the discontinuous yield occurs, the 0.2% proof stress is a value between the upper and lower yield stresses and is closer to the lower yield stress. In other words, the propagation of the Lüders band in the width direction is not completed within the 0.2% strain, so the physical meaning of the 0.2% proof stress for the discontinuous yield case is unclear. Therefore, the 0.2% proof stress is presented only for the continuous yield case. The three types of yield stresses defined above, which are adopted as the yield stresses, can be arranged with the Hall–Petch relation, regardless of the sheet thickness. Furthermore, the Hall–Petch coefficient (inclination) is the largest when the upper yield stress is adopted. In the 0.4-mm-thick sheet, the Hall–Petch coefficient of the lower yield stress is only larger than the Hall–Petch coefficient of the 0.2% proof stress at θ = 0°. In the 0.2-mm-thick sheet, the Hall–Petch coefficient of the lower yield stress is larger than the Hall–Petch coefficient of the 0.2% proof stress in all tensile directions. Furthermore, the variation in the 0.2% proof stress is larger in the 0.2-mm-thick sheet than that in the 0.4-mm-thick sheet, regardless of the tensile direction.
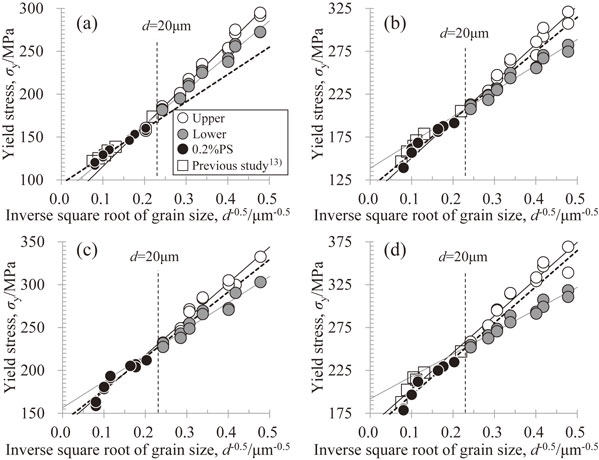

Figure 9 shows the relationship between the tensile direction and Hall–Petch coefficient, as well as the friction stress (intercept in the Hall–Petch plot). For both the 0.4-mm- and 0.2-mm-thick sheets, the Hall–Petch coefficient of the lower yield stress decreases with increasing θ, whereas that of the 0.2% proof stress increases. The tendency of the Hall–Petch coefficient for the upper yield stress varies with the sheet thickness, with the 0.4-mm-thick sheet having a smaller value with increasing θ. In contrast, the 0.2-mm-thick sheet has a smaller value up to a θ of 60°, but a larger value at θ = 90°. Thus, the Hall–Petch coefficient changes in the range of 250–600 MPa·µm0.5 depending on the difference in the stress adopted as the yield stress, as well as on the tensile direction. The friction stress tends to increase with increasing θ for each sheet thickness. However, the friction stress of the 0.2-mm-thick sheet shows larger differences than those of the 0.4-mm-thick sheet depending on the adopted yield stress, with a maximum difference of approximately 80 MPa.
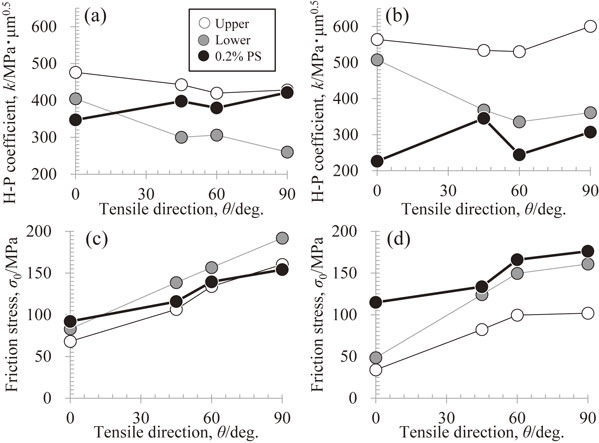
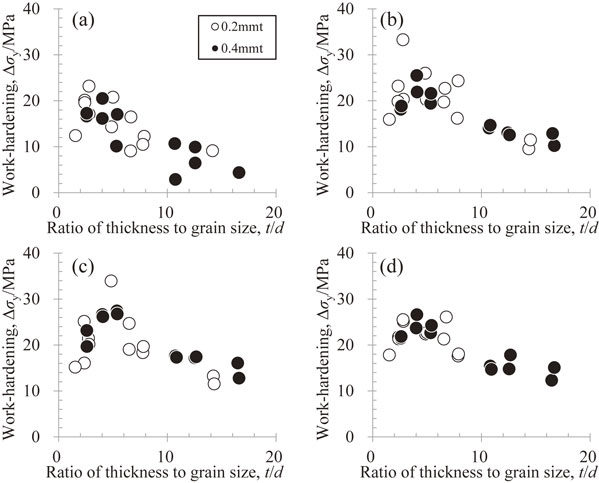
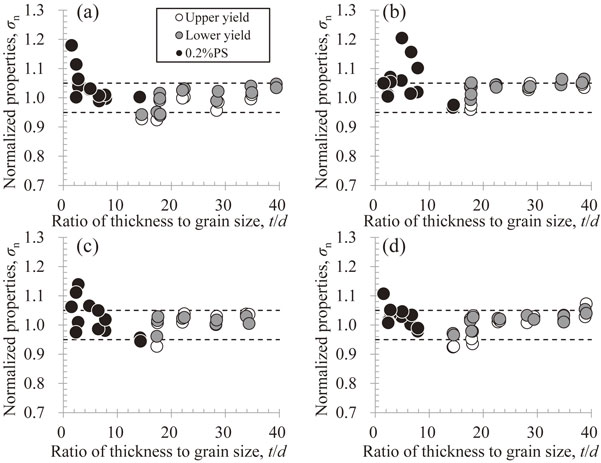
Figure 10 shows the relationship between the t/d and yield stress ratio for the 0.2-mm-thick sheet. Here, the yield stress ratio is obtained as follows. The upper yield stress, lower yield stress, and 0.2% proof stress of the 0.2-mm-thick sheet shown in Fig. 8 are normalized using those of the 0.4-mm-thick sheet shown in Fig. 7. The lower limit (0.95) and upper limit (1.05) of the ratio between the experimental value of the 0.4-mm-thick sheet and the predicted value based on Fig. 7 are shown by dashed lines. The cases where discontinuous yielding occurs have a t/d in the range of 14–40; in this t/d range, the yield stress ratio is almost 1.0, regardless of the tensile direction. Meanwhile, the 0.2% proof stress obtained by a continuous yield in the range of t/d less than 14 has large variations, and certain results exceed 1.05. However, most data points appear to be within the dashed lines. Furthermore, even in a range with very small t/d values of 4–5 or less, no specific tendencies can be observed. The reason for the large variation in the normalized 0.2% proof stress in the low range of t/d values is currently unclear. However, it is presumed that the large variation in the 0.2% proof stress itself may be a cause. As in a previous report,13) Fig. 10 suggests that t/d could have no effect (or a very small effect) on the yield stress, regardless of the stress being used as the yield stress. The authors previously reported that the effect of t/d on the work hardening appeared in a region with a large strain amount when t/d was below approximately 4–5.10,13) Therefore, the work-hardening amount at the 0.2% proof stress was examined. In the present study, the work-hardening amount is defined as the stress difference between the 0.2% proof stress and the stress at the point where the strain amount is 0.2% further lower, as schematically illustrated in Fig. 5. With this method, the plastic strain amount at the 0.2% proof stress differs depending on the work-hardening amount; therefore, the work-hardening amount cannot be completely determined. However, the difference in the plastic strain amount owing to the work hardening is as small as approximately 0.01%, i.e., 10 MPa in stress, and presumably corresponds to a large portion of the work hardening. Figure 11 shows the relationship between the work-hardening amount and t/d. The work-hardening amount tends to decrease when t/d falls below 4–5. This decrease is approximately 10 MPa. In contrast, the yield stress in the present study is at least 100 MPa, so the yield stress ratio is 0.9, even when the work-hardening amount decreases by 10 MPa. Therefore, the 0.2% proof stress is judged not to decrease sharply as t/d decreases below 4–5; however, based on this tendency, the 0.2% proof stress might significantly decrease in this study when t/d is smaller than the minimum value of approximately 1.5. Accordingly, special care is required if t/d is 1.5 or less if strength is required in the design.
4. Discussion
4.1 Effect of work hardening on Hall–Petch coefficient and friction stress based on 0.2% proof stress
As previously mentioned in Section 3.2, the Hall–Petch coefficient and friction stress change across a wide range, depending on not only the definition of the yield stress but also on the tensile direction. In this regard, a discussion is first given on the effect of the definition of the yield stress. For a discontinuous yield, the upper and lower yield stresses are defined as the yield stress. The upper yield stress is the stress in which plastic deformation starts owing to the concentrated stress in the shoulder of the specimen; the stress concentration is affected by the plastic restraint, depending on the shape of the specimen. The lower yield stress is the stress at the Lüders front when the Lüders band generated at the upper yield stress propagates in the parallel section. However, a step is generated at the boundary between the deformed position and non-deformed position during the propagation of the Lüders band, so this becomes the location of a stress concentration. The concentrated stress may be higher than when there is no step, owing to the plastic restraint. Therefore, the Lüders band propagates throughout the parallel portion. Accordingly, the stress immediately before the start of uniform work hardening, that is, the state in which there is no step in the parallel portion, is thought to represent a more accurate value for the lower yield stress. Therefore, a lower yield stress is less likely to cause variations in experimental results. Consequently, the lower yield stress is judged to be the yield stress for the discontinuous yield case. Meanwhile, as previously mentioned, the 0.2% proof stress used for the continuous yield case incorporates the effect of the work hardening. As shown in Fig. 11, the work-hardening amount depends on t/d and the grain size. Furthermore, the in-plane anisotropy of the Hall–Petch coefficient of the 0.2% proof stress is different from that of the lower yield stress. Therefore, the effect of the work hardening on the Hall–Petch coefficient and friction stress using the 0.2% proof stress was investigated.
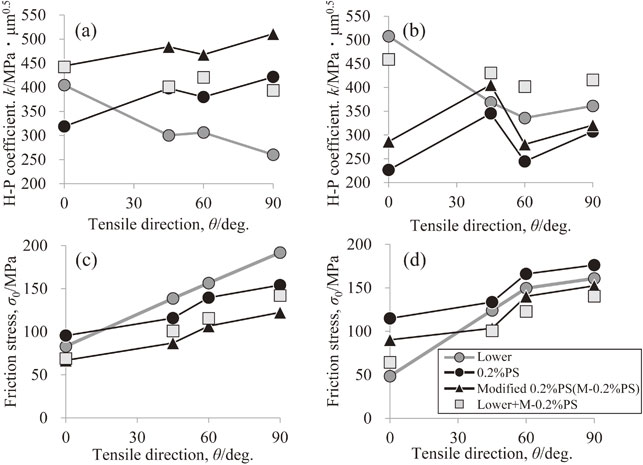
The work-hardening amount shown in Fig. 11 was subtracted from the 0.2% proof stresses from Figs. 7 and 8 to exclude the influence of the work hardening from the 0.2% proof stress. Figures 12 and 13 show the 0.2% proof stresses after removing the amount of work hardening from the 0.4-mm- and 0.2-mm-thick sheets, respectively. The Hall–Petch coefficient of the 0.2% proof stress becomes larger for each sheet thickness when considering the work hardening. Furthermore, Fig. 14 shows the tensile direction dependence of the Hall–Petch coefficient and friction stress obtained from Figs. 12 and 13. An increase in the Hall–Petch coefficient of 50–100 MPa·µm0.5 is recognized when the work hardening is removed from the 0.2% proof stress, indicating that the work-hardening effect is large. However, the in-plane anisotropy of the Hall–Petch coefficient remains different from that obtained using a lower yield stress i.e., the reference value. The reason why the in-plane anisotropy of the Hall–Petch coefficient based on the 0.2% proof stress shows a different behavior from the others was initially thought to be the development of the B-texture owing to the grain growth, as shown in Fig. 3. However, as described below, it can be inferred that the texture change associated with the grain growth did not affect the in-plane anisotropy of the Hall–Petch coefficient.

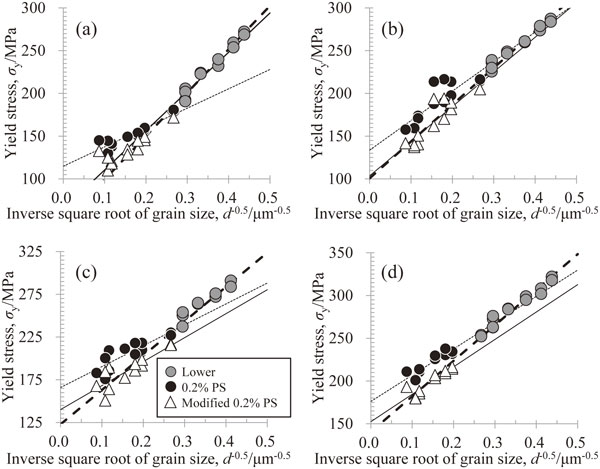

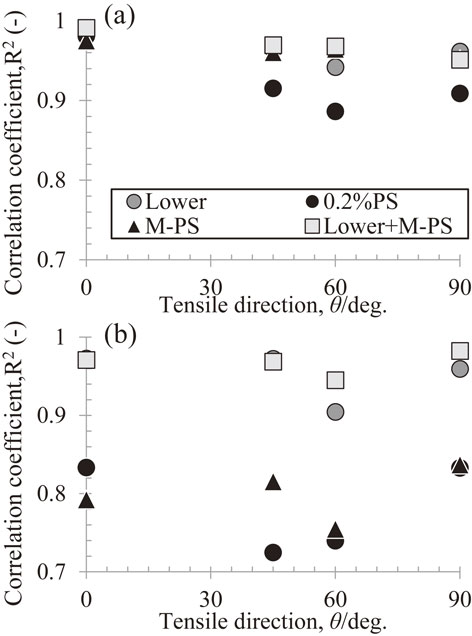
Consequently, there is concern that the Hall–Petch coefficient is strongly affected by variations in the data. This is because the specimens exhibiting continuous yields for evaluating the 0.2% proof stress are limited to coarse-grained ones, leading to concentrated data points within a narrow range of the coarse grain sheets (Figs. 7 and 8). Therefore, the data were organized by combining both the 0.2% proof stress after removing the work-hardening amount and lower yield stress. Figure 15 shows the relationship between the correlation coefficient R2 and θ when each dataset is approximated using the least-squares method. The 0.4-mm-thick sheet case (Fig. 15(a)) has a low correlation coefficient for the data analysis when using the 0.2% proof stress, but this is improved by removing the work-hardening amount from the 0.2% proof stress. Furthermore, when combining the lower yield stress with the 0.2% proof stress, where work hardening is removed (the modified 0.2% proof stress), a slightly higher correlation value is obtained than when using the lower yield stress. The 0.2-mm-thick sheet case (Fig. 15(b)) has a much lower correlation coefficient for the 0.2% proof stress than the 0.4-mm-thick sheet case. There are also no significant improvements even when the work-hardening amount is removed. However, the approximation by combining the lower yield stress with the modified 0.2% proof stress significantly improves the correlation, and a higher correlation coefficient is obtained than that with a lower yield stress. This suggests that approximation over a wide grain size range is very important. It can also be seen from comparisons of Fig. 14(a), (c) and (b), (d) that an approximation by combining the lower yield stress with the modified 0.2% proof stress shows almost equivalent values for the obtained Hall–Petch coefficient and friction stress, regardless of the sheet thickness and in each tensile direction. This also supports the importance of evaluating across a wide grain size range.
Section 4.1 discussed the effects of work hardening during continuous yielding on the Hall–Petch coefficient and friction stress. The results showed that when creating a Hall–Petch plot using both the lower yield stress and modified 0.2% proof stress, a higher correlation is obtained between the yield stress and grain size. The reason for this can be understood by conceptualizing the yield mechanism as follows. The Hall–Petch relation is an empirical formula; however, Hall1) proposed a pile-up theory of dislocations at grain boundaries as a theoretical basis. Furthermore, Eshelby et al.22) noted the importance of the pile-up distances of the dislocations, and the shear stress generated at the grain boundaries caused by the pile-up dislocations. These can be used to derive the Hall–Petch relation, and the shear yield stress can be expressed as shown in eq. (1).
| \begin{equation}
\tau = \tau_{0} + \sqrt{\frac{2 \cdot G \cdot b \cdot \tau_{gc}}{\alpha \cdot \pi}} d^{-0.5}
\end{equation}
| (1) |
Here, τ is the shear yield stress, τ0 is the shear stress owing to internal friction, G is the rigidity, b is the Burgers vector magnitude, τgc is the critical shear stress at which dislocations are generated from the grain boundaries, and α is a constant determined based on the nature of the dislocations. Grains with various orientations exist in polycrystals. When considering individual grains, a non-uniform stress concentration occurs owing to the Schmid factor, elastic anisotropy, and restraints from the surrounding grains; among these, there are grains that yield with low stress (micro-yielding). However, the number of grains yielding at low stress is small and the generated plastic strain is also small, so elastic deformation is observed at the macroscale. At higher stress values, the increased number of dislocations (i.e., piled-up dislocations at the grain boundaries) gradually raises the number of grains that yield, resulting in plastic deformation at the macroscale. Therefore, it can be said that each parameter in eq. (1), such as τgc, reflects a value at the stage where a certain degree of micro-yielding has occurred. Furthermore, insofar as interpreting this mechanism as a continuous yield or discontinuous yield, the former can be understood as a phenomenon of a continuously occurring yield at the macroscale, owing to the increase in the number of grains that yield. Meanwhile, a discontinuous yield involves relatively fewer grains undergoing micro-yielding at high stress, owing to the fine grains. In other words, dislocations become piled-up at the grain boundaries of the limited grains. When yielding occurs at the grains with a high degree of local stress concentration, the dislocations are suddenly released from the limited grain boundaries, Thus, yielding occurs in an avalanche manner. As a result, the local deformation under a constant stress (lower yield stress) progresses at the Lüders front while forming the Lüders band. The grain refinement strengthening can essentially be modeled in the same manner as in eq. (1) for both discontinuous and continuous yields. However, the continuous yield does not show a clear stress corresponding to the lower yield stress in a case of the discontinuous yield; thus, a 0.2% proof stress including the work hardening is used. As a result, it can be seen that the correlation in the Hall–Petch relationship is enhanced by removing the work hardening from the 0.2% proof stress. Based on this understanding, the in-plane anisotropies of the Hall–Petch coefficient and friction stress were discussed.
Generally, the conversion from eq. (1) to the tensile yield stress of a polycrystal is expressed as shown in eq. (2), using the crystal orientation factor (Taylor factor) M.
| \begin{equation}
\sigma = \sigma_{0} + M \cdot \sqrt{\frac{2 \cdot G \cdot b \cdot \tau_{gc}}{\alpha \cdot \pi}} d^{-0.5}
\end{equation}
| (2) |
Here, σ is the tensile stress, σ
0 is the tensile stress owing to internal friction, and
M is the Taylor factor. Values derived from the Sachs model
23) or Taylor model
24) are used for
M. The Taylor model assumes a homogeneous strain for all grains and requires five or more independent slip systems for the calculations. However, the calculations cannot be conducted if the actual deformation is considered. Studies have reported that no deformed twins can be confirmed immediately after yielding in the tensile deformation of pure titanium.
10) Furthermore, observations of the slip line after a 1% tensile deformation have shown that only a prismatic slip can be confirmed. Therefore, the actual yield phenomenon is predominantly a result of the prismatic slip. In that regard, there are only three independent active slip systems. Furthermore, the pure titanium cold-rolled and annealed sheet used in this study has an extremely strong split-TD type B-texture as shown in
Fig. 3, allowing us to treat the specimens as almost a single crystal at the macroscale. Therefore, the tensile stress was assumed to be expressed by
eq. (3), i.e., using the Schmid factor instead of the Taylor factor. Wang
et al. also discussed the use of the Schmid factor in a magnesium polycrystal sheet with a well-developed texture to explain the anisotropy of the tensile properties.
14)
| \begin{equation}
\sigma = \frac{\tau_{0}}{S} + \frac{1}{S} \cdot \sqrt{\frac{2 \cdot G \cdot b \cdot \tau_{gc}}{\alpha \cdot \pi}} d^{-0.5}
\end{equation}
| (3) |
Here,
S is the Schmid factor of the prismatic slip obtained from the texture of the polycrystal; it is a function of θ, because it differs depending on the tensile direction. The
S in
eq. (3) should be the average value of the grains yielding at the time of macroscopic yielding, but this value is difficult to obtain. Accordingly, the average value of the test material can be adopted instead. Furthermore, in this study, as the material used is a polycrystal pure titanium sheet with a strongly developed texture, the Schmid factor was calculated with
eq. (4), using the product of the Schmid factor and the area fraction of each oriented grain.
| \begin{equation}
S = \sum S_{i} \cdot A_{i}
\end{equation}
| (4) |
In the above,
Si is the maximum Schmid factor of the prismatic slip of a given grain, and
Ai is the area fraction of the grain with the Schmid factor of
Si.
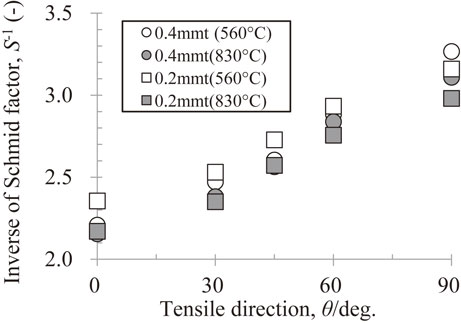
Figure 16 shows the relationship between the tensile direction and reciprocal of the Schmid factor for the prismatic slip. A larger θ value results in a larger reciprocal of the Schmid factor. Furthermore, when changing the annealing temperature from 560°C to 830°C to promote grain growth, the reciprocal of the Schmid factor becomes slightly smaller owing to the increase in the intensity of the split-TD type B-texture, but the in-plane anisotropy does not change (
Fig. 16). Such changes in the Schmid factor owing to the grain growth are estimated to decrease the first term on the right-hand side of
eq. (3) (related to the friction stress) by approximately 4–7 MPa and the second term of
eq. (3) by approximately 3–7 MPa, with a total decrease of less than 20 MPa at most. Here, the evaluations are conducted by assuming that τ
0 is 50 MPa, and that the Hall–Petch coefficient is the value shown in
Fig. 9. Therefore, it is concluded that the yield stress decreases slightly with the grain growth, as accompanied by the split-TD type B-texture development; however, this neither affects the in-plane anisotropy of the Hall–Petch coefficient nor the friction stress. Furthermore, it is inferred that the amount of change in the yield stress owing to the change in texture is smaller than that owing to the effect of the work hardening, owing to the grain coarsening.
4.2.2 Factors controlling in-plane anisotropy
Here, we discuss on the factors controlling the in-plane anisotropy of the Hall–Petch coefficient and friction stress.
The friction stress (Fig. 14(c), (d)) has the same in-plane anisotropy as the reciprocal of the Schmid factor (Fig. 16), and it can be seen from eq. (3) as well that the Schmid factor is dominant. Meanwhile, the Hall–Petch coefficient (Fig. 14(a), (b)) and reciprocal of the Schmid factor show opposite tendencies with regards to in-plane anisotropy, suggesting that there is another factor with a larger influence than the Schmid factor. In the Hall–Petch coefficient shown in the second term on the right side of eq. (3), the magnitude of the Burgers vector is constant (0.295 nm), as only the prismatic slip is considered in the test material used in the present study. Furthermore, α differs depending on the dislocation components, but these are not thought to be extremely different. The rigidity has been reported as approximately 40 GPa,25) and this value was set in this study. When considering the above, it is speculated that τgc has a large effect on the in-plane anisotropy of the Hall–Petch coefficient.
The in-plane anisotropy of τgc was evaluated based on the coefficient of (d)−1/2, i.e., the second term on the right-hand side of eq. (3). The in-plane anisotropy of τgc as thus evaluated is shown in Table 1, along with the experimentally obtained Hall–Petch coefficient in each tensile direction, and the reciprocal of the calculated Schmid factor. The reciprocal of the Schmid factor represents the result from using the texture of a sheet annealed at 560°C. Furthermore, the value of α was set to be approximately 0.8 when the ratio of screw dislocations to edge dislocations was assumed to be 1:1. The values of each parameter shown in Table 1 were also set as the average values of those for the 0.2-mm- and 0.4-mm-thick sheets. Table 1 reveals that τgc becomes smaller as θ increases, with an approximately 2.5-fold difference between the values at θ = 0° and θ = 90°. These results suggest that the in-plane anisotropy of the Hall–Petch coefficient is governed by τgc rather than the Schmid factor. The grain boundary characteristics and grain boundary segregation are assumed to be why the value of τgc differs greatly according to the tensile direction. To date, there are many studies on the interactions between grain boundaries and dislocations from the perspective of the grain boundary characteristics from the pop-in behaviors of nano-indentation, with a focus on iron-based materials. There are also reports suggesting that the critical stress required to activate grain boundary dislocation sources differs depending on the grain boundary characteristics.26–29) It can be stated from these reports that the grain boundary characteristics presumably contribute to the tensile direction dependence of the Hall–Petch coefficient. However, it is not clear which of the five parameters representing the grain boundary characteristics is the most important. Additionally, Herbig et al. reported that the grain boundary segregation is also affected by the grain boundary characteristics.30) The grain boundary segregation was not investigated in this study, making it difficult to understand the effects of grain boundary characteristics. As such, detailed investigations are required in the future.

5. Conclusions
The effects of the grain size, sheet thickness, and tensile direction on the yield behaviors of pure titanium sheets were investigated, and the following results were obtained.
-
(1)
Continuous yielding was exhibited for specimens with grain sizes of approximately 20 µm or more, whereas discontinuous yielding was exhibited for specimens with smaller grain sizes.
-
(2)
The Hall–Petch coefficient changed significantly in the range of 250–600 MPa·µm0.5, depending on the adopted yield stress (such as the upper yield stress, lower yield stress, and 0.2% proof stress). The tensile direction dependence also tended to differ depending on the adopted yield stress. In particular, it was found that the 0.2% proof stress followed the Hall–Petch relation; however, the coefficient varied greatly.
-
(3)
The influence of the ratio of the sheet thickness (t) to the grain size (d) (t/d) on the yield stress was hardly noticeable in the upper yield stress, lower yield stress, or 0.2% proof stress.
-
(4)
The Hall–Petch coefficient obtained using the lower yield stress for the discontinuous yield case and the 0.2% proof stress where the work-hardening amount was removed for the continuous yield case exhibited the same in-plane anisotropies as when only the lower yield stress was used, and also exhibited high accuracy. Furthermore, the Hall–Petch coefficient and friction stress showed almost the same values, regardless of the sheet thickness. This suggests that it is important to widen the grain size range to reduce the variations when evaluating the Hall–Petch relation.
-
(5)
The tensile direction dependence of the Hall–Petch coefficient showed a tendency opposite to that predicted by the Schmid factor. This suggests that the tensile direction dependence of τgc was dominant, implying the importance of the grain boundary characteristics for the in-plane anisotropy of the Hall–Petch coefficient. Meanwhile, the tensile direction dependence of the friction stress could be explained by the Schmid factor.
REFERENCES
- 1) E.O. Hall: Proc. Phys. Soc. London, Sect. B 64 (1951) 747–753. doi:10.1088/0370-1301/64/9/303
- 2) N.J. Petch: J. Iron Steel Inst. 174 (1953) 25–28.
- 3) K. Ahn, H. Huh and J. Yoon: Met. Mater. Int. 19 (2013) 749–758. doi:10.1007/s12540-013-4014-6
- 4) P. Luo, Q. Hu and X. Wu: Metall. Mater. Trans. A 47 (2016) 1922–1928. doi:10.1007/s11661-016-3391-0
- 5) P. Luo: J. Mater. Eng. Perform. 29 (2020) 769–775. doi:10.1007/s11665-020-04601-7
- 6) P. Rodriguez-Calvillo and J.M. Cabrera: Mater. Sci. Eng. A 625 (2015) 311–320. doi:10.1016/j.msea.2014.11.082
- 7) Y. Kobayashi, Y. Tanaka, K. Matsuoka, K. Kinoshita, Y. Miyamoto and H. Murata: J. Soc. Mat. Sci., Japan 54 (2005) 66–72. doi:10.2472/jsms.54.66
- 8) P. Luo, D.T. McDonald, W. Xu, S. Palanisamy, M.S. Darguschc and K. Xiaa: Scr. Mater. 66 (2012) 785–788. doi:10.1016/j.scriptamat.2012.02.008
- 9) T. Yoshimura, H. Imai and K. Kondoh: J. Japan Inst. Metals 73 (2009) 768–772. doi:10.2320/jinstmet.73.768
- 10) H. Takebe, K. Mori, K. Takahashi and H. Fujii: Proc. 13th World Conf. on Titanium, pp. 491–494.
- 11) S. Miyazaki, K. Shibata and H. Fujita: Acta Metall. 27 (1979) 855–862. doi:10.1016/0001-6160(79)90120-2
- 12) T. Fukumaru, H. Hidaka, T. Tsuchiyama and S. Takaki: Tetsu-to-Hagané 91 (2005) 828–833. doi:10.2355/tetsutohagane1955.91.11_828
- 13) H. Takebe and K. Ushioda: Mater. Trans. 62 (2021) 952–961. doi:10.2320/matertrans.MT-M2021035
- 14) Y. Wang and H. Choo: Acta Mater. 81 (2014) 83–97. doi:10.1016/j.actamat.2014.08.023
- 15) K. Tomimura, H. Nagamori, S. Takaki and Y. Tokunaga: J. Japan Inst. Metals 55 (1991) 376–382. doi:10.2320/jinstmet1952.55.4_376
- 16) S. Gao, Y. Bai, R. Zheng, Y. Tian, W. Mao, A. Shibata and N. Tsuji: Scr. Mater. 159 (2019) 28–32. doi:10.1016/j.scriptamat.2018.09.007
- 17) R. Saha, R. Ueji and N. Tsuji: Scr. Mater. 68 (2013) 813–816. doi:10.1016/j.scriptamat.2013.01.038
- 18) S. Yano and S. Morozumi: J. Japan Inst. Materials 36 (1972) 1252–1257. doi:10.2320/jinstmet1952.36.12_1252
- 19) N. Kamikawa, X. Huang, N. Tsuji and N. Hansen: Acta Mater. 57 (2009) 4198–4208. doi:10.1016/j.actamat.2009.05.017
- 20) Y.Z. Tian, S. Gao, L.J. Zhao, S. Lu, R. Pippan, Z.F. Zhang and N. Tsuji: Scr. Mater. 142 (2018) 88–91. doi:10.1016/j.scriptamat.2017.08.034
- 21) S. Yoshida, T. Ikeuchi, T. Bhattacharjee, Y. Bai, A. Shibata and N. Tsuji: Acta Mater. 171 (2019) 201–215. doi:10.1016/j.actamat.2019.04.017
- 22) J.D. Eshelby, F.C. Frank and F.R.N. Nabarro: Philos. Mag. 42 (1951) 351–364. doi:10.1080/14786445108561060
- 23) G. Sachs: Z. Ver. Dtsch. Ing. 72 (1928) 734–736.
- 24) G.I. Taylor: J. Inst. Met. 62 (1938) 307–324.
- 25) R. Boyer, G. Welsch and E.W. Coliings: Materials Properties Handbook: Titanium Alloys, (ASM International, Ohio, 1994) pp. 178–179.
- 26) P.C. Wo and A.H.W. Ngan: J. Mater. Res. 19 (2004) 189. doi:10.1557/jmr.2004.19.1.189
- 27) S. Araki, K. Mashima, T. Masumura, T. Tsuchiyama, S. Takaki and T. Ohmura: Scr. Mater. 169 (2019) 38–41. doi:10.1016/j.scriptamat.2019.05.001
- 28) K. Nakano, K. Takeda, S. Ii and T. Ohmura: J. Japan Inst. Met. Mater. 85 (2021) 40–48. doi:10.2320/jinstmet.JD202006
- 29) M.G. Wang and A.H.W. Ngan: J. Mater. Res. 19 (2004) 2478–2486. doi:10.1557/JMR.2004.0316
- 30) M. Herbig, D. Raabe, Y.J. Li, P. Choi, S. Zaefferer and S. Goto: Phys. Rev. Lett. 112 (2014) 126103. doi:10.1103/PhysRevLett.112.126103