Abstract
Additively manufactured metal parts often have a high level of residual stress and can exhibit complex crystalline phase properties due to the rapid cooling nature of their fabrication process. X-ray diffraction (XRD) is a non-destructive technique that can characterize both the residual stress and the crystalline phase properties in detail. However, XRD is an ex-situ measurement and provides only the final state of the manufactured parts. In this article, a method that combines the XRD analyses and numerical simulation of the thermal history during the manufacturing process is reviewed with two examples of titanium alloys fabricated by laser and electron beam powder fusion techniques.
This Paper was Originally Published in Japanese in J. JILM 72 (2022) 227–233.
1. Introduction
Additive manufacturing (AM) technology is attracting attention as a method that can freely fabricate parts with complicated shapes without mold preparation or machining. Particularly in the case of titanium, which has a higher unit price than aluminum and iron, AM technology also has the great economic advantage of maintaining a low buy-to-fly ratio (the weight of raw materials in the product).1,2) In light of this, the AM of titanium-based alloys, especially the powder bed fusion (PBF) technique — which enables accurate fabrication of relatively fine structures — and its application to custom implants made according to each patient’s bone shape have been actively studied in recent years,3,4) and its practical application has begun.5)
The PBF technique is a manufacturing method that locally melts and solidifies metal powder by scanning a laser beam or electron beam on a powder bed with a thickness of several tens to 100 µm. Net shape fabrication is possible by sequentially stacking layers of several tens to 100 µm thick according to a design drawing.6,7) Furthermore, powder can be used as a starting material and placed inside a porous body to impart energy absorption to the structure.8) However, while this method has many advantages, there is also a problem caused by the process unique to the AM method, which is the repeated rapid melting and solidification, in the order of minutes, of molten pools of several hundred µm. This complex thermal history is accompanied by rapid and local thermal shrinkage; therefore, residual stress is likely to occur in the parts.9–11) In addition, when dealing with a material that exhibits an unstable phase, such as β-type titanium, there is a concern that undesired phase changes may occur, depending on the thermal history. Residual stress causes deformation of the outer shape of the part during or after the manufacturing process.12–19) Concurrently, residual stress near the surface causes cracks, which reduces the mechanical reliability of the final part.12,19) Changes in the crystalline phase caused by the stabilization of a metastable phase by residual stress can unintentionally affect the performance and reliability of the final part due to the changes in the mechanical properties of the material itself. Therefore, it is essential to systematically relate various process conditions to the residual stress and phase stability of the resulting product and optimize the process conditions to realize the required functionality of the final parts.
2. Evaluation of Residual Stress and Phase Stability by X-ray Diffraction Method
X-ray diffraction (XRD) is a non-destructive measurement method whose resolution of lattice spacing measurement is higher than that of electron diffraction. Furthermore, unlike the neutron diffraction method, it can be performed in a laboratory. In addition, by applying the same XRD measurement geometry to the measurement of residual stress and crystal structure, it is possible to accurately evaluate the interrelationship of residual stress and crystal structure at approximately the same volume.20)
When using a laboratory-based X-ray diffractometer, the penetration depth of X-rays into metal is generally estimated at several tens of µm. Therefore, this method is very effective for analyzing areas near the surface. However, it is not always suitable for the internal analysis of the manufactured product. High-energy XRD using synchrotron radiation or neutron diffraction methods is required for non-destructive measurement of the internal residual stress and crystal structure.
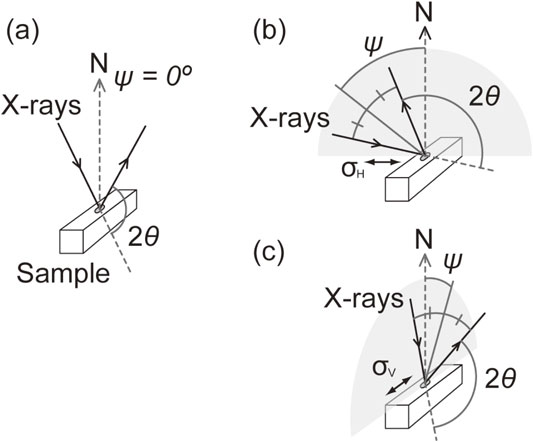
Figure 1 shows an overview of a laboratory-based X-ray diffractometer. Most modern X-ray diffractometers measure the XRD pattern (a plot of X-ray scattering intensity vs. diffraction angle 2θ) by rotating the X-ray source and the detector upward while maintaining the sample horizontal. As shown in Fig. 2, it is possible to identify the crystal phase contained in the sample from the XRD pattern and obtain the phase ratio, calculate the lattice constant from the diffraction peak positions, and extract the structural information, such as crystal quality (crystallite size and amount of random lattice strain), from the shape of the diffraction peaks. When quantifying the phase ratio, lattice constant, and crystal quality simultaneously, the whole pattern fitting (WPF) method — including the Rietveld method and Pawley method, which use profile fitting analysis by computer simulation of the entire XRD pattern21,22) — is used.


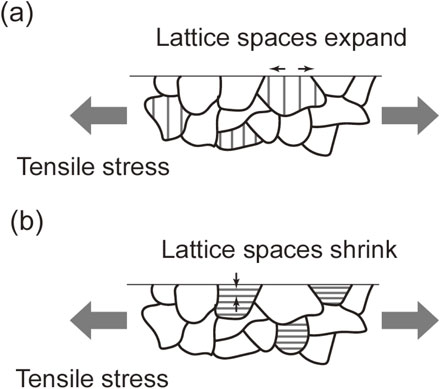
The sin2 ψ method23) is commonly used for residual stress measurement. As shown in Fig. 3, this method measures residual stress by utilizing the fact that the crystal lattice spacing differs depending on the measurement direction when stress is present. For example, when tensile stress exists in a certain direction near the surface, the lattice planes perpendicular to the surface are pulled, and their spacings become wider, and conversely, the lattice plane spacings parallel to the surface shrink according to the Poisson’s ratio. Figure 4 shows a schematic of measurements for the sin2 ψ method. Normally, the lattice spacing parallel and perpendicular to the incident X-ray direction are measured. The former is called the iso-inclination method (Fig. 4(b)) and is used for measuring residual stress in the horizontal direction. The latter is called the side-inclination method (Fig. 4(c)) and is used to measure residual stress in the vertical direction. Assuming the inclination angle of the lattice planes from the surface is ψ, the diffraction angle is 2θ, and the diffraction angle when there is no residual stress is 2θ0, the residual stress σφ in the in-plane direction φ (horizontal H or vertical V) can be expressed by the following equation, where E is the Young’s modulus, and ν is the Poisson’s ratio.
| \begin{equation}
\sigma_{\varphi} = -\frac{E}{2(1 + \nu)} \cdot \cot \theta_{0} \cdot \frac{\Delta 2\theta}{\Delta(\sin^{2}\psi)}
\end{equation}
| (1) |
shows a linear relationship between sin
2 ψ and the diffraction angle 2θ and indicates that the residual stress σ
φ can be calculated from the slope of a sin
2 ψ vs. 2θ plot. The proportional relationship in this formula is established on the premise that the measured region is a polycrystal with random orientation, the residual stress is uniform in the analyzed region, and there is no shear stress. Note that if these conditions are not satisfied, significant errors may occur in the measured residual stress values.
3. Interpretation of Manufacturing Process Using Temperature Simulation
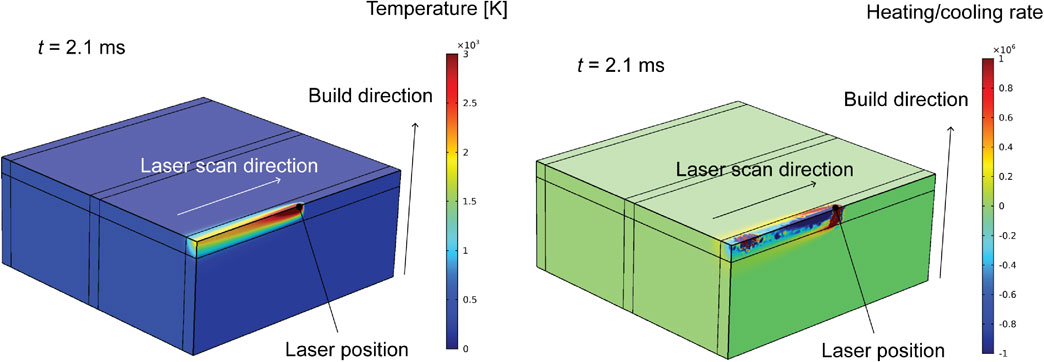
As mentioned above, the XRD method is a highly effective and simple method that can be used to evaluate the residual stress and crystal structure of the final part in detail. However, this is just an ex-situ measurement, and what is obtained here is the information at the time when the part reaches the final state through a complicated thermal history. From this final information alone, it is not always easy to elucidate how process conditions such as laser and electron beam power, scanning speed, and scanning direction scan strategy during the AM process affect the residual stress and phase stability. It would be ideal if in-situ measurements (in-situ observations) could be performed. However, it is necessary to incorporate an analysis system into an AM machine for in-situ measurement. Alternatively, it is possible to predict the thermal history, that is, the temperature distribution and heating and cooling rates of the part, using computer simulation based on the process conditions.24–27) The temperature at a certain time and position can be derived by solving the relational equations between the amount of heat input from the heat source, the amount of heat diffused by radiation from the heat sources, the surfaces of the powder bed and the built part, and the amount of heat diffused by conduction to the already built part and the base plate.24) Figure 5 shows an example simulation of the temperature and heating/cooling rate during the fabrication of a Ti–15Mo–5Zr–3Al alloy (wt%) using the laser powder bed fusion (L-PBF) technique. Using a numerical temperature simulation to understand the thermal history of the AM process when evaluating the structure observed by ex-situ XRD measurement helps to elucidate the effect of process conditions on the structure of the final part to some extent. In this review, an example of XRD analysis will be described; however, numerical temperature simulation is useful not only for XRD but also for interpreting other ex-situ analysis results.
4. Analysis Examples
4.1 Residual stress and phase transformation of β-type Ti–15Mo–5Zr–3Al
β-type Ti–15Mo–5Zr–3Al has a low Young’s modulus compared with other titanium-based alloys, and it is known to reduce the stress shielding caused by the elastic modulus mismatch between bone and implant.28,29) The Young’s modulus of β-type Ti–15Mo–5Zr–3Al at the polycrystalline state is 84.3 GPa,30) which is significantly lower than the 114 MPa3) of Ti–6Al–4V, a typical titanium-based alloy. This low Young’s modulus is realized by decreasing the shear modulus c′ of the β phase, which is body-centered cubic (bcc), owing to the low number of valence electrons e/a.31,32) Meanwhile, the β phase is stable when e/a is 5–6, which is higher than that of pure titanium, i.e., 4. Therefore, the low Young’s modulus is realized only in an unstable β phase with decreased e/a, and it is unclear whether the unstable β state and low Young’s modulus are always maintained during the AM process. AM-built parts are often heat-treated after fabrication to release residual stress. However, in the case of this material, the β phase may change to the α phase with heat treatment, so it is important to understand the as-built state.
In this series of analyses, we used Ti–15Mo–5Zr–3Al alloy powder (Osaka Titanium Technologies, Osaka) produced from an ingot using the argon gas atomization as the raw material; an M290 manufactured by EOS, Germany, as the L-PBF machine; and a Q10 manufactured by Arcam, Sweden, as the electron beam powder bed fusion (EB-PBF) machine. Rectangular column-shaped samples of 5 mm × 5 mm × 50 mm were fabricated under the conditions shown in Table 1. Figure 6 shows a scanning electron microscope image of the powder used for L-PBF, an example of the appearance of the final part, and a schematic of the part. Rigaku’s SmartLab was used for XRD measurement, and the XRD pattern and residual stress were measured at 10-mm intervals from Z = 5 mm to 45 mm on the XZ and YZ planes of the part.

Table 1 L-PBF and EB-PBF process conditions for Ti–15Mo–5Zr–3Al.
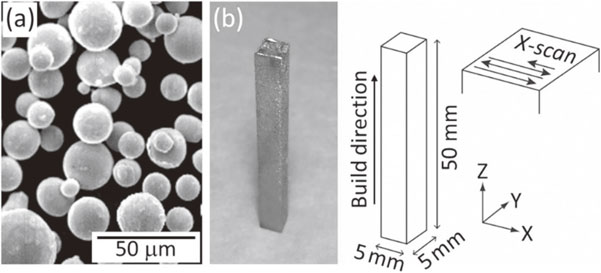
Figure 7 shows the results of horizontal (X) residual stress measurements (sin2 ψ plots) on the XZ plane (Z = 5 mm) of L-PBF-360W and EB-PBF-15mA. A large inclination is observed in the sin2 ψ plot at this measurement point, and tensile stress of 315 ± 16 MPa is observed. This stress tends to decrease as Z increases (building progresses), and the YZ plane perpendicular to the laser scanning direction has a lower stress value than that in the parallel XZ plane. L-PBF-75W, which has a low laser power and scanning speed, shows even lower stress values. Conversely, the sin2 ψ plot of EB-PBF-15mA shows almost no inclination, indicating no residual stress is observed. Similar results are observed for all Z positions, YZ planes, and EB-PBF-12.5mA. Based on the above, it is clear from this analysis, which systematically compares the parts made from the same starting material, that the L-PBF technique is more likely to generate residual stress than the EB-PBF technique.

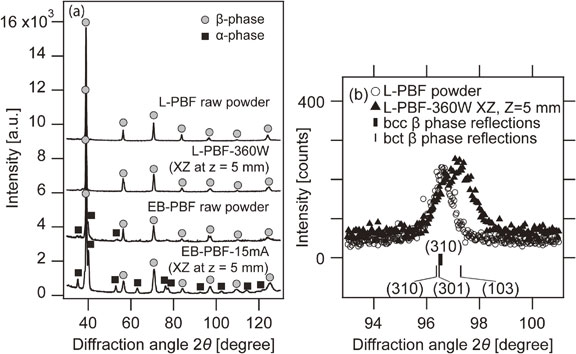
Figure 8(a) shows the XRD patterns of the raw material powders and PBF-360W and EB-PBF-15mA parts on the XZ plane (Z = 5 mm). This figure shows both the raw material powder and the fabricated part of L-PBF have a β single-phase structure. Meanwhile, the α phase appears in both the raw material powder and the fabricated part of EB-PBF. The raw material powder completely melts during the AM process. Therefore, we can say the α phase generated in the final part is not inherited from the raw material powder; instead, it formed after solidification due to the thermal history.
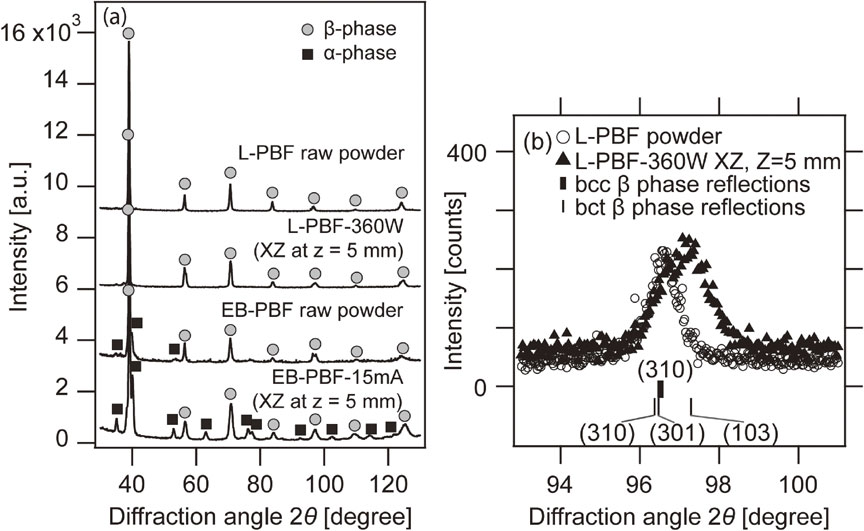
Figure 8(b) shows an enlarged view of the L-PBF raw material powder and the L-PBF-360W part around the diffraction peak β phase (310) plane. The raw material powder for L-PBF exhibits a single (310) diffraction peak. Meanwhile, the (310) peak of the L-PBF-360W part is separated into multiple diffraction peaks. This is due to the formation of a body-centered-tetragonal (bct) structure, with the c-axis shorter than the a-axis, caused by residual stress inducing a phase change from the bcc-β phase to the bct structure.28)
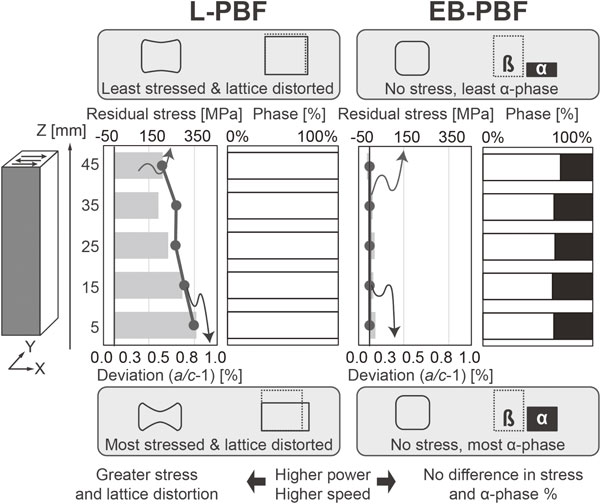
The WPF method was applied to the measured XRD data from five locations on each of the XZ and YZ planes for all four samples fabricated under the conditions shown in Table 1. For the L-PBF parts, the amount of change in the lattice constant from bcc to bct (deviation = (a/c − 1)%) was analyzed; and for the EB-PBF parts, the amount of α phase was analyzed. In addition, residual stress was analyzed for all samples. Figure 9 shows a summary of the results for the XZ planes of L-PBF-360W and EB-PBF-15mA as an example.
XRD analysis similar to that shown in Fig. 9 was performed on the XZ and YZ planes of the samples made under the four process conditions; and by interpreting the analysis together with the results of the numerical temperature simulation, the following becomes clear regarding the relationship between the process conditions and the structure of the final parts.28,29)
-
•
L-PBF causes significant residual stress, which causes a phase change from bcc to bct.
-
•
EB-PBF does not cause residual stress; meanwhile, a remarkable amount (up to 40 wt%) of α phase was generated. The amount of the generated α phase depends only on the Z position, regardless of the process conditions and the measurement surface. This result suggests that the phase change of β → α occurs as a result of the annealing effect from the preheating, which is unique to EB-PBF.
-
•
Of the four process conditions evaluated at this time, the L-PBF-75W, which is a low-power and low-scan-speed condition, has a relatively small temperature gradient during the AM process, so both the residual stress value and the amount of lattice strain are extremely small, and a structure with low residual stress and a single β phase, which is closest to the ideal, can be realized.
Ti–6Al–4V is an α + β type, and in addition to residual stress, the ratio of α phase to β phase and the fine structure greatly affect the mechanical properties of the final parts. Therefore, we introduce the analysis of residual stress, constituent phase, and crystal quality of Ti–6Al–4V fabricated using L-PBF and EB-PBF techniques while comparing both techniques.33) For the scan strategy of the heat source, an XY strategy that scans the X and Y directions alternately for each layer and a strategy to rotate the scan direction by 67° for each layer, in addition to the X scan strategy mentioned in the previous section, are used. Table 2 lists the process conditions.

Table 2 L-PBF and EB-PBF process conditions for Ti–6Al–4V.
Figure 10 shows an example of residual stress measurement results (sin2 ψ plots) on the XZ plane (Z = 5 mm) of L-PBF-360W-Fast-X and EB-PBF-900W-Slow-X.33) It is not as prominent as in the case of Ti–15Mo–5Zr–3Al; however, tensile stress was observed for L-PBF, while only small residual stress near the detection limit was observed for EB-PBF, and it is clear that the L-PBF technique tends to cause higher residual stress also for Ti–6Al–4V compared with the EB-PBF technique. Comparisons between L-PBF analysis results show no significant changes in stress values depending on the scan strategy. However, as in the case of Ti–15Mo–5Zr–3Al, the low-power, low-scan-speed L-PBF-75W series has a lower residual stress value than that of the L-PBF-360W series, and there is a tendency for the residual stress value on the YZ plane to be lower than that on the XZ plane.

Figure 11 shows an example of WPF analysis of an XRD pattern. This is the result of L-PBF-360W-Fast-X on the XZ plane (Z = 25 mm), and it shows that the main component is α or the α′ phase with the same crystal structure (α/α′ phase). However, a small amount of β phase is also observed. A small amount of β phase is observed in all L-PBF parts, but no β phase is observed in EB-PBF parts. In the WPF analysis of Ti–6Al–4V, the fundamental parameter method,34) which theoretically calculates the shape of the XRD peak from the geometry parameters, is used to accurately evaluate the crystallite size (a unit that produces coherent X-ray diffraction as a single crystal) and random lattice strain (variation in lattice spacing caused by lattice defects, etc.). For the samples manufactured under the 12 conditions shown in Table 2, XRD measurements were performed at all five locations on the front and back of XZ and YZ at 10-mm intervals from Z = 5 mm to 45 mm in the Z direction, and the correlation of the measurement results of all 240 points is shown.
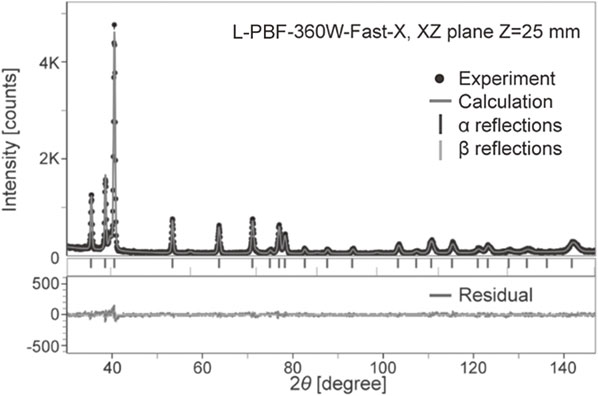
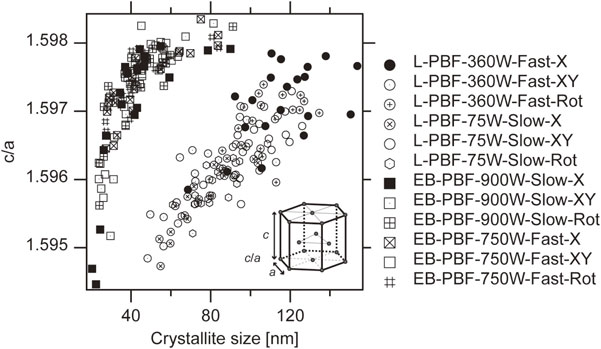
Figure 12 to 14 show the measurement results of all 240 points, generated by plotting the random lattice strain in the a-axis direction and c/a axis ratio of the α/α′ phase and phase ratio of the β phase (only for L-PBF samples with β phase), against the crystallite size. From these plots, it is clear that (1) there is a systematic difference between L-PBF and EB-PBF; and (2) the random lattice strain in the a-axis direction and the c/a-axis ratio of the α/α′ phase, and the phase ratio of the β phase all correlate with the crystallite size.

There are differences in crystal structure between the α phase and α′ phase, including the crystal defect density and lattice constant. It has been reported that compared with the α phase, the α′ martensite phase has a higher number of crystal defects that occur during phase transformation, and β-stabilizing elements are saturated, reducing the value of c/a is compared to that of the α phase.35,36) By comparing these reports with the above XRD analysis results and interpreting them together with the temperature simulation results, the following becomes clear regarding the relationship between the process conditions and the structure of the final parts.33)
-
•
Under the L-PBF process conditions used in this experiment, the cooling rate near the β transus temperature (991°C) is lower in the high-power and high-scan-speed conditions than in the low-power and low-scan-speed conditions.
-
•
For L-PBF, the cooling rate near the β transus temperature (991°C) greatly affects the final crystal quality. With slower cooling near this temperature (at high power and high scan speed), fewer crystal defects occur by quenching, and there is less random lattice strain of the α/α′ phase. At the same time, the saturation of the β stabilizing element (vanadium) in the α/α′ phase caused by quenching is alleviated. Additionally, the c/a axis ratio increases as the lattice constant of the α/α′ phase changes and the phase ratio of the β phase increases, resulting in an α + β structure. On the contrary, with faster cooling (at low power and low scan speed), a more α′ martensite-like phase with a higher degree of random lattice strain and a smaller
c/a axis ratio in the α/α′ phase appears. Conversely, the residual stress is greatly affected by the cooling rate immediately after solidification occurs. High power and high scan speed conditions cause a high cooling rate at the time of solidification, resulting in greater residual stress than the case of low power and low scan speed.
-
•
No residual stress is observed in the EB-PBF parts, and there is almost no structure dependence on the process conditions. Furthermore, no β phase is observed in any of the samples.
-
•
Z dependence is observed for both L-PBF- and EB-PBF-made parts. This is thought to occur because heat is directly released to the baseplate in the early stage of the building process (small Z), but in the latter half of the process, because of the distance from the baseplate, more heat given by the heat source escapes from the surface of the built part into a vacuum or noble gas. This causes the cooling rate to decrease during the building process gradually. For both L-PBF and EB-PBF techniques, in places where cooling is high in the first half of the building process, an α′ martensite-like structure with a large lattice strain and a small c/a axis ratio occurs; moreover, in places where cooling is low in the latter half of the building process, the lattice strain tends to decrease, and the c/a axis ratio tends to increase. Furthermore, for L-PBF products, the phase ratio of the β phase increases in the latter half of the building process.
5. Conclusion
In the PBF technique, the thermal history during and after solidification is exceptionally complicated. In addition, the final constituent phase of the titanium-based alloy changes depending on the alloy composition and thermal history.25,28,29,37,38) Furthermore, in recent years, attention has been paid to the control of crystal texture (crystal orientation) using the PBF technique.39–41) The process conditions that simultaneously achieve the reduction of residual stress and the formation of the desired crystal phase and crystal texture do not always match. When forming an unstable phase like the β-type Ti–15Mo–5Zr–3Al mentioned above, it is necessary to consider the effect of residual stress on the phase stability. Contrastingly, when forming a phase with solid phase transformation, such as α + β type Ti–6Al–4V, it is necessary to optimize the process conditions after evaluating not only the cooling rate immediately after solidification, which affects residual stress, but also the cooling rate near the β transus temperature, which affects the crystalline phase at the same time. Furthermore, when a laser is used as a heat source, the cooling rate has a large effect on residual stress and phase stability. Meanwhile, when using an electron beam, annealing by preheating affects phase stability primarily, so it is necessary to select an AM method in consideration of the different thermal histories corresponding to each heat source. It is essential to systematically and quantitatively evaluate and understand the relationships among the heat source, process conditions, residual stress, and crystallographic properties to realize a part with excellent mechanical properties that satisfy all structural requirements. The analysis method that combines the XRD technique and numerical temperature simulation introduced in this review is very effective for such research, and we hope that more researchers will gain relevant insights using these methods in the future.
Acknowledgments
This study was carried out with the support of the Japan Society for the Promotion of Science KAKENHI (S) (JP18H05254), Academic Transformation Area Research (A) “Ultra Temperature Field 3DP”, and the SIP (Strategic Innovation Creation Program) led by the Cabinet Office Phase 2 “Material Revolution by Integrated Material Development System” -C1 Area “Development of New Ni-Based Alloy 3D Laminated Modeling Process Utilizing MI” (Management Corporation: JST).
REFERENCES
- 1) Metal Prices in the United States Through 2010, (2012).
- 2) J. Allen: N. Atl. Treaty Organ. Rep. RTO-MP-AVT-139, (2006) 10.
- 3) A. Sidambe: Materials 7 (2014) 8168–8188. doi:10.3390/ma7128168
- 4) L.-C. Zhang and H. Attar: Adv. Eng. Mater. 18 (2016) 463–475. doi:10.1002/adem.201500419
- 5) T. Nakano and T. Ishimoto: KONA Powder Part. J. 32 (2015) 75–84. doi:10.14356/kona.2015015
- 6) T. DebRoy, H.L. Wei, J.S. Zuback, T. Mukherjee, J.W. Elmer, J.O. Milewski, A.M. Beese, A. Wilson-Heid, A. De and W. Zhang: Prog. Mater. Sci. 92 (2018) 112–224. doi:10.1016/j.pmatsci.2017.10.001
- 7) N. Ikeo, T. Ishimoto, A. Serizawa and T. Nakano: Metall. Mater. Trans. A 45 (2014) 4293–4301. doi:10.1007/s11661-014-2396-9
- 8) N. Ikeo, T. Ishimoto and T. Nakano: J. Alloy. Compd. 639 (2015) 336–340. doi:10.1016/j.jallcom.2015.03.141
- 9) J.L. Bartlett and X. Li: Addit. Manuf. 27 (2019) 131–149. doi:10.1016/j.addma.2019.02.020
- 10) P. Li, D.H. Warner, A. Fatemi and N. Phan: Int. J. Fatigue 85 (2016) 130–143. doi:10.1016/j.ijfatigue.2015.12.003
- 11) M. Megahed, H.-W. Mindt, N. N’Dri, H. Duan and O. Desmaison: Integrating Mater. Manuf. Innov. 5 (2016) 61–93. doi:10.1186/s40192-016-0047-2
- 12) J. Zhang, X. Wang, S. Paddea and X. Zhang: Mater. Des. 90 (2016) 551–561. doi:10.1016/j.matdes.2015.10.141
- 13) J.-P. Kruth, J. Deckers, E. Yasa and R. Wauthlé: Proc. Inst. Mech. Eng., Part B 226 (2012) 980–991. doi:10.1177/0954405412437085
- 14) J. Robinson, I. Ashton, P. Fox, E. Jones and C. Sutcliffe: Addit. Manuf. 23 (2018) 13–24. doi:10.1016/j.addma.2018.07.001
- 15) E.R. Denlinger, J.C. Heigel, P. Michaleris and T.A. Palmer: J. Mater. Process. Technol. 215 (2015) 123–131. doi:10.1016/j.jmatprotec.2014.07.030
- 16) J. Cao, M.A. Gharghouri and P. Nash: J. Mater. Process. Technol. 237 (2016) 409–419. doi:10.1016/j.jmatprotec.2016.06.032
- 17) C. Li, Z.Y. Liu, X.Y. Fang and Y.B. Guo: Procedia CIRP 71 (2018) 348–353. doi:10.1016/j.procir.2018.05.039
- 18) F. Martina, M.J. Roy, B.A. Szost, S. Terzi, P.A. Colegrove, S.W. Williams, P.J. Withers, J. Meyer and M. Hofmann: Mater. Sci. Technol. 32 (2016) 1439–1448. doi:10.1080/02670836.2016.1142704
- 19) P. Edwards and M. Ramulu: Mater. Sci. Eng. A 598 (2014) 327–337. doi:10.1016/j.msea.2014.01.041
- 20) N.S. Rossini, M. Dassisti, K.Y. Benyounis and A.G. Olabi: Mater. Des. 35 (2012) 572–588. doi:10.1016/j.matdes.2011.08.022
- 21) D.L. Bish and S.A. Howard: J. Appl. Cryst. 21 (1988) 86–91. doi:10.1107/S0021889887009415
- 22) G.S. Pawley: J. Appl. Cryst. 14 (1981) 357–361. doi:10.1107/S0021889881009618
- 23) SAE_HS-784 Residual Stress Measurement by X-Ray Diffraction_2003 Edition, (2003).
- 24) A. Bandyopadhyay and K.D. Traxel: Addit. Manuf. 22 (2018) 758–774. doi:10.1016/j.addma.2018.06.024
- 25) S.-H. Sun, K. Hagihara, T. Ishimoto, R. Suganuma, Y.-F. Xue and T. Nakano: Addit. Manuf. 47 (2021) 102329. doi:10.1016/j.addma.2021.102329
- 26) T. Todo, T. Ishimoto, O. Gokcekaya, J. Oh and T. Nakano: Scr. Mater. 206 (2022) 114252. doi:10.1016/j.scriptamat.2021.114252
- 27) O. Gokcekaya, T. Ishimoto, S. Hibino, J. Yasutomi, T. Narushima and T. Nakano: Acta Mater. 212 (2021) 116876. doi:10.1016/j.actamat.2021.116876
- 28) A. Takase, T. Ishimoto, R. Suganuma and T. Nakano: Scr. Mater. 201 (2021) 113953. doi:10.1016/j.scriptamat.2021.113953
- 29) A. Takase, T. Ishimoto, R. Suganuma and T. Nakano: Addit. Manuf. 47 (2021) 102257. doi:10.1016/j.addma.2021.102257
- 30) M. Tane, K. Hagihara, M. Ueda, T. Nakano and Y. Okuda: Acta Mater. 102 (2016) 373–384. doi:10.1016/j.actamat.2015.09.030
- 31) E.S. Fisher and D. Dever: Acta Metall. 18 (1970) 265–269. doi:10.1016/0001-6160(70)90033-7
- 32) S.-H. Lee, M. Todai, M. Tane, K. Hagihara, H. Nakajima and T. Nakano: J. Mech. Behav. Biomed. Mater. 14 (2012) 48–54. doi:10.1016/j.jmbbm.2012.05.005
- 33) A. Takase, T. Ishimoto, N. Morita, N. Ikeo and T. Nakano: Crystals 11 (2021) 796. doi:10.3390/cryst11070796
- 34) T. Ida, S. Shimazaki, H. Hibino and H. Toraya: J. Appl. Cryst. 36 (2003) 1107–1115. doi:10.1107/S0021889803011580
- 35) S.C. Wang, M. Aindow and M.J. Starink: Acta Mater. 51 (2003) 2485–2503. doi:10.1016/S1359-6454(03)00035-1
- 36) K. Sofinowski, M. Šmíd, I. Kuběna, S. Vivès, N. Casati, S. Godet and H. Van Swygenhoven: Acta Mater. 179 (2019) 224–236. doi:10.1016/j.actamat.2019.08.037
- 37) K. Cho, H. Kawabata, T. Hayashi, H.Y. Yasuda, H. Nakashima, M. Takeyama and T. Nakano: Addit. Manuf. 46 (2021) 102091. doi:10.1016/j.addma.2021.102091
- 38) M. Todai, T. Nakano, T. Liu, H.Y. Yasuda, K. Hagihara, K. Cho, M. Ueda and M. Takeyama: Addit. Manuf. 13 (2017) 61–70. doi:10.1016/j.addma.2016.11.001
- 39) T. Ishimoto, K. Hagihara, K. Hisamoto and T. Nakano: Addit. Manuf. 43 (2021) 102004. doi:10.1016/j.addma.2021.102004
- 40) T. Nagase, T. Hori, M. Todai, S.-H. Sun and T. Nakano: Mater. Des. 173 (2019) 107771. doi:10.1016/j.matdes.2019.107771
- 41) T. Ishimoto, K. Hagihara, K. Hisamoto, S.-H. Sun and T. Nakano: Scr. Mater. 132 (2017) 34–38. doi:10.1016/j.scriptamat.2016.12.038