Abstract
In order to avoid the formation of defects in additive manufacturing (AM) by powder bed fusion (PBF) process, it is crucial to understand the relationship between the quality of powder bed and a powder spreading process. In this study, the influences of conditions of powder raking process on the densities and homogeneity of powder bed have been examined by computer simulation using Discrete Element Method (DEM) and experiment of powder bed formation using a blade-type spreader for Ti–6Al–4V powder by way of example. The results were analyzed with a special focus on the effects of the relative size of powder particles with respect to the gap between the blade and the build platform. It has been clearly shown that the gap needs to be larger than the upper bound of the distribution of powder particles diameter to obtain a high-density powder bed. The DEM simulation indicated that the blade can sweep even powder particles that are not in direct contact with the blade when the powder particles are in a close-packed tetragonal configuration. This is the probable reason for the experimental fact that powder particles smaller than half of the gap are suitable for PBF.
This Paper was Originally Published in Japanese in J. JILM 72 (2022) 291–297.
1. Introduction
Fabrication of light metallic materials through additive manufacturing (AM) has attracted considerable attention in recent years. Among the various AM techniques available, powder bed fusion (PBF) has been most commonly used for metal AM.1–5) In PBF-type AM, the metal powder is raked on the surface of the build platform with a spreader, such as a blade, to form a powder bed. The powder bed is then melted and solidified using a laser or an electron beam. The 3D parts are manufactured by stacking the modelled layers over thousands to tens of thousands of times. The PBF-type AM enables control of the 3D shape and microstructure by controlling the process parameters. Despite these advantages, the application of PBF-type AM technology is currently limited to some aircraft parts, medical devices, and a prototyping of automobile parts.6) One of the reasons is that the reliability of the manufactured parts is guaranteed only when a specific part is manufactured using a specific material.
The mechanical properties of the parts fabricated through PBF-type AM are determined by its microstructure and the type and distribution of defects it contains, which largely depends on the process parameters. An inappropriate process parameter can cause defects in the fabricated part and the properties cannot be guaranteed.7,8) The mechanical properties of PBF-manufactured parts are guaranteed by optimizing the conditions through trial and error and inspecting the fabricated parts. However, achieving high-reliability production of a wide variety of free-form custom parts, which is the main feature of AM, requires optimizing the building conditions by a theoretical prediction. The process parameters that determine the melting and solidification conditions of the powder, e.g., beam power, beam scanning speed, and scanning path, can be tested at multiple levels in a single building experiment, and a large amount of data can be obtained.4,5,9,10) Meanwhile, properties of the powder bed, such as the volume fraction and the layer thickness, also significantly affect the quality of the manufactured parts,11) but it is difficult to control their levels. Parts with satisfactory quality and without defects can be manufactured using PBF-type AM only when the powder raking process conditions and beam-irradiation parameters are appropriate.12–14) Therefore, it is important to understand the effects of powder properties and raking process conditions on the properties of powder beds for quality assurance of the PBF-manufactured parts. Although there are several powder bed formation processes, common methods include the raking process15–19) wherein powder particles are spread by a blade, and the squeeze process, which compacts the upper surface of the powder layer into a smooth surface using a roller.20–24) A raking process with a simple mechanism has been particularly used in several cases. Although several studies have been conducted on the formation of powder beds through raking, there exist numerous unclear aspects regarding the relationships between powder properties, raking process conditions, and properties of the powder beds. Understanding these relationships can enable us to improve the quality of the fabricated component and reduce production costs by optimizing the conditions of the powder raking process. The discrete element method (DEM) simulation is effective, wherein the size distribution of powder particles can be set freely and the motion of each particle and the interaction between particles can be analyzed.25–27) Computational analysis can reveal the powder bed formation mechanism and identify the requirements for the stable formation of a dense and highly uniform powder bed.
This study aimed to identify the relationships between the powder properties, raking process conditions, and quality of the powder beds. We performed experiments on the angle of repose and corresponding DEM simulations to determine the interaction parameters among the particles. Thereafter, raking process simulations were performed using the determined interaction parameters. The simulations were verified by comparing them to the experiments, and an analysis of the particle behavior in the powder raking process was performed to identify the process optimization guidelines.
2. Methods
2.1 Experimental method
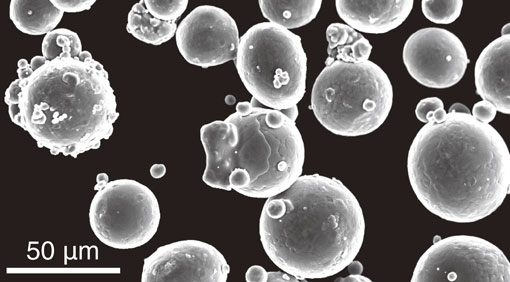
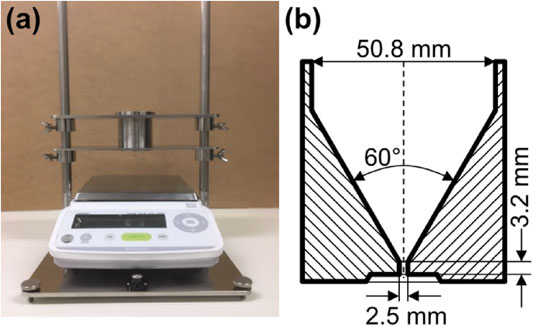
Figure 1 shows a scanning electron microscope image of the gas atomized powder of the Ti–6Al–4V alloy used in this study. Several particles have shapes close to a true sphere, some have shapes such that a portion protrudes from a large spherical particle, and some contain satellites. The Ti–6Al–4V alloy powder was classified into particle size ranges of below 45 µm, 45–75 µm, 75–106 µm, or 106–150 µm. The cohesive force of these powders was estimated by dropping them through a funnel onto a petri dish and measuring the angle of repose. Figure 2 shows the setup used for the angle of repose measurement and the schematic diagram of the metal funnel. The funnel was filled with 50 g of powder, which was then dropped onto a petri dish having a 60 mm diameter, which was placed onto an electric balance, and the angle of repose of the powder pile formed was measured. The distance between the metal funnel and petri dish was 50 mm. The angle of repose was measured three times for each powder classification. The measured angle of repose was used for estimating the cohesive force parameter in the DEM simulation.
The influence of the particle size and conditions of the powder raking process on the properties of the powder bed were investigated by performing a powder raking experiment using a metal laser PBF machine (EOS, M290). A stainless steel plate was used as the platform for forming the powder bed. Enough powder was placed on the edge of the platform plate to cover the entire platform and it was raked with a stainless steel blade. Ti–6Al–4V alloy powders with particle sizes in the ranges of 45–75 µm, 75–106 µm, and 106–150 µm were used to investigate the effect of particle size on powder bed properties. The raking speed v of the blade was 40 mm/s, and the width between the lower end of the blade and surface of the platform (gap height δ) was 150 µm. Powder with a particle size of 45–75 µm was also used to investigate the effects of the process parameters v and δ on the area ratio of the powder bed and the layer thickness. The experiments were performed under four conditions: two v levels of 40 mm/s and 150 mm/s, and two δ levels of 80 µm and 150 µm. The formed powder layer was observed from the top and sides using a digital microscope (KEYENCE, VW-9000). The area ratio of the powder layer was measured using the image analysis software ImageJ for the evaluation of the powder bed properties.
2.2 Simulation method
DEM simulations were performed using the large-scale atomic/molecular massively parallel simulator (LAMMPS) software.28) The cohesive force has a large effect on behavior because the particle size of the powder used for AM is small at several tens of micrometers. In this study, we adopted the Hertz-Mindlin model that includes the Johnson-Kendall-Roberts (JKR) model,29) which considers the influence of the van der Waals forces on the contact region, to add the cohesive force between powders in the contact model. The elastic force Fn in the normal direction is expressed in the JKR model as follows:
| \begin{equation}
F_{\text{n}} = - 4\sqrt{\pi \gamma E^{*}} a^{\frac{3}{2}} + \frac{4E^{*}}{3R^{*}}{a}^{3}
\end{equation}
| (1) |
where γ is the surface energy density and a is the radius of the contact surface.
E* is the effective Young’s modulus, and
R* is the effective radius; these are expressed as follows:
| \begin{equation}
E^{*} = \left(\frac{1-v_{i}^{2}}{E_{i}} + \frac{1 - v_{j}^{2}}{E_{j}} \right)^{-1}
\end{equation}
| (2) |
| \begin{equation}
R^{*} = \left(\frac{1}{R_{i}} + \frac{1}{R_{j}} \right)^{-1}
\end{equation}
| (3) |
where
E, ν, and
R are the Young’s modulus, Poisson’s ratio, and particle radius, respectively. In this study, the simulation was performed with the assumption that the particles are true spheres. First, the cohesive force was estimated using γ as a fitting parameter to match the angle of repose obtained in the experiments. Particle drop simulations were performed with γ values of 0, 0.1, 1, and 10 mJ/m
2. Similarly to the experiments, the powder was filled in a funnel and dropped. The simulation model was set to a 1/500 scale of the experiment owing to constraints on simulation time. The number of particles was 10,000 for the size range of 45–75 µm, 6,000 for 75–106 µm, and 4,000 for 106–150 µm. The angles of repose of the formed powder piles were measured and compared with those obtained in the experiments.
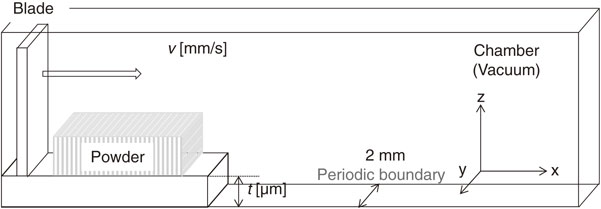
The powder raking process was simulated using the estimated γ values. Figure 3 shows a schematic illustration of the simulation model. The simulation box sizes in the x, y, and z directions were set to 60, 2, and 4 mm, respectively, and the y-direction was set as a periodic boundary condition. Particles were placed on the edge of the platform and raked by a blade. Ti–6Al–4V alloy powders with particle size ranges of 45–75 µm, 75–106 µm, and 106–150 µm were used. The same Young’s modulus of stainless steel as in the experiments was used as that of the platform for forming the powder layer. The layer volume of the powder was approximately the same: the number of powder particles was set to 10,000, 4,000, and 3,000 for simulations using particle size in the ranges of 45–75 µm, 75–106 µm, and 106–150 µm, respectively. The process conditions v and δ were set to 40 mm/s and 150 µm, respectively. Furthermore, powder with a particle size of 45–75 µm was used to perform raking simulations with different v and δ. Four simulations combining two levels of v (40 mm/s and 150 mm/s) and two levels of δ (80 µm and 150 µm) were performed. The area ratio of the powder bed formed in these raking simulations was compared with that formed in the experiments. In the area ratio evaluation, the observation area with a size of 60 mm in the x-direction and 2 mm in the y-direction was divided into sections with sizes of 400 µm in the x-direction and 500 µm in the y-direction (150 × 4 = 600 areas) to evaluate the area ratio in each section, and the standard deviation of the area ratio was used to evaluate the homogeneity.
Raking simulations using monodisperse particles were performed to investigate the effects of the relative size of powder particles with respect to the gap between the blade and platform. The following 11 particle sizes were tested: 50, 60, 70, 80, 90, 100, 110, 120, 130, 140, and 150 µm. The raking process for these powders was simulated under the conditions of v = 40 mm/s and δ = 150 µm. The number of particles in the simulation of each particle size was set such that the total volume of the powder was the same. The volume fraction and the average z-coordinate of particles were calculated from each powder bed, and their relationship with the particle size was investigated.
3. Results and Discussions
3.1 Estimation of cohesive force by angle of repose fitting
Figure 4 shows the powder pile formed in the experiments with the particle size in the ranges of 45–75 µm, 75–106 µm, and 106–150 µm, for which the angle of repose was measured at 25.6° ± 0.7°, 26.2° ± 0.2°, and 25.7° ± 0.3°, respectively. Negligible difference was observed in the angles of repose of the powder piles with different powder sizes. Table 1 shows the angles of repose of the powder piles formed in DEM simulations using various surface energy densities γ. A larger γ resulted in the formation of a larger angle of repose. Furthermore, there were no differences in the angles of repose owing to the difference in particle size for any γ value, and this tendency is the same as in the experiments. The angles of repose obtained in the experiments were reproduced when γ was 0.1 mJ/m2. Meier et al.27) performed powder drop experiments and corresponding DEM simulations using Ti–6Al–4V alloy powder with a particle size of 14–72 µm and reported that the experimental angle of repose was reproduced through DEM simulation using a γ range of 0.025–0.4 mJ/m2. The γ value determined in this study is within this range and the raking process simulations were performed using γ = 0.1 mJ/m2.
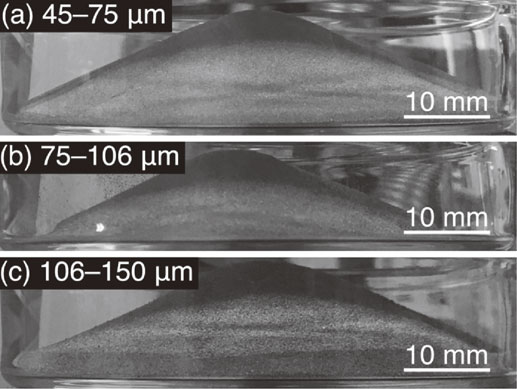
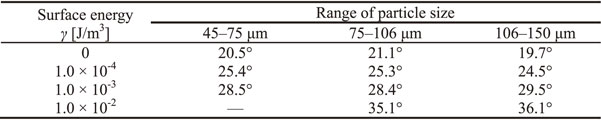
Table 1 Measured value of angle of repose in particle drop simulation.
Figure 5 shows the top- and side-view images of the powder beds formed in the raking process simulations with different particle-size distributions. The densest powder bed was formed in the raking experiment with a particle size range of 45–75 µm, and the powder bed containing many voids was formed using larger particle size distributions. The powder bed with a particle size of 106–150 µm had a particularly inhomogeneous volume-fraction distribution. Meier et al.16) reported that an inhomogeneous powder bed containing many voids was formed in the raking process DEM simulation wherein the gap height δ and maximum particle size were equal and suggested that the powder with a large particle size was greatly affected by v. The powder beds containing many voids that were formed in the present study are also assumed to have formed owing to the same mechanism. One-layer powder beds were formed in the simulations using powders with particle size ranges of 75–106 µm and 106–150 µm. However, there were approximately two layers of particles on other particle in the entire powder bed formed using powders with a particle size range of 45–75 µm.
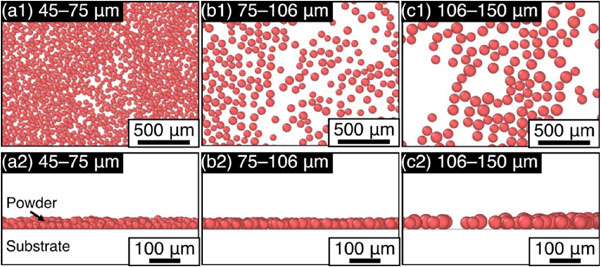
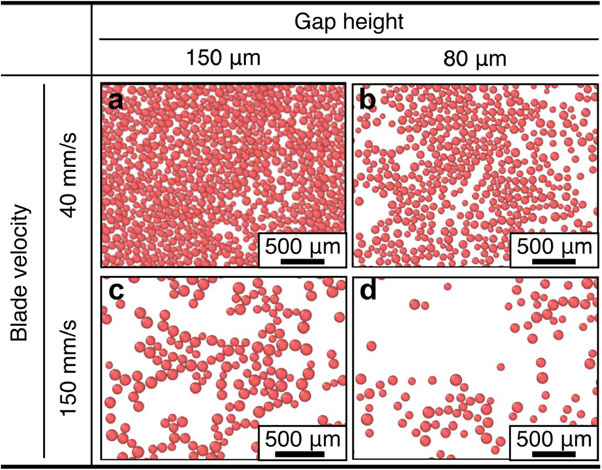
Figure 6 shows the simulated powder beds comprised of powder with a particle size of 45–75 µm formed under various v and δ conditions. When raking at δ = 80 µm, which was narrower than the conditions of v = 40 mm/s and δ = 150 µm (Fig. 6(a)), a sparse powder bed was formed (Fig. 6(b)). When raking at δ = 150 µm with a faster v = 150 mm/s, a sparser powder bed was formed (Fig. 6(c)), and at a faster v = 150 mm/s and narrower δ = 80 µm, the sparsest powder bed was formed (Fig. 6(d)).
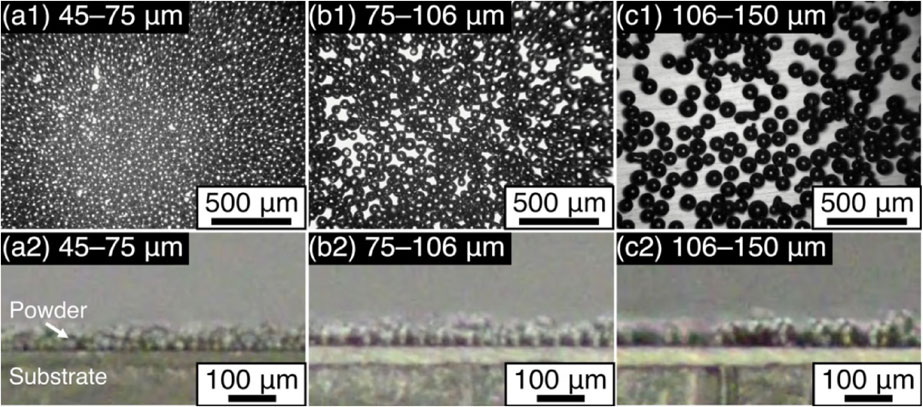
We performed raking experiments using powders with different particle size distributions and raking conditions to verify the DEM simulation results. Figure 7 shows a digital microscopic image taken from the top and sides of a powder bed formed through a raking experiment using particles with different particle size distributions. In raking experiments with powders with a particle size range of 45–75 µm (Fig. 7(a)), a densely packed powder bed was formed. Larger particle sizes resulted in the formation of sparser powder beds. Furthermore, powder beds formed in raking experiments that used powder with a particle size range of 45–75 µm (Fig. 7(a)) were not a single layer and multiple particles were on other particle. On the other hand, those formed using powders with particle size ranges of 75–106 µm (Fig. 7(b)) and 106–150 µm (Fig. 7(c)) exhibited the formation of a single-layer powder bed with no overlapping. The relation between these particle size ranges and the density of the formed powder bed was similar to that observed in the DEM simulations (Fig. 5). Figure 8 shows the digital microscopic images taken from the top of powder beds formed under different raking conditions. The particle size range of the powder used was 45–75 µm. By raking at a gap height of δ = 80 µm, which was narrower than the conditions of v = 40 mm/s and δ = 150 µm (Fig. 8(a)), a sparse powder bed was formed (Fig. 8(b)). Furthermore, by raking at δ = 150 µm and a faster v = 150 mm/s, a sparser powder bed was formed (Fig. 8(c)), and at a faster v = 150 mm/s and narrower δ = 80 µm, the sparsest powder bed was formed (Fig. 8(d)).

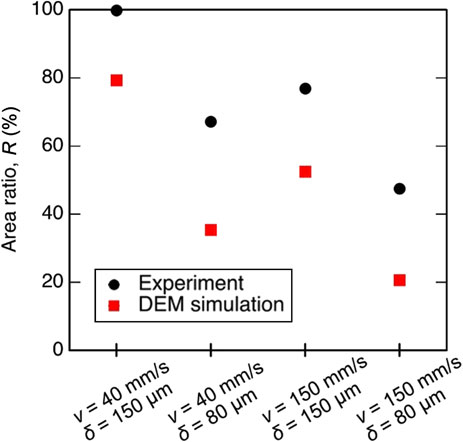
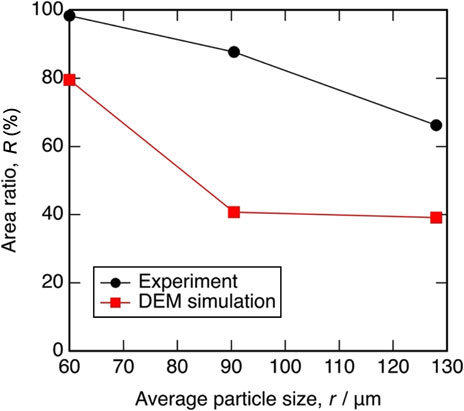
Figures 9 and 10 show the area ratios of the powder beds formed in the DEM raking simulations and experiments. An increased particle size decreased the area ratio in both simulations and experiments (Fig. 9). Furthermore, in the raking processes with different raking conditions, the area ratio of powder particles in the powder beds formed by both the simulation and the experiment decreased under the conditions of high blade speed and large gap height (Fig. 10). These results indicate that the DEM raking simulation that uses the calibrated cohesive force can qualitatively reproduce the experimental result with different particle size distributions and raking conditions. It is noteworthy that the area ratio of the formed powder bed was smaller in the DEM simulations than in the experiments for all conditions. In this study, DEM simulations were performed with the assumption that the powder is a perfectly spherical particle. However, actual powder particles contain several particles, as shown in Fig. 1, whose shape is unlike that of a true sphere (e.g., particles with irregular shapes or particles with small satellites). Furthermore, the simulations do not assume the wall and blade surface roughness at a size of several micrometers and the elastic deformation of particles. These differences in the particle shape and surface roughness between the simulations and experiments are assumed to have caused differences in the properties of the formed powder beds.
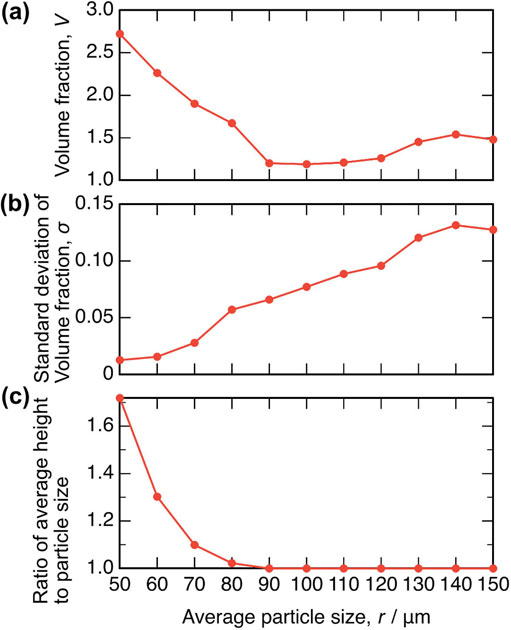
The DEM model that can quantitatively reproduce particle behavior was used to investigate the effects of the relative size of powder particles with respect to the gap between the blade and the platform using monodisperse particles with sizes between 10–150 µm. Figure 11 shows the volume fraction, standard deviation of the volume fraction, and normalized average z-coordinates of the particle size of the simulation that used monodisperse particles. A simulated powder bed comprised of monodisperse particles with a size smaller than 90 µm has a larger volume fraction (Fig. 11(a)). Moreover, simulations using particles larger than 90 µm showed that a larger particle size resulted in a slightly increased volume fraction. It is assumed that a larger particle size increased the volume occupied per particle, which accordingly increased the volume fraction of the powder. Figure 11(b) shows the standard deviations of the volume fraction that were calculated for the uniformity evaluation of these powder beds. The powder bed with a small standard deviation can be regarded as having high uniformity. A powder bed using a smaller particle size has a smaller standard deviation. This indicates that small powder particles form a more uniform powder bed. Figure 11(c) shows the average z-coordinate divided by the particle size. There is no particle on other particles when the normalized average z-coordinate equals 1. The value was 1 in the simulated powder bed using monodisperse particles with a particle size larger than 90 µm, and it had only one layer with no particles on other particles. In contrast, the overlapping can be observed in powders with particle sizes smaller than 80 µm, and a smaller particle size results in more overlapping of particles.
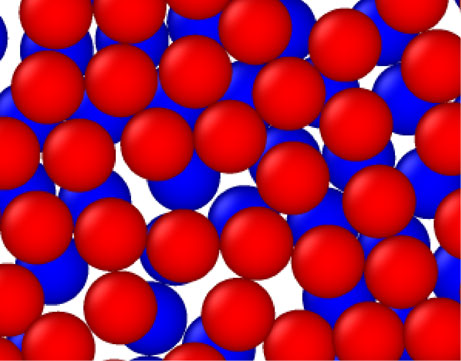
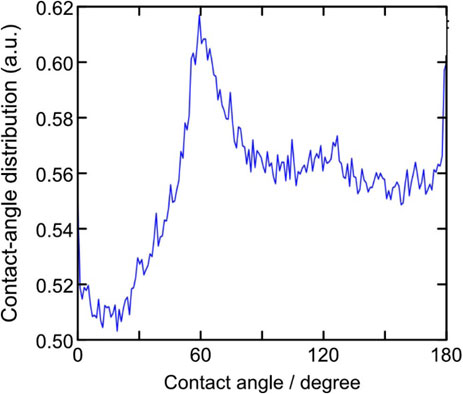
Raking simulations using different sizes of monodisperse particles were performed at a constant gap height of 150 µm. The powder beds formed with a particle size larger than 90 µm had a small volume fraction and no piling up of particles, whereas those with a particle size smaller than 80 µm had a larger volume fraction and more particles piling up. It was assumed that there was a threshold between 80 and 90 µm for determining powder-bed formation behavior. Therefore, the powder particle arrangement was investigated. Figure 12 shows the contact angle distribution between three adjacent particles near the blade in a powder raking simulation of monodisperse particles with a particle size of 80 µm. The contact angle of the particles has a peak of approximately 60°. This suggests that the arrangement near the blade has a shape close to an equilateral triangle during the raking process. Figure 13 shows a top-view of the two bottom layers of the powder bed near the rake blade. Particles with the regular tetrahedron and equilateral triangle arrangements can be observed. These contact-angle distributions and visualization images suggest that the particles have regular tetrahedron and equilateral triangle arrangements near the rake blade. The height H of particle cluster with a regular tetrahedron configuration can be represented as follows:
| \begin{equation}
H = \left(1 + \frac{\sqrt{6}}{2} \right)d
\end{equation}
| (4) |
where
d is the diameter of the particles. The
H of particle cluster with an equilateral triangle configuration can be described as:
| \begin{equation}
H = \left(1 + \frac{\sqrt{3}}{2} \right)d
\end{equation}
| (5) |
The diameter
d of particles with the regular tetrahedron and equilateral triangle arrangement should be smaller than 82.6 µm and 80.4 µm respectively for passing through a gap with the height δ of 150 µm. The relation between δ and
H can be the cause of the significant differences in the powder bed densities between for the case of particle size of 80 µm and that of 90 µm in the raking simulations. Generally, a powder bed with a high density is formed by using powder particles with a particle size smaller than one half of the gap height. This study suggests that two layers of particles in a regular tetrahedron or equilateral triangle arrangement can pass through when the gap height is larger than the twice of the particle size, and that this is important for the formation of dense powder beds. These results indicate that reducing the particle size under a certain gap height is effective for improving the density of the powder bed. In contrast, a decreased particle size resulted in the increases in the number of particles placed on other particles. To form a powder bed with no particle placed on other particles, a powder with particle size larger than 1/2 of the gap height must be used such that the particles in a tetrahedral or equilateral triangle arrangement cannot pass through the gap.
4. Conclusion
To elucidate the relationship between the particle size and formed powder bed properties in the PBF-type AM process, we investigated the formation behavior of the powder bed in the powder raking process through DEM simulations using the parameters estimated from experiments.
An increased surface energy density γ, which determines the magnitude of a cohesive force, increased the angle of repose of the powder pile formed in the powder drop simulations. The angle of repose obtained in the experiment was reproduced by the DEM simulation when γ was set to 0.1 mJ/m2.
The estimated γ was used in DEM powder raking simulations, and the powder-covered area ratio in the formed powder-bed decreased as the particle size increased. The area ratio of the powder bed also depended on the raking conditions, and a smaller gap height between the blade and the platform plate, and a faster blade speed resulted in a smaller area ratio. These trends qualitatively reproduced the powder bed formed in the raking experiment.
The raking simulation at a constant gap height of 150 µm using different sizes of monodisperse particles revealed that the volume fraction of the powder bed formed between 80 and 90 µm was different. Analysis of the raking process showed the formation of a regular tetrahedron or equilateral triangle arrangement by the particles near the raking blade, and it was suggested that the properties of the formed powder bed depended on whether the particles in a tetrahedron or equilateral triangle arrangement could pass through the gap height.
Acknowledgments
This work was partly supported by JSPS KAKENHI Grant Number JP17J06339, JP21H05018, JP21H05193. We would like to thank Mr. K. Kimura for assisting in the raking experiments.
REFERENCES
- 1) J.H. Martin, B.D. Yahata, J.M. Hundley, J.A. Mayer, T.A. Schaedler and T.M. Pollock: Nature 549 (2017) 365–369. doi:10.1038/nature23894
- 2) H. Bian, K. Aoyagi, Y. Zhao, C. Maeda, T. Mouri and A. Chiba: Addit. Manuf. 32 (2020) 100982. doi:10.1016/j.addma.2019.100982
- 3) J. Liu, W. Xiong, A. Behera, S. Thompson and A.C. To: Int. J. Solids Struct. 112 (2017) 35–42. doi:10.1016/j.ijsolstr.2017.02.024
- 4) T. Ishimoto, K. Hagihara, K. Hisamoto, S.H. Sun and T. Nakano: Scr. Mater. 132 (2017) 34–38. doi:10.1016/j.scriptamat.2016.12.038
- 5) S.H. Sun, K. Hagihara, T. Ishimoto, R. Suganuma, Y.F. Xue and T. Nakano: Addit. Manuf. 47 (2021) 102329. doi:10.1016/j.addma.2021.102329
- 6) Y. Koizumi, A. Chiba, N. Nomura and T. Nakano: Mater. Jpn. 56 (2017) 686–690. doi:10.2320/materia.56.686
- 7) S. Das: Adv. Eng. Mater. 5 (2003) 701–711. doi:10.1002/adem.200310099
- 8) J.P. Kruth, G. Levy, F. Klocke and T.H.C. Childs: CIRP Ann. 56 (2007) 730–759. doi:10.1016/j.cirp.2007.10.004
- 9) O. Gokcekaya, T. Ishimoto, S. Hibino, J. Yasutomi, T. Narushima and T. Nakano: Acta Mater. 212 (2021) 116876. doi:10.1016/j.actamat.2021.116876
- 10) Y. Miyata, M. Okugawa, Y. Koizumi and T. Nakano: Crystals 11 (2021) 856. doi:10.3390/cryst11080856
- 11) D.D. Gu, W. Meiners, K. Wissenbach and R. Poprawe: Int. Mater. Rev. 57 (2012) 133–164. doi:10.1179/1743280411Y.0000000014
- 12) F.J. Gürtler, M. Karg, M. Dobler, S. Kohl, I. Tzivilsky and M. Schmidt: 25th Annu. Int. Solid Free. Fabr. Symp. An Addit. Manuf. Conf., (The University of Texas at Austin, Austin, 2014) pp. 1099–1117.
- 13) Y.S. Lee and W. Zhang: 26th Solid Free. Fabr. Symp., (The University of Texas at Austin, Austin, 2015) pp. 1154–1165.
- 14) S. Ziegelmeier, P. Christou, F. Wöllecke, C. Tuck, R. Goodridge, R. Hague, E. Krampe and E. Wintermantel: J. Mater. Process. Technol. 215 (2015) 239–250. doi:10.1016/j.jmatprotec.2014.07.029
- 15) Y. Zhao, Y. Koizumi, K. Aoyagi, K. Yamanaka and A. Chiba: Mater. Today Proc. 4 (2017) 11437–11440. doi:10.1016/j.matpr.2017.09.023
- 16) C. Meier, R. Weissbach, J. Weinberg, W.A. Wall and A.J. Hart: J. Mater. Process. Technol. 266 (2019) 484–501. doi:10.1016/j.jmatprotec.2018.10.037
- 17) Z. Snow, R. Martukanitz and S. Joshi: Addit. Manuf. 28 (2019) 78–86. doi:10.1016/j.addma.2019.04.017
- 18) W. Nan, M. Pasha, T. Bonakdar, A. Lopez, U. Zafar, S. Nadimi and M. Ghadiri: Powder Technol. 338 (2018) 253–262. doi:10.1016/j.powtec.2018.07.030
- 19) H. Chen, Q. Wei, S. Wen, Z. Li and Y. Shi: Int. J. Mach. Tools Manuf. 123 (2017) 146–159. doi:10.1016/j.ijmachtools.2017.08.004
- 20) W. Yan, Y. Qian, W. Ge, S. Lin, W.K. Liu, F. Lin and G.J. Wagner: Mater. Des. 141 (2018) 210–219. doi:10.1016/j.matdes.2017.12.031
- 21) J. Zhang, Y. Tan, T. Bao, Y. Xu, X. Xiao and S. Jiang: Materials 13 (2020) 2285. doi:10.3390/ma13102285
- 22) E.J.R. Parteli and T. Pöschel: Powder Technol. 288 (2016) 96–102. doi:10.1016/j.powtec.2015.10.035
- 23) L. Wang, E.L. Li, H. Shen, R.P. Zou, A.B. Yu and Z.Y. Zhou: Powder Technol. 363 (2020) 602–610. doi:10.1016/j.powtec.2019.12.048
- 24) H. Chen, Y. Chen, Y. Liu, Q. Wei, Y. Shi and W. Yan: Int. J. Mach. Tools Manuf. 153 (2020) 103553. doi:10.1016/j.ijmachtools.2020.103553
- 25) P.W. Cleary and M.L. Sawley: Appl. Math. Model. 26 (2002) 89–111. doi:10.1016/S0307-904X(01)00050-6
- 26) Z. Xiang, M. Yin, Z. Deng, X. Mei and G. Yin: J. Manuf. Sci. Eng. 138 (2016) 1–9. doi:10.1115/1.4032970
- 27) C. Meier, R. Weissbach, J. Weinberg, W.A. Wall and A. John Hart: Powder Technol. 343 (2019) 855–866. doi:10.1016/j.powtec.2018.11.072
- 28) S. Plimpton: J. Comput. Phys. 117 (1995) 1–19. doi:10.1006/jcph.1995.1039
- 29) K.L. Johnson, K. Kendall and A.D. Roberts: Proc. R. Soc. London, Ser. A 324 (1971) 301–313. doi:10.1098/rspa.1971.0141