1. Introduction
Ti2AlNb phase-based titanium intermetallic alloys have been receiving a lot of attention as candidate materials for high temperature applications.1) Since the Ti2AlNb phase has an ordered orthorhombic structure, this phase is referred to as the O phase, thus the Ti2AlNb-based alloys are often called orthorhombic alloys.1,2) A typical orthorhombic alloys studied to date is the Ti–22Al–27Nb alloy,3–7) in which the high temperature B2 phase (CsCl-type structure) is incorporated in the phase constitution to further improve fracture toughness and ductility. A primary disadvantage of this alloy, however, is that its yield stress and tensile strength drop sharply at temperatures higher than 923 K.8,9) Further, this alloy contains a large amount of expensive Nb.
The authors have long been engaged in research to develop new types of orthorhombic alloys with both reduced Nb content and high temperature properties superior to those of Ti–22Al–27Nb alloy.10–15) So far, we have succeeded in developing a new type of orthorhombic alloy with reduced niobium (Nb) content: the Ti–22Al–11Nb–2Mo–1Fe alloy.14,15) This alloy was developed by substituting β-phase stabilizing elements such as Mo, W, V, and Fe for a portion of the Nb in a Ti–22Al–27Nb alloy. The resultant phase constitution consisted of the O phase as a major phase and the B2 phase.
Although this (O + B2)-type Ti–22Al–11Nb–2Mo–1Fe alloy shows greater strength than Ti–22Al–27Nb, the use temperature is limited to 1023 K, judging from the results of an extensive creep test.10,11,15) The use temperature of the lightweight and high strength γ-TiAl titanium intermetallic alloy is said to be 1123 K.16) Thus, we must continue to explore the high temperature capability of orthorhombic alloys comparable to γ-TiAl.
There exists an (O + α2) phase region in the Ti–Al–Nb ternary phase diagram. The α2 phase is said to be stronger than the B2 phase at higher temperature.17) Therefore, it was anticipated that the orthorhombic alloy in which the α2 phase is incorporated in the alloy constitution will show higher strength above 1023 K. Based on this anticipation, another type of alloy, Ti–27.5Al–13Nb, was newly designed.17)
One drawback of this (O + α2)-type Ti–27.5Al–13Nb alloy is its very limited tensile ductility at room temperature (RT), especially when its microstructure is modified to a fully lamellar microstructure.17) For this alloy to be considered sufficiently reliable for use, some measures must be taken to improve its ductility. Grain refinement is known to be an effective method for improving ductility.6) To refine the grain, the authors tried to add a minor amount of boron (B) in this Ti–27.5Al–13Nb alloy,18) since it is reported that TiB formed during the solidification process acts as obstacle against grain growth,19) and we found that the prior β-grain sizes of this alloy in the as-cast condition was reduced by about an order of magnitude, from 1200 to 200 µm, by the addition of 0.1 pct B.18) As another means to improve ductility, the microstructure of this alloy was modified to a duplex by applying a thermomechanical treatment, in which hot deformation of the alloy is performed in the high temperature (B2 + α2) two-phase region, followed by annealing in the same (B2 + α2) two-phase region. By subsequent stabilization annealing in the (O + α2) two-phase region existing on the low temperature side, the B2 phase transforms into the (O + α2) lamellar microstructure.17,18) Consequently, a duplex microstructure consisting of a globular α2 phase and an (O + α2) lamellar microstructure was obtained. By applying these two grain-refining methods separately or concurrently, the RT ductility was markedly increased. For example, the 0.1 pct elongation for B-free alloy with a lamellar microstructure was increased to 4.3 pct by the modification to a duplex microstructure.
Creep is an important property for high temperature applications. Therefore, in a previous study, we evaluated the creep properties of this Ti–27.5Al–13Nb alloy at 1023 K under 250 MPa stress and discussed the creep mechanism operating in this alloy under different microstructural conditions.18)
Since titanium material is often used in automobile and aircraft parts such as turbine blades, turbine discs, and spring coils, where very low alternating or cyclic stresses operate constantly and the service life extends well into the very high cycle (VHCF) regime, both fatigue and creep are regarded as the most important characteristics for such applications. The γ-TiAl alloy can be considered a promising candidate alloy for use in such parts. However, because this alloy is quite brittle at RT, the application will be limited due to the risk of failure during service.
Since this Ti–27.5Al–13Nb alloy was found to have adequate RT ductility, that is, to have sufficient material reliability, this alloy will have the potential to be used in such automobile and aircraft parts where high cycle fatigue (HCF) and VHCF properties are main concerns. Therefore, it is important to understand the fatigue characteristics of this alloy before use.
In the present study, first, the HCF properties of the B-free Ti–27.5Al–13Nb alloy with either a lamellar microstructure or duplex microstructure were measured. The VHCF properties of the B-free and 0.1 pct B-modified alloys with lamellar microstructures were then measured, and the results were compared with those of conventional (α + β)-type Ti–6Al–4V and Ti–4.5Al–2.5V–1.5Fe alloys obtained from the previous20) and present studies, respectively.
While observing the fatigue fracture surfaces of the Ti–27.5Al–13Nb alloy after the HCF test, we found the formation of well-defined striations on the fatigue propagation area. This prompted us to recheck the fatigue fracture surfaces of previously fatigue-tested B-free and 0.1 pct B-modified Ti–6Al–4V.20) Consequently, we recognized the formation of striations. Therefore, we performed a precise striation analysis for these two alloys, including the observation of striation spacings on SEM photographs, the counting of striations, and the subsequent estimation of the fatigue lives spent in the fatigue initiation stage and the fatigue propagation stage.
3. Results and Discussion
3.1 Microstructures
With the addition of 0.1 pct B, the prior B2 grain size in the as-cast condition was reduced drastically, from 600∼1200 µm for the B-free alloy to 100∼250 µm.18,20)
Figure 1 shows the lamellar and duplex microstructures of B-free and 0.1 pct B-modified Ti–27.5Al–13Nb alloys taken on planes parallel to the rolling direction. When the B-free alloy was cooled from the single B2 phase region, a typical lamellar microstructure with similarly aligned α2 phase lamellae (seen as a white contrast phase) within the prior B2 grains and a massive α2 phase at the grain boundaries17,18) were observed (Fig. 1(a)). The O phase (seen as a black contrast phase) was present as thin laths between the α2 phase lamellae. In the 0.1 pct B-modified alloy (Fig. 1(b)), long and narrow black bands composed of an agglomerate of TiB were aligned along the rolling direction.20–22) The width of each TiB was 1∼2 µm, and the aspect ratio of the width to the length was ∼10.18) Due to the presence of these streaks of TiB, the growth of B2 grains was blocked when the alloy was held in the single B2 phase region, and thus the B2 grain size was greatly reduced. In conjunction with this B2 grain refinement, a reduction of colony size was observed, which went from ∼500 µm to ∼70 µm by the addition of 0.1 pct B. Accordingly, each α2 phase lamella was shortened significantly and widened.
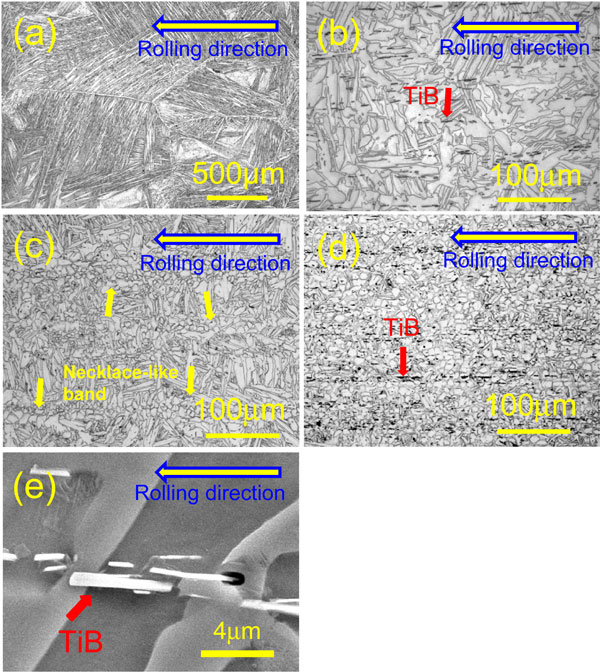
When the hot bar-rolled B-free alloy was annealed at 1373 K in the (B2 + α2) two-phase region, and subsequently stabilization-annealed at 1223 K for 118.8 ks, a duplex microstructure composed of globular α2 phases and fine lamellar microstructures was obtained (Fig. 1(c)). It should be noted that a homogeneous distribution of globular α2 phases was not attained, but rather the α2 phases were arranged in a necklace-like band along the rolling direction as shown by arrows in Fig. 1(c). In their work on an (O + B2)-type orthorhombic alloy, Emura et al.18,23) attributed the formation of such a necklace-like band of α2-phases to the inhomogeneous distribution of solute Nb elements inherited from the dendritic segregation of this high melting point element in the ingot. In the 0.1 pct B-modified alloy, many of the globular α2 phases formed over almost the entire area, and thus the area of the lamellar microstructure surrounded by these globular α2-phases was very limited or completely diminished (Fig. 1(d)). Careful observation of the micrograph revealed that each TiB is embedded by a globular α2 phase (Fig. 1(e)), which indicates that TiB acts as a nucleation site for globular α2 phase formation. Therefore, the increased number of nucleation sites in B-modified alloy compared to B-free alloys would be responsible for the formation of the globular α2 phase over almost the entire area.
The B-free Ti–6Al–4V alloy showed a typical lamellar microstructure with packets or colonies of similarly aligned α phase lamellae and β phases between lamellae, and a massive α phase at the grain boundaries.20) In the 0.1 pct B-modified alloy, the growth of β-grains was blocked due to the presence of streaks of TiB. Accordingly, the morphology of the lamellar microstructure looked seemingly like an equiaxed microstructure. Very similar equiaxed microstructures with an α grain size of about 8 µm were obtained for both B-free and 0.1 pct B-modified Ti–6Al–4V alloys.20) Similar to the Ti–27.5Al–13Nb and Ti–6Al–4V alloys, a refined lamellar microstructure was obtained for the 0.1 pct B-modified Ti–4.5Al–2.5V–1.5Fe alloys. Since the beta phase stability in this alloy is higher compared to other (α + β)-type alloys such as Ti–6Al–4V, lamellar microstructures somewhat similar to the Widmanstatten structure was obtained in both B-free and 0.1 pct B-modified alloys.
3.2 Tensile properties
The tensile data at RT for the Ti–27.5Al–13Nb alloy with either the lamellar or duplex microstructure are shown in Table 1. The B-free alloy exhibited a total elongation value of 0.1 pct. It seems that the very large prior B2 grains caused by holding in the single B2 phase region are responsible for the extremely low elongation value. The addition of 0.1 pct B to the alloy increased the total tensile elongation value from 0.1 pct to 0.8 pct due to the reduction of the grain size, and this addition increased the tensile strength from 404 MPa to 581 MPa. However, an elongation value of 0.8 pct is not sufficient to make it a reliable structural material. For alloys with duplex microstructures, the tensile elongation increased from 4.3 pct for B-free alloy to 6.1 pct by the addition of 0.1 pct B, and the tensile strength increased from 668 MPa to 726 MPa. As Table 1 shows, the positive effect of the addition of 0.1 pct B on the ductility and tensile strength were similarly seen in both Ti–6Al–4V and Ti–4.5Al–2.5V–1.5Fe alloys.

Table 1 Tensile properties at room temperature of B-free and 0.1 pct B-modified Ti–27.5Al–13Nb alloys with either a lamellar or duplex microstructure together with those of Ti–6Al–4V and Ti–4.5Al–2.5V–1.5Fe.
The HCF diagrams, i.e., maximum stress, σmax, vs. the number of cycles to failure relationship, of the B-free Ti–27.5Al–13Nb alloy having either a lamellar or duplex microstructure are shown in Fig. 2. The diagrams clearly indicate that the modification from a lamellar to a duplex microstructure greatly improved HCF strength over the whole cycle range up to 107 cycles. This microstructure modification increased HCF strength at 107 cycles from 400 MPa to 550 MPa. It is known that the two main factors augmenting the HCF strength of Ti alloys are an improvement in tensile strength and microstructural refinement.7,21,24–26) To clarify the contribution of the improved tensile strength, it is necessary to know the tensile strengths or the 0.2 pct yield stresses of these two microstructures. However, as shown in Table 1, this alloy was fractured before attaining the 0.2 pct yield stress value. Therefore, we need to estimate this value in some way. According to our previous study on the microstructure/property relationships of a (B2 + O)-type Ti–22Al–11Nb–2Mo–1Fe alloy,24) the duplex microstructure showed a higher 0.2 pct yield stress than the lamellar microstructure, and the difference in 0.2 pct yield stress between the two microstructures was 64 MPa. This value might be considered a small difference, and thus the contribution of the improved tensile strength to HCF strength appears not to be very significant. Therefore, the superior HCF strength exhibited by this alloy with a duplex microstructure can be attributed to the microstructure refinement.

To compare the HCF diagrams of the Ti–27.5Al–13Nb alloy with those of Ti–6Al–4V, Fig. 2 shows our previous data for this alloy obtained under the same experimental conditions, including with respect to the specimen size and fatigue loading frequency.20) This allows for a direct comparison between the two alloys while keeping other factors influencing the fatigue data equal. This comparison indicates that the overall HCF behavior of the present Ti–27.5Al–13Nb alloy was considerably inferior to that of the Ti–6Al–4V alloy. The inherent lower deformation ability that intermetallic phases generally have due to their limited glide planes3) would be responsible for such inferior fatigue behavior. Note, however, that the HCF strength of B-modified Ti–27.5Al–13Nb with a duplex microstructure achieved the same level of that of a conventional Ti–6Al–4V with a lamellar microstructure.
3.4 Very high cycle fatigue (VHCF) property of B-free and B-modified Ti–27.5Al–13Nb alloys with lamellar microstructures
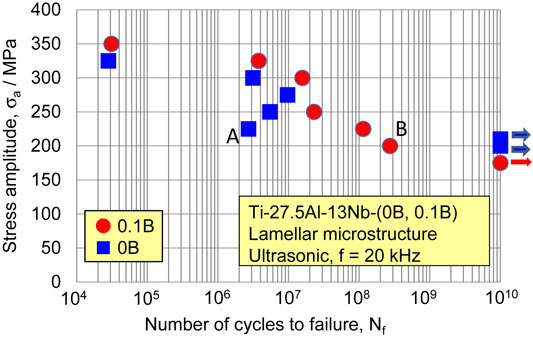
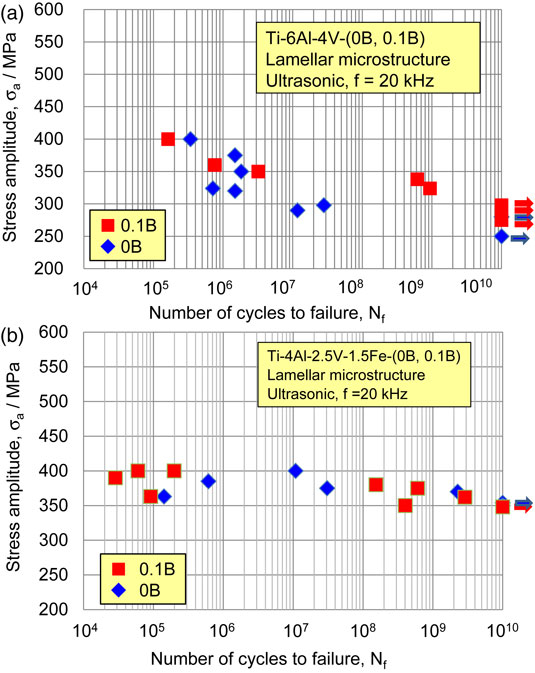
To investigate other fatigue characteristics, we attempted to evaluate the VHCF properties of the B-free and 0.1 pct B-modified Ti–27.5Al–13Nb alloys with lamellar microstructures, as shown in Fig. 3. As the figure shows, both alloys exhibited the same fatigue strength in the cycle range of to 1010 cycles, i.e., the addition of 0.1 pct B had no effect on VHCF behavior. At an applied stress amplitude below about 200 MPa, both alloys were run-outs beyond 1010 cycles.
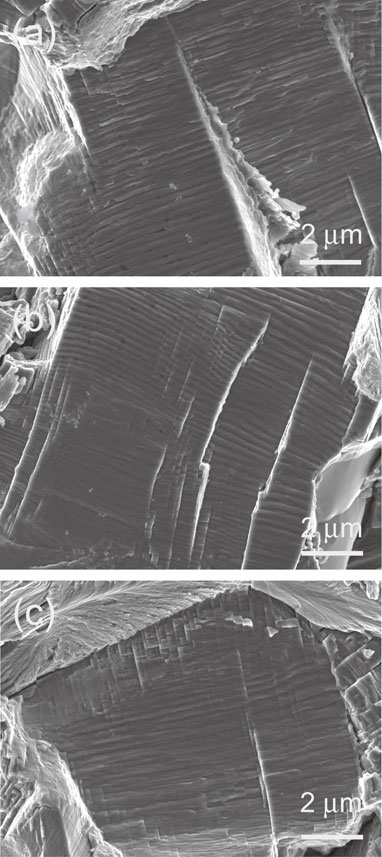
Figure 4 shows the SEM micrographs of the typical VHCF fracture surfaces of Ti–27.5Al–13Nb alloys with lamellar microstructures. The B-free alloy (marked A in Fig. 3; stress amplitude, σa = 225 MPa, number of cycles to failure, Nf = 2.716 × 10⁶ cycles) showed a very rough fracture morphology, whereas a very flat surface was observed for the 0.1 pct B-modified alloy (marked B in Fig. 3; stress amplitude, σa = 200 MPa, number of cycles to failure, Nf = 2.734 × 10⁸ cycles).
For the sake of comparison, Fig. 5 shows the VHCF curves that we previously obtained for B-free and 0.1 pct B-modified Ti–6Al–4V alloys with lamellar microstructures,20) as well as those for B-free and 0.1 pct B-modified Ti–4Al–2.5V–1.5Fe alloys with lamellar microstructures obtained in the present study. Similar to the curves for the Ti–27.5Al–13Nb alloy, VHCF data for B-free and 0.1 pct B-modified alloys overlapped each other in the case of two alloys and were run-outs beyond 1010 cycles at an applied stress amplitude below about 300 MPa and 350 MPa, respectively. Thus, these three sets of VHCF data will lead to the conclusion that the fatigue data for the B-free alloy coincide with those for the B-modified alloy irrespective of the compositions of either alloy in the VHCF region. Another remark derived from Figs. 3 and 5 is that data for both Ti–6Al–4V and Ti–4Al–2.5V–1.5Fe alloys are more highly ranked than the set for the B-free and B-modified Ti–27.5Al–13Nb alloys. This will be a strong manifestation of the less deformable nature of intermetallic alloys compared to conventional Ti alloys.3)
We previously investigated the fatigue behavior of B-free and 0.1 pct B-modified Ti–6Al–4V alloys with either an equiaxed or lamellar microstructure in the HCF range (cycle range from ∼104 up to 107 cycles).20) The HCF data in that study were obtained using the remaining hourglass-shaped specimens prepared for the VHCF tests of the Ti–6Al–4V alloy. These previous findings and discussions about the Ti–6Al–4V alloy will help us to analyze the fatigue mechanism of the present B-free and 0.1 pct B-modified Ti–27.5Al–13Nb alloys in the VHCF range. Our previous study clearly demonstrated that, contrary to the VHCF results (Fig. 5), the 0.1 pct B-modified Ti–6Al–4V alloy exhibited considerably prolonged HCF life for both the lamellar and the equiaxed microstructures at RT compared to those of the B-free counterparts. However, the beneficial effect of the addition of B was highly dependent on the level of applied stress. In other words, this effect was gradually diminished with decreasing stress level, and the HCF lives or strength of the B-free and B-modified alloys coincided below a certain stress level in each microstructure. It is natural to expect that this coincidence was maintained thereafter in the VHCF region.
In our previous paper, we attributed this improvement in the HCF strength of Ti–6Al–4V alloys with equiaxed and lamellar microstructures to the inhibitory effect of TiB against fatigue crack extension.20) We also tentatively discussed the mechanism responsible for this differential effect of TiB depending on the extent of applied stress, as follows.20) During the HCF test where the application of stress is sufficiently high, the impact between the front of the moving fatigue crack and the TiB generates a greater backward force to the moving fatigue crack, thereby slowing the extension of the fatigue crack, which in turn prolongs the HCF life. On the other hand, when the applied stress is lower, i.e., in the VHCF range, the impact force and backward force will not be as high, which means that the TiB is no longer a barrier to the movement of the fatigue crack and thus causes no delayed movement of the fatigue crack front, leading to coincidence between the fatigue lives of the B-free and B-modified alloys. Since, as discussed later in this paper, most of fatigue life is spent in the fatigue initiation stage, the differential effect of TiB depending on the extent of applied stress in the initiation stage will mainly determine the degree of prolonged fatigue life.
The fatigue mechanism underlying the present finding that the B-free and B-modified Ti–27.5Al–13Nb alloys with lamellar microstructures exhibited the same fatigue strength in the cycle range to 1010 cycles, i.e., the finding that the addition of 0.1 pct B had no effect on VHCF behavior, can be explained in the same manner as for the Ti–6Al–4V alloy just described above.
3.5 Fatigue striation analysis
We have observed the formation of striation in both Ti–27.5Al–13Nb alloy and Ti–6Al–4V alloys. Therefore, we performed the precise striation analysis for these two alloys.
3.5.1 SEM observation of fatigue striation
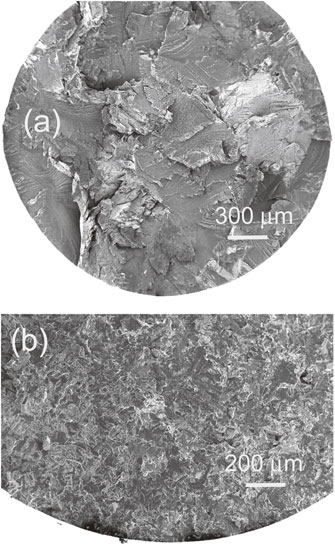
Figure 6 shows a low magnification SEM micrograph of the fatigue fracture surface taken from the B-free Ti–27.5Al–13Nb alloy with a duplex microstructure (marked A in Fig. 2), which exhibited three different morphological appearance, consisting of a fatigue initiation region (stage I), followed by a smooth region representing the crack propagation region (stage II) and finally the fast fracture region (stage III). The fatigue crack initiation site is indicated by a blue circle. Similar to other conventional titanium alloys such as Ti–6Al–4V20) and Ti–6Al–2Sn–4Zr–2Mo–0.1Si,24) the fatigue fracture initiated not from the surface site but rather from the subsurface site. The reasons for this subsurface initiation observed in titanium alloys especially when fatigue tests were conducted in tension-tension mode have been discussed in detail elsewhere.27,28)

Figure 7 shows higher magnification SEM micrographs taken from the fatigue initiation region and the fast fracture region. The micrographic positions are marked A and E, respectively, in Fig. 6. In the fatigue crack initiation region, there existed multiple clusters of facets (Fig. 7(a)). Since each facet exhibited a smooth morphological aspect, and since the size of each facet corresponded to the diameter of an equiaxed O-phase grain, it seemed that the fatigue crack proceeded by the slip mechanism through the interior of O-phase grains. A very rough fracture morphology with river patterns was observed in the fast fracture region, as shown in Fig. 7(b) (marked E in Fig. 6). The two boundary curves in Fig. 6, one of which divides the region between the fatigue crack initiation region and the fatigue crack propagation region while the other divides the fatigue crack propagation region and the fast fracture region were drawn based on these morphological differences of the fatigue fracture surface recognized by the extensive SEM observations. The latter boundary was located 600 µm from the specimen surface.
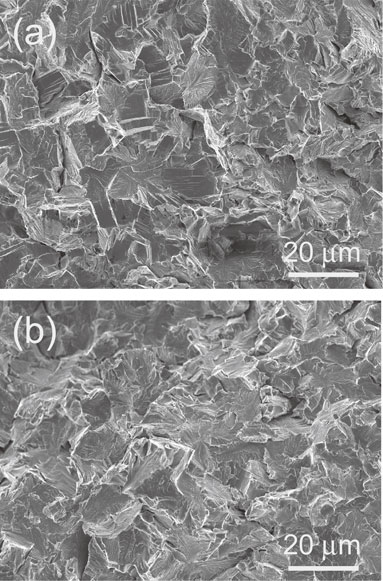
Figure 8 shows higher magnification SEM micrographs taken from the fatigue propagation region. Well-defined striations are shown in Figs. 8(a), 8(b), and 8(c) (marked B, C, and D, respectively, in Fig. 6). The striation spacing did not seem to widen gradually as the fatigue crack growth progressed.
Figure 9 shows the whole view of the fracture surface of the B-free Ti–6Al–4V alloy with an equiaxed microstructure (marked B in Fig. 2), indicating three morphologically different regions composed of the fatigue crack initiation region, fatigue crack propagation region, and fast fracture region.

The positions marked A, B, and C in the photograph of Fig. 9 were examined at high magnification, as shown in Fig. 10. Fatigue striations can be seen in the propagation region. However, unlike the case in the Ti–27.5Al–13Nb alloy, the striation spacing increased with increasing distance from the initiation region as shown in Fig. 10(a) (marked A in Fig. 9), and Fig. 10(b) (marked B in Fig. 9). Figure 12(c) (marked C in Fig. 9) shows the fracture morphology at the boundary between the propagation region and the fast fracture region (upper part of this photo). Contrary to the case of the Ti–27.5Al–13Nb alloy, the dimple fracture morphology was seen as a result of the ductile nature of this Ti–6Al–4V alloy. The boundary between the propagation region and the fast fracture region was 1,250 µm from the specimen surface, which is almost double that of the Ti–27.5Al–13Nb alloy. This longer propagation distance is the manifestation of a higher fracture toughness of the Ti–6Al–4V alloy compared to the Ti–27.5Al–13Nb alloy. The distance of the boundary between the initiation and propagation regions from the specimen surface seemed almost the same, i.e., ∼200 µm, for both B-free and 0.1 pct B-modified alloys.
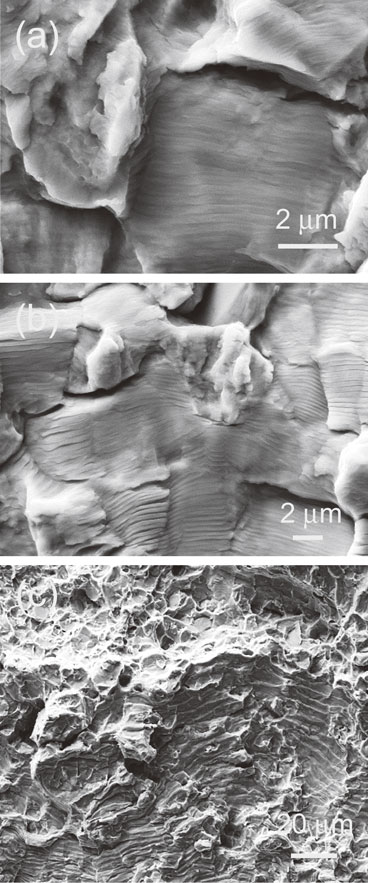
Figure 11 shows the whole view of the fracture surface of the 0.1 pct B-modified Ti–6Al–4V alloy, indicating a somewhat smoother fracture morphology than that of the B-free alloy (Fig. 9). The positions marked A, B, and C in this photo were examined at high magnification, as shown in Fig. 12, and the results indicate that the striation spacing increased with increasing distance from the initiation region.
A very rough fatigue fracture surface was observed for the Ti–27.5Al–13Nb alloy with a lamellar microstructure, and the formation of the striations on the fracture surface could not be recognized by the SEM observation even at a higher magnification of 10,000.
3.5.2 Fatigue striation counting
Mainly for the purpose of estimating the fatigue lives spent during the fatigue initiation stage and the propagation stage, the fatigue striations were counted based on the SEM observation of striation spacing.
Figure 13 shows the relationship between the striation spacing and the distance from the specimen surface for the B-free Ti–27.5Al–13Nb alloy with a duplex microstructure. For comparison, the figure includes this relationship for both the B-free and 0.1 pct B-modified Ti–6Al–4V alloys with equiaxed microstructures.
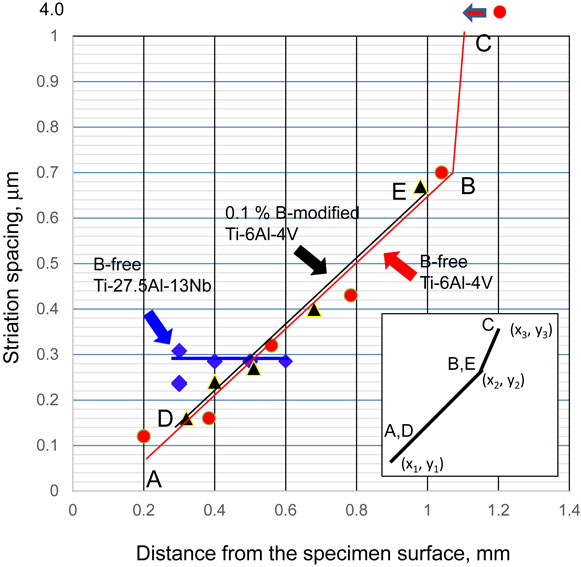
For the B-free Ti–27.5Al–13Nb alloy, striations began to form 0.3 mm away from the specimen surface and then propagated for a distance of 0.3 mm. From start to finish of this propagation, the measured striation spacing was a constant 0.29 µm. Therefore, the number of striations within this distance can be easily counted by dividing the crack propagation distance by the measured striation spacing. This calculation (0.3 mm divided 0.29 µm) yields a total of 1.034 × 10³ striations. Since many authors have demonstrated29) that the one striation corresponds to the one stress cycle, this value can be regarded as the number of cycles (NP) spent during the propagation stage. The number of cycles to failure (Nf) of this HCF specimen was 4.009 × 10⁶ cycles. Therefore, the percentage of fatigue life spent by the propagation stage was calculated by division, 1.034 × 10³/4.009 × 106, as 0.026 pct. Since a fast fracture occurs instantaneously, the number of cycles during this stage can be regarded as zero; therefore, by subtracting this value from 100 pct, the fatigue life spent during the initiation stage gives the value of 99.974 pct.
For the B-free Ti–6Al–4V alloy with an equiaxed microstructure, the formation of striations started 100 µm from the specimen surface, and this continued for a distance of 1200 µm. The relationship between the striation spacing and the distance from the specimen surface could be expressed as two straight lines in this crack propagation distance, designated A–B and B–C in Fig. 13. The equation of one line segment is expressed as,
| \begin{align}
\mathrm{y} &= \mathrm{dx}/\mathrm{dN} = k\ \mathrm{x} + \mathrm{a}\ (\text{a: constant}),\ \text{where}\\
k& = (\mathrm{y}_{2}-\mathrm{y}_{1})/(\mathrm{x}_{2}-\mathrm{x}_{1})
\end{align}
| (1) |
Since the striation spacing y corresponds to the fatigue crack growth rate, dx/dN, the number of cycles spent during propagating from x
1 to x
2, N
x1−x2, is expressed as follows:
30)
| \begin{equation}
\mathrm{N}_{\text{x1${-}$x2}} = \int\limits_{\text{x1}}^{\text{x2}} \{1/(k\ \mathrm{x} + \mathrm{a})\}\mathrm{dx} = (\ln\mathrm{y}_{2} - \ln\mathrm{y}_{1})/\mathrm{k}\ \text{cycles}
\end{equation}
| (2) |
By using the actual data for each line segment shown in
Table 2, the equation of y = dx/dN for line segment A–B, is expressed as,
| \begin{equation}
\mathrm{dx}/\mathrm{dN} = 0.753\times 10^{-3}\mathrm{x} + \mathrm{a}\ (\text{a: constant})
\end{equation}
| (3) |
Thus, the number of cycles spent during propagating from x
1 = 0.2 mm to x
2 = 1.05 mm is expressed as follows:
| \begin{align}
\mathrm{N}_{\text{x1${-}$x2}} &= \int\limits_{0.2}^{1.05} \{1/(0.753\times 10^{-3}\mathrm{x} + \mathrm{a})\}\mathrm{dx} \\
&= (\ln 0.70 - \ln 0.06)/0.753\times 10^{-3} = 3263\ \text{cycles}
\end{align}
| (4) |
The equation of another line segment B–C is expressed as,
| \begin{equation}
\mathrm{y} = 2.20\times 10^{-2}\mathrm{x} + \mathrm{a}\ (\text{a: constant})
\end{equation}
| (5) |
Therefore, the number of cycles spent during propagating from x
2 = 1.05 mm to x
3 = 1.20 mm is expressed as follows:
| \begin{align}
\mathrm{N}_{\text{x2${-}$x3}}& = \int\limits_{1.05}^{1.20} \{1/(2.20\times 10^{-2}\mathrm{x} + \mathrm{b})\}\mathrm{dx} \\
&= (\ln 4.0 - \ln 0.7)/2.20\times 10^{-2} = 79\ \text{cycles}
\end{align}
| (6) |
Thus, the total number of cycles spent during propagating from 0.20 mm up to 1.2 mm is 3263 + 79 = 3342 cycles. The number of cycles to failure (N
f) of this HCF specimen was 3.286 × 10
6 cycles. Therefore, the percentage of fatigue life spent during the propagation stage was calculated as 0.1234 pct. By subtracting this value from 100 pct, the percentage of fatigue life spent during the initiation stage is 99.898 pct, which indicates that the almost 100 pct of fatigue life is spent during the initiation stage.
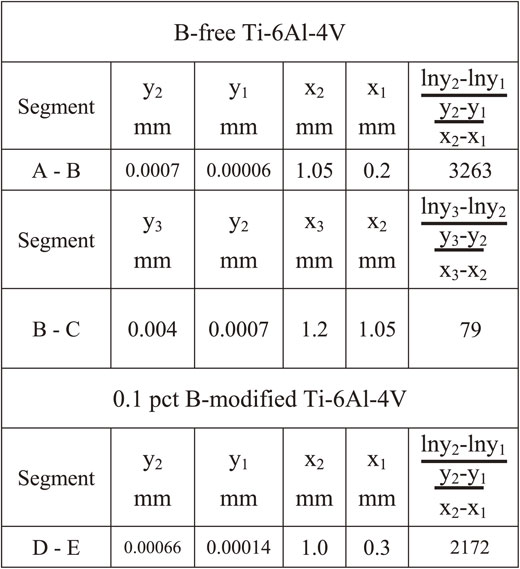
For the 0.1 pct B-modified Ti–6Al–4V alloy with an equiaxed microstructure (the number of cycles to failure (Nf) of this HCF specimen was 8.513 × 10⁶ cycles), striations started to form from 0.3 mm from the specimen surface and lasted up to a distance of 1.0 mm. The relationship between the striation spacing and the distance in this propagation stage, that is, line segment D–E, coincided completely with that for B-free Ti–6Al–4V alloy, as shown in Fig. 13. By a calculation method similar to that described above, the number of cycles spent during propagating from 0.3 mm to 1.00 mm, the percentage of fatigue life spent during the propagation stage, and the percentages of the fatigue life spent during the initiation stage were calculated as 2172 cycles, 0.026 pct and 99.974 pct, respectively.
It is observed in the literature that the total fatigue life would be mostly determined by the fatigue crack initiation, i.e., stage I,25) and the present fatigue life estimation for two alloys supports this observation. However, the present results are very surprising and a little worrisome in that the almost 100 pct of fatigue life was shown to be spent in the stage I, which accordingly means that once the crack reaches the critical length, crack propagation occurs only for a short period of time, followed by fast fracture. Actually, we encountered some uncertainty in the fatigue striation spacing measurement process using a SEM, which would affect the estimation of fatigue life spent during the propagation process. First, since there were regions where the striations and the fast fracture region coexist, it was sometimes difficult to determine rigidly the boundary between the propagation stage and the fast fracture stage. Further, the striation spacing in region very close to the fatigue origin was very narrow and its appearance was not well-defined which made the rigid determination of the boundary between the fatigue initiation stage and the propagation stage very difficult. However, by assigning different virtual values to the equation, it was found that the shifts of these two boundaries did not affect the result of the calculation enough to change on an order-by-order basis. Another important concern is that, since the present two alloys were polycrystalline materials, it might be possible for the boundaries between two adjacent grains to become a barrier that blocked crack propagation, and a large number of cyclic loads might be required to overcome this barrier and to advance a fatigue crack an additional increment. The inclusion of this cyclic loading would largely contribute to the increase in the number of cycles spent during the propagation stage. In sum, the exact determination of the boundaries between the two adjacent fatigue stages, the precise measurement of striation spacing especially near the fatigue initiation area, and the verification of the necessity of additional cyclic loading when a crack moves to neighboring grains should be the subjects of further study.