Abstract
The metastable-phase characteristics of Ti–Nb alloys can be exploited to improve their functional properties such as damping. In this study, we investigated the structural changes in the metastable quenched martensite structure of Ti–Nb alloys subjected to heating and tensile strain. We examined the differential scanning calorimetry (DSC) heating curves in the reduction state, X-ray diffraction (XRD) profiles under loading/unloading, and material properties such as Young’s modulus and internal friction upon heating. In the DSC heating curve of the 10%-cold-rolled Ti15Nb specimen, an exothermic peak was observed, and for Ti18Nb and Ti20Nb, the exothermic peak exhibited broadening. We speculate that the underlying reason is the biphasic formation resulting from specimen deformation. From the XRD measurements, we found that the lattice tended to shrink upon stress application and recover upon unloading. Significant changes in Young’s modulus and internal friction were observed in the α′′ structures of Ti18Nb and Ti20Nb during initial heating up to 373 K. We posit that the material properties changed owing to structural changes, such as lattice-constant changes, biphasic formation, and crystal orientation changes, resulting from heating or plastic deformation.

1. Introduction
With titanium and its alloys being increasingly used as structural materials, studies have been conducted with a focus on harnessing and improving their functional properties, such as the Young’s modulus,1–4) shape memory effect,5–7) and superelasticity.8–10)
The metastable phase characteristics of titanium alloys can be exploited to improve their functional properties. In particular, the hcp-α′ and orthorhombic-α′′ martensite structures in titanium alloys afford suitable functional properties such as a low Young’s modulus and high damping.11–13) In Ti–Nb binary alloys, Ti–(15–20) mass% Nb corresponds to the composition range. Meanwhile, many studies have focused on Ti–Nb alloys with compositions in the Ti–(35–42) mass% Nb (22–27 at% Nb) range, which exhibit shape memory and superelastic functions; such functionalities are realized by utilizing the stress-induced α′′ martensite structure of β-type titanium alloys.5–8,14) Although several studies have examined the metallographic characteristics15–19) or material properties of (α + β)-type titanium alloys with the quenched martensite structure,1–3,20–22) the correlations between the material properties and stress and temperature applications remain unclear.
In addition, from the viewpoint of utilizing the quenched martensite structure of titanium alloys, previous studies have reported the high damping properties of the α′ + α′′ structure of the Ti–6Al–2Sn–4Zr–6Mo alloy developed for aircraft components.23,24) Other studies have focused on alloy design by exploiting the α′ structure of Ti–V–Sn alloys to realize a low Young’s modulus and high strength.25,26) In this study, we focused on the martensite structure of Ti–Nb alloys and how it can be exploited to realize high damping properties.
In our previous studies,11–13,27,28) we conducted experimental investigations of the Young’s modulus, internal friction, tensile elasto-plastic deformation behavior, and phase transformation behavior associated with the plastic deformation of the quenched α′ and α′′ structures of Ti–Nb alloys. Based on these results, we discuss the influence of the boundary crystal structure between the α′ and α′′ phases formed by quenching. In addition, the phase transformation and structural changes associated with the deformation of the material properties were discussed. The quenched α′ martensite in the Ti–15Nb alloy becomes a supersaturated solid solution with an expanded hcp structure. However, when the Nb content exceeds 15%, it becomes orthorhombic α′′ martensite. Although the degree of expansion is lower than that of α′ martensite, it becomes an expanded supersaturated solid solution. As the Nb content increases, the structure changes from orthorhombic near-hcp to near-bcc. There are also interesting reports on the effects of quenched-in vacancies29) on quenched martensite and spinodal decomposition30,31) when heating titanium alloys. Therefore, it is also necessary to understand this phenomenon while considering these viewpoints.
In this study, we investigated the structural changes in the quenched martensite of Ti–Nb alloys subjected to heating and tensile strain to better understand this phenomenon.
2. Experimental Procedure
Ti–(10, 15, 18, and 20) mass% Nb alloys were prepared by arc melting in an Ar atmosphere with a non-consumable W electrode using pure Ti (99.7%) and Nb (99.9%). The resulting alloys were rolled to produce 1 mm-thick sheets. These specimen sheets were labeled Ti10Nb, Ti15Nb, Ti18Nb, and Ti20Nb, corresponding to the component Nb mass%. The specimens were separately encapsulated in evacuated quartz tubes and quenched by breaking the tubes in iced water. The holding temperature and time were 1223 K and 3.6 ks, respectively. This heat treatment condition was labeled as AQ. After the heat treatment, the specimens were mechanically ground. Based on the phase diagram database,32) the predicted values of the β-transus were approximately 1064 and 990 K for Ti10Nb and Ti20Nb, respectively. A solution treatment temperature of 1223 K was selected to be used in the sufficient β single-phase region.
Differential scanning calorimetry (DSC) measurements were performed using a Rigaku ThermoPlus calorimeter to detect the structural changes and phase transformations. The specimens used for the measurements were disk shaped with φ = 3 mm. The measurements were performed in an Ar gas atmosphere with the temperature varying from 293 to 973 K at a heating rate of 10 K/min. The measurements were performed twice consecutively beginning with the AQ state, that is, in successive passes (“first” and “second” passes). In addition, specimens for DSC measurements were prepared by cold rolling of Ti–Nb alloy sheets (10 × 20 × 1 mm) with reductions rate of ∼5 and 10%, and then blanking for disk-shaped sheets with φ = 3 mm. These specimens were labeled as 5%R and 10%R, respectively.
X-ray diffraction (XRD) measurements were performed using a Rigaku SmartLab diffractometer with Cu-Kα radiation at 40 kV and 30 mA to determine the lattice parameters with stress loading on a tensile jig. The specimens used for measurements were cut into dumbbell shapes. The dimensions of the internal portion of the dumbbell, where the sides of the specimen were parallel to one another, were 12 × 3 × 0.6 mm. The lattice constants were determined using the PDIndexer software, which refines the lattice constants using the least-squares method. The crystal structure corresponding to each interplanar spacing with a diffraction angle 2θ of 30–90° was indexed.
Young’s modulus (E) and internal friction (Q−1) measurements were performed using the Ono Sokki DS3000 system. The specimen was a strip of dimensions 1 × 15 × 100 mm. The rolling direction is the longitudinal direction (along the 100 mm dimension). The frequency response function was measured using sine sweeping up to 5 kHz. The Young’s modulus was calculated from the fourth resonance frequency, and the internal friction was calculated using the half-value method of secondary resonance.33)
3. Results
3.1 Structural changes resulting from DSC heating
Figure 1 shows the DSC heating curves of Ti–(10–20) Nb alloys. The initial microstructure of each alloy is equivalent to that previously reported.11) Specifically, Ti10Nb and Ti15Nb are α′ martensite, and Ti18Nb and Ti20Nb are orthorhombic α′′ martensite structure. The lattice constants (a, (b), c) are all Ti10Nb < Ti15Nb and Ti18Nb > Ti20Nb. The thick-line curve corresponds to the first heating pass, after which the specimens were cooled to 293 K. The thin-line curve corresponds to the second heating pass. We note that Ti10Nb exhibited endothermic broadening at ∼800 K in the first pass, although no clear peak was observed. This endothermic broadening could be due to a region in the calculated phase diagram where the proportion of the β phase increased at an accelerated rate before the β-transus. Moreover, an endothermic reaction was observed at 950 K, which is attributed to the β-transus, although it was lower than the calculated phase diagram.32) The heating curve corresponding to the second pass is nearly identical to that of the first pass. In the first pass of Ti15Nb with α′ martensite, an endothermic peak was observed at >900 K. Conversely, in the second pass with the α + β structure, after an endothermic reaction occurred once at ∼700 K, an endothermic reaction corresponding to the β transformation point occurred above 800 K. This difference in the endothermic reaction behavior is attributed to the structure of the α′ martensite; this difference in endothermic reaction behavior caused a temperature difference between the first and second passes. The endothermic reaction at approximately 700 K in the second pass is considered to be related to the decomposition of the thermal ω phase. The α + β(+ ω) structure was formed in each alloy prior to the second pass heating. It is considered that the β phase was composed higher amount of Nb than average composition; thus, thermal ω phase was formed in the β phase at the cooling process of the first pass. Although other factors of the reaction are also conceivable, the reported example34,35) of the endothermic reaction in the DSC curve, when the ω phase is decomposed to the β phase, has a similar behavior. Therefore, it is considered that the endothermic reaction indicates the decomposition of the thermal ω phase.

In the first pass of Ti18Nb with α′′ martensite, an endothermic reaction corresponding to the β-transus occurred after an exothermic reaction at 830 K. In the second pass with the α + β(+ ω) structure, an endothermic reaction occurred near 700 K, and another corresponding to the β-transus is observed near 850 K. Therefore, we hypothesize that the exothermic reaction in the first pass occurs when α′′ martensite is transformed into the α (α′) phase, followed by the β-transus. This endothermic reaction is good agreement with the reported example.34) In the first pass of Ti20Nb with α′′ martensite, an exothermic reaction was observed near 750 K, followed by an endothermic reaction. In the second pass, with the α + β(+ ω) structure, two endothermic reactions were observed at ∼680 K and ∼820 K. It was also found that the exothermic peak of Ti20Nb in the first pass was wider than that of Ti18Nb. The difference in width is attributed to the structure and phase stability of α′′ martensite with Nb content. The starting point of the exothermic reaction in the first pass is a measure of the As (> Ms) point of α′′ martensite, which is lower in Ti20Nb than in Ti18Nb. In addition, the starting point of the first endothermic reaction in the second pass of Ti15Nb, Ti18Nb and Ti20Nb is almost the same, and it is more pronounced in Ti20Nb, which has a larger amount of the β phase; therefore, it is considered to be related to the thermal ω phase. In contrast, the second endothermic reaction is caused by the β-transus.
Figure 2 shows the variation in the DSC heating curves of Ti–(10–20) Nb alloys subjected to 5% and 10% cold rolling. In Ti10Nb, for reduction rates of 5% and 10%, the heating curve is nearly identical to that of the AQ state. In the case of the 5%R Ti15Nb specimen, an endothermic reaction appeared to gradually begin at an early stage below 900 K when compared with the case of the specimen in the AQ state. Concerning the 10%R specimen, an exothermic reaction peak was observed above 920 K. This is attributed to the fact that a part of the deformation-induced α′′ was formed at 10%R, resulting in an α′ + α′′ biphasic structure before heating, and the α′′ changed to α (α′) and then transformed to β during heating. In Ti18Nb, the exothermic peak intensity decreased, and the peak broadened as the reduction rate increased to 5%R and 10%R. In Ti20Nb, when the reduction rate increased, the peak initiation point started from 700 K. When an α′′ phase is formed, an exothermic peak is observed. When an expanded martensite structure, such as the α′ phase, is formed, we speculate that exothermic reaction do not occur because the hcp structure do not change before formation of the β phase. Therefore, this result indicates that the shape of the exothermic reaction peak changes depending on the ratio of α′ and α′′ after reduction.
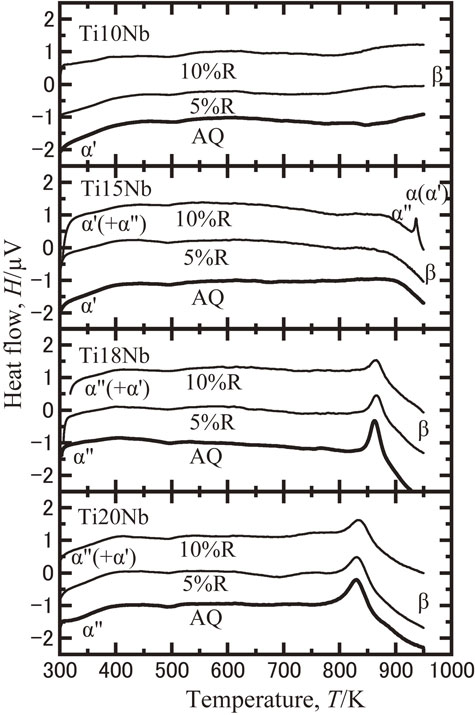
Figure 3 shows the variation in the XRD profiles of the specimens when subjected to stress loading. The profiles are labeled as follows: AQ, as quenched; EL, elastic loading; ELUL, elastic loading and unloading; PL, plastic loading (equivalent to 5% tensile strain); and PLUL, plastic loading and unloading. In the case of Ti10Nb (Fig. 3(a)), the $10\bar{1}0\alpha '$ and $10\bar{1}1\alpha '$ peaks shifted to the high-angle side in the EL scenario and recovered to positions close to those of the AQ state counterpart under ELUL. The peaks shift to the high angle side under loading conditions as compared with those under unloading conditions. This shift is considered to be due to the distortion of the lattice under loading as previously reported other titanium alloys.9,36) In the case of PL, the broadening of the $10\bar{1}1\alpha '$ peak is remarkable, and in the case of PLUL, although this peak recovers to a certain extent after unloading, the broadening remains, leading to the accumulation of residual strain. The peak position for Ti15Nb (Fig. 3(b)) in the AQ state is located at an angle lower than that of the Ti10Nb in the AQ state. This result indicates that the unit cell of Ti15Nb is larger than that of Ti10Nb. In the EL case, a peak shift to the high-angle side of the $10\bar{1}1\alpha '$ position is visible, although the amount of this shift is smaller than that in the case of Ti10Nb, this shift is nearly identical to that under the AQ condition. Conversely, concerning PL, the $10\bar{1}0\alpha '$ peak splits into the 110α′′ and 020α′′ peaks, and the $10\bar{1}1\alpha '$ peak splits into the 111α′′ and 021α′′ peaks. We speculate that this result does not indicate a complete change from the α′ single phase to the α′′ single phase; rather, it indicates the biphasic formation of the α′ and α′′ phases. In the case of Ti20Nb (Fig. 3(c)), the α′′ phase is the main phase in the AQ state. In the EL case, the intensity ratio of the 020α′′ and 021α′′ peaks become larger than those of the 020α′′ and 111α′′ peaks (indicated by arrows), and peak shifts of the 111α′′ and 021α′′ peaks can be observed. In the case of ELUL, the intensity recovered close to that of the AQ state. In the PL case, the broadening of 111α′′ is significant in addition to the changes observed in the EL case. In the PLUL case, the 111α′′ broadening is reduced to a certain extent. These changes are related to structural changes, such as lattice-constant changes, biphasic formation, and crystal orientation changes owing to stress loading or plastic deformation.
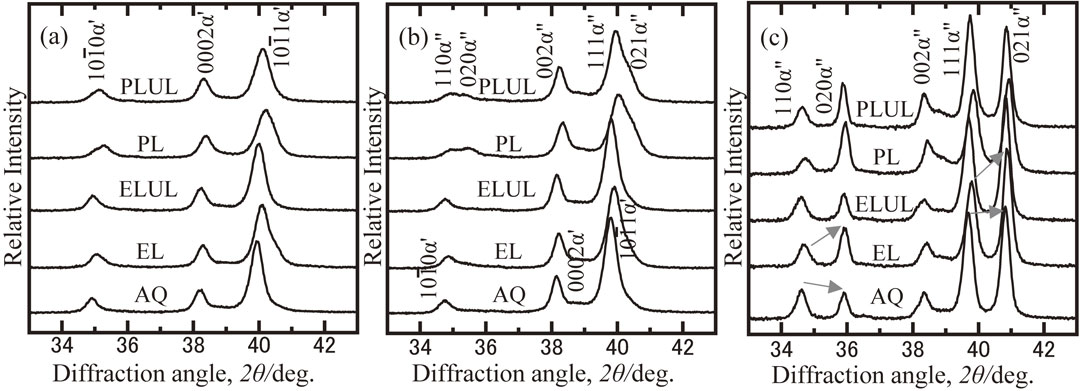
Thus far, we have examined the variations in the XRD profiles with increasing rolling reduction rate of Ti–(10, 15, and 20) Nb alloy.11) The experimental results relating to tensile deformation also exhibit a similar tendency. Furthermore, they indicate structural changes upon stress loading and unloading during elasto-plastic deformation.
Figure 4 shows variations in the lattice constant, axial ratio, and unit volume after the orthorhombic conversion. Because it is difficult to distinguish between the two martensite phases,13) only the change in the main phase was evaluated. The lattice constant was calculated to be shrinking due to the tensile loading because the tensile axis crossed the rotating axis of the specimen at right angles; therefore XRD only from the crystal plane that shrinks due to Poisson’s ratio occurred.9) The variation in the lattice constant “a” is shown in Fig. 4(a), where the constant increases in the following order: Ti10Nb, Ti15Nb, Ti18Nb, and Ti20Nb. In the α′ phase of Ti10Nb, the lattice constant decreased during stress loading under EL and PL; moreover, there was a slight decrease after unloading. In the α′ phase of Ti15Nb, the change in the lattice constant was small, although it increased under PL. This result was attributed to the formation of the α′′ phase. Conversely, in the α′′ phase in Ti18Nb and Ti20Nb, the lattice constant under EL and PL decreased upon stress loading but recovered upon unloading. This difference is attributed to the stability of the martensite phases in each alloy. The change in the axial ratio “b/a” is shown in Fig. 4(b). There is almost no change in ratio in the α′ phase in Ti10Nb and the α′′ phase in Ti18Nb and Ti20Nb; however, there is a significant change in the ratio in the case of Ti15Nb during phase transformation from the α′ phase to the α′′ phase. The change in the axial ratio “c/a” is shown in Fig. 4(c) for each case considered. This ratio increases in the α′ phase in Ti10Nb subsequent to EL and plastic deformation, eventually leading to a more stable hcp formation. In the α′ phase of Ti15Nb, there is no change in the ratio during elastic deformation, although the ratio decreases under PL and increases under PLUL. A slight change was observed in the ratio of the α′′ phases of Ti18Nb and Ti20Nb. Conversely, the change in unit volume (Fig. 4(d)) decreased under the unloading states of ELUL and PLUL in all the alloys. This result indicates that the volume-expanded lattice of the supersaturated solid solution contracts owing to the stress loading. This also indicates that the α′ phase, which exhibits the largest volume in the AQ state, decreases in volume when it transforms into the α′′ phase.
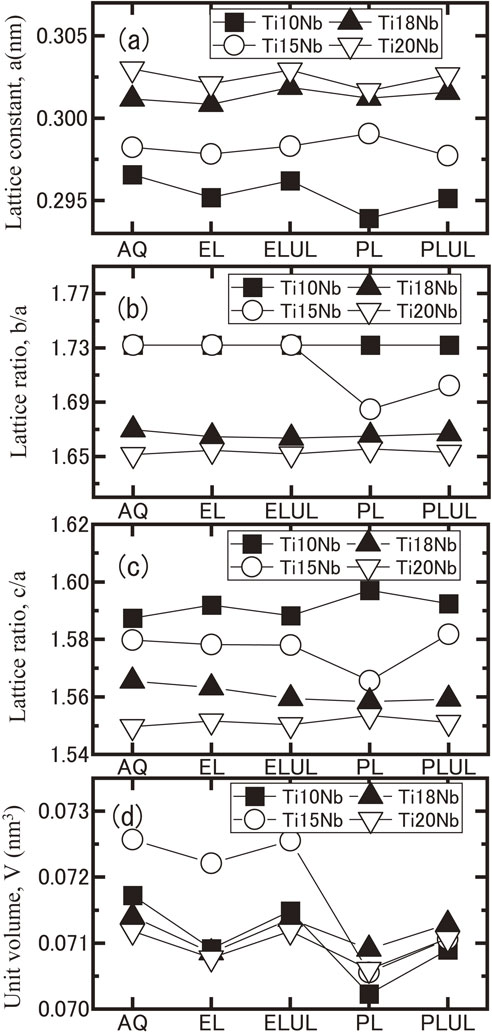
We have previously reported the results of analyzing the lattice parameters by performing peak separation based on the assumption that the XRD profile changes correspond to two phase changes owing to rolling reduction.13) The tendency of the lattice parameter to change is very similar for all specimens, and the results of this experiment provide new insights regarding lattice shrinkage owing to structural changes when stress history is applied.
3.3 Changes in the material properties resulting from structural changes caused by heating
Figure 5 shows the variation in Young’s modulus upon specimen heating from 293 to 373 K. Although each measurement was performed three times consecutively, only the results of the first and second passes are shown because the second and third passes produced nearly identical results. The Young’s modulus of Ti10Nb in the AQ state was 71 GPa, which decreased by approximately 3 GPa at 373 K, and there was a minimal change in the modulus when the experiment was repeated. The Young’s modulus of Ti15Nb in the AQ state was 46 GPa, which decreased by approximately 3 GPa at 373 K (as in the case of Ti10Nb), and there was very little change in the modulus over the subsequent trials. Conversely, concerning the α′′ phases of Ti18Nb and Ti20Nb, a change in the decreasing tendency of the Young’s modulus was observed between 333 and 353 K in the first heating pass, and this decrease is different between the two passes. The initial Young’s modulus in the second pass increased slightly, and a subsequent reheating pass resulted in linear change in the modulus. This change was more remarkable for Ti18Nb than for Ti20Nb. This result indicates that the α′′ phase of Ti18Nb is unstable, causing structural changes to easily occur.
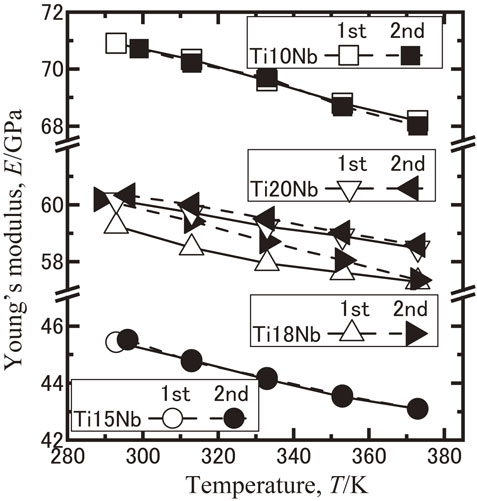
Because the measurement method used is the fourth-order resonance of the cantilever beam method of Young’s modulus, there is a possibility that the overall value was low, but it can be evaluated as a trend of the change in Young’s modulus with heating. These Young’s modulus values and their changes with heating are attributed to the stability and structural changes of the quenched martensite phase.
Figure 6 shows the change in the internal friction upon heating from 293 to 373 K. The internal friction was also measured three times; however, only the results of the first and second passes are shown because the second and third passes produced near-identical results. The internal friction of Ti10Nb increased slightly after the first heating pass. The value of Ti15Nb decreased slightly during the initial stage of the first pass but increased thereafter and maintained a relatively high value in the second pass. Conversely, Ti18Nb exhibited the highest internal friction in the early stage of the first pass, and this value decreased with further heating. At the beginning of the second pass, the friction was identical to that of Ti15Nb; however, it decreased with the heating. Ti20Nb exhibited almost constant internal friction up to 353 K; however, it decreased at 373 K. The same tendency was observed in the second pass.

The atomic defects in metals, such as quenched-in vacancies or interstitial elements, have important effects on their physical, mechanical properties and anelasticity, which is generally characterized by internal friction.37) It is also reported that concentrations of quenched-in vacancies since it has been found that point defects play an important role in martensitic transformation.38) We hypothesize that the change in Young’s modulus and internal friction are affected by the change in the state of the quenched metastable martensite phase. The behavior of the increase/decrease in the internal friction with heating for Ti10Nb and Ti15Nb is considered to be affected by structural changes, such as lattice-constant changes and biphasic formation. The mobility of quenched-in vacancies is thought to be one of the factors that cause these structural changes.
4. Discussion
We discuss the implications of the experimental results with regard to the phase stability and the structural change of the metastable quenched martensite structure in the Ti–Nb alloy specimens using the change in the Young’s modulus as one index. Figure 7 shows the plot of the Young’s modulus for the annealed (AN) and as-quenched (AQ) Ti–(10–20) Nb alloy specimens as per previous studies.13,21,28) The AN specimen exhibited an α + β structure, and their Young’s modulus decreased as the proportion of the β phase increased. In Ti10Nb, the AQ structure, in which the supersaturated α′ martensite structure is formed, exhibited a Young’s modulus that is smaller than that of the AN specimen. In the compositional vicinity of Ti15Nb, α′ martensite with a large unit volume exhibited the minimum Young’s modulus value, and as the α′′ martensite structure is formed and the lattice parameters change, and the Young’s modulus increased from Ti18Nb to Ti20Nb. Ti20Nb also exhibited a smaller Young’s modulus in AQ than in AN. These specimens can be ordered according to the tendency of the unit volume variations of the α′ and α′′ martensite phases, as shown in Fig. 4. When the metastable martensite structure is subject to elastic and plastic deformation, structural changes such as lattice-constant changes, biphasic formation, and crystal orientation changes, occur (Figs. 2 and 3). In these cases, changes in the lattice constant, arising from phase decomposition (as in the case of spinodal decomposition reported in Ti–4 at%Mo30) or Ti–15V–7Al31) alloys) may occur, thus leading to biphasic formation. Although these changes are different from spinodal decomposition due to the thermal influence, it is considered that phase decomposition occurs due to deformation. In the α′′ martensite structures of Ti18Nb and Ti20Nb, the Young’s modulus (Fig. 5) and internal friction (Fig. 6) are significantly influenced by the initial heating from the AQ state. The measured values in this study (Fig. 5) are lower those in the literature (Fig. 7). This difference is attributed to the difference in the measurement methods, but it is useful when considering the structural changes caused by heating. As these changes in α′′ martensite are slightly different from those in the α′ martensite structure, we speculate that the material properties of α′′ martensite significantly change depending on the quenched-in vacancies, which contribute to the shrinkage of the volume-expanded lattice or disappear upon heating.
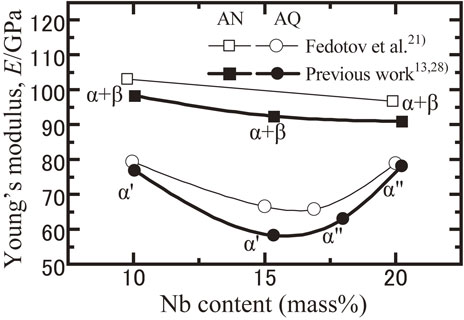
Figure 8 shows the results of our previous work investigating changes in Young’s modulus as a function of stress loading after applying a tensile preloading of ∼2% strain to Ti–(10–20) Nb alloys.13,27) These changes can be examined considering the stress loading states shown in Figs. 3 and 4. Because these results pertain to the application of a tensile preload, there is a strong correlation with the PL-condition results. The Young’s modulus of Ti10Nb increases with stress loading. This increase is attributed to lattice shrinkage during stress loading. Conversely, in Ti20Nb, the Young’s modulus decreased to ∼100 MPa in the initial stage of stress loading and subsequently increased. We hypothesize that this variation is caused by the rotation of the crystal orientation under stress loading and the lattice-constant change arising from the change from biphasic formation to a more stable structure. In the case of Ti18Nb, the Young’s modulus is extremely small at 50 MPa, which is even lower than that of Ti20Nb. This is attributed to the weakness of the interatomic bonds or the amount of quenched-in vacancies that cause shrinkage. Therefore, we posit that the material properties (Figs. 5 and 6) changed significantly during initial heating. In the case of Ti15Nb, the Young’s modulus, which was lowest in the AQ specimen, increased to ∼75 GPa upon stress loading and subsequently decreased. As this trend is similar to the incline trend of the α′′ structure of Ti18Nb and Ti20Nb after reaching the minimum value, we attribute this behavior to the partial formation of the α′′ phase (Fig. 3(b)).

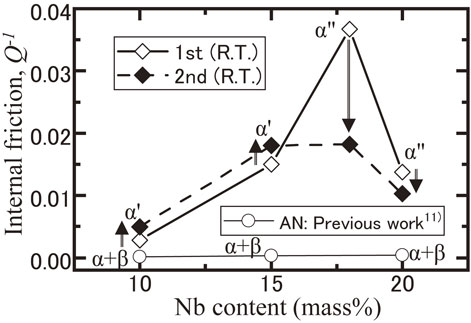
Figure 9 plots the annealed state, the quenched state (at the start point of the first pass) and the state of room temperature after heating until 373 K (at the start point of the second pass) from the results of Fig. 6 and our previous work.11) One of the factors that causes the difference in internal friction between the annealed and quenched state is the amount of quenched-in vacancies. In general, more quenched-in vacancies inhibit vibration transmission, so that it exhibits a higher internal friction value. The internal friction of the supersaturated solid solution α′ structure of Ti10Nb and Ti15Nb increases slightly after heating. On the other hand, the internal friction of the α′′ structure of Ti18Nb and Ti20Nb decreased after heating. In particular, that of Ti18Nb is greatly decreased. Although it is not titanium alloys, a quenched martensite phase of Cu alloys with high internal friction indicates reduction of internal friction with an initial heating. It is pointed out as a factor that quenched-in vacancies condense at near martensite interfaces or near dislocations with the initial heating.39,40) The result of the α′′ martensite in Ti18Nb and Ti–20Nb is predicted to be close to this phenomenon. It has also been pointed out that vacancy concentration is moderated depending on the annealing temperature and internal friction increases in Cu alloys.39,40) The internal friction increases after heating on the α′ martensite of Ti10Nb and Ti15Nb, which is predicted to be close to this phenomenon. Considering from these results, it is possible that there is a difference in behavior of vacancies between α′ and α′′ martensite.
Further studies clarifying the phase stability and structural changes of the metastable quenched α′ and α′′ martensite structures can aid in improving the structural functionality of Ti–Nb alloys.
5. Conclusion
In this study, we investigated the structural changes in metastable quenched martensite structures in Ti–(10, 15, 18, and 20) mass% Nb alloys due to heating and stress loading. The DSC heating curves of the specimens subjected to cold rolling, XRD profiles with loading/unloading, and material properties such as Young’s modulus and internal friction as functions of heating were measured. We subsequently considered the phase stability and structural changes observed in the experiments and drew the following conclusions.
-
(1)
In the DSC measurements, no clear exothermic peak was observed in the α′ martensite structures of Ti10Nb and Ti15Nb, whereas in Ti10Nb, an endothermic peak was observed only at higher temperatures. The peak exhibited greater broadening than that of the second pass for Ti15Nb. Conversely, in Ti18Nb and Ti20Nb, exothermic peaks were observed when the α′′ martensite decomposed. In the 10%R Ti15Nb specimen, an exothermic peak was detected, and in the Ti18Nb and Ti20Nb specimens, the exothermic peak broadened. Thus, we hypothesize that biphasic formation resulted from the deformation of these specimens.
-
(2)
From the XRD profile variations as a function of the loading, we inferred the accumulation of residual stress, crystal orientation changes, and shrinkage of the unit volume. In addition, the hcp-α′ martensite structure of Ti10Nb underwent a structural transformation toward improved stability, and in Ti15Nb, a phase transformation to α′′ martensite was observed.
-
(3)
Significant changes in Young’s modulus and internal friction were observed in the α′′ structures of Ti18Nb and Ti20Nb during the initial heating up to 373 K. There was little change in the α′ structures of Ti10Nb and Ti15Nb over the repeated trials. We posit that the material properties change owing to structural changes, such as lattice-constant changes, biphasic formation, and crystal orientation changes, resulting from heating or plastic deformation.
Acknowledgments
This work was supported by JSPS KAKENHI Grant Number JP21K04726.
REFERENCES
- 1) T. Ozaki, H. Matsumoto, S. Watanabe and S. Hanada: Mater. Trans. 45 (2004) 2776–2779. doi:10.2320/matertrans.45.2776
- 2) H. Matsumoto, S. Watanabe and S. Hanada: Mater. Sci. Eng. A 448 (2007) 39–48. doi:10.1016/j.msea.2006.11.022
- 3) M. Bönisch, M. Calin, J. Van Humbeeck, W. Skrotzki and J. Eckert: Mater. Sci. Eng. C 48 (2015) 511–520. doi:10.1016/j.msec.2014.12.048
- 4) N. Sakaguchi, M. Niinomi, T. Akahori and H. Toda: J. Japan Inst. Metals 70 (2006) 89–95. doi:10.2320/jinstmet.70.89
- 5) H.Y. Kim, S. Hashimoto, J.I. Kim, H. Hosoda and S. Miyazaki: Mater. Trans. 45 (2004) 2443–2448. doi:10.2320/matertrans.45.2443
- 6) J.I. Kim, H.Y. Kim, H. Hosoda and S. Miyazaki: Mater. Trans. 46 (2005) 852–857. doi:10.2320/matertrans.46.852
- 7) H.Y. Kim, Y. Ikehara, J.I. Kim, H. Hosoda and S. Miyazaki: Acta Mater. 54 (2006) 2419–2429. doi:10.1016/j.actamat.2006.01.019
- 8) T. Inamura, Y. Fukui, H. Hosoda, K. Wakashima and S. Miyazaki: Mater. Trans. 45 (2004) 1083–1089. doi:10.2320/matertrans.45.1083
- 9) M. Niinomi, T. Akahori and M. Nakai: Mater. Sci. Eng. C 28 (2008) 406–413. doi:10.1016/j.msec.2007.04.028
- 10) S. Kuramoto, K. Nishino and S. Saitou: J. JILM 55 (2005) 618–623. doi:10.2464/jilm.55.618
- 11) Y. Mantani and K. Kudou: J. Alloy. Compd. 577 (2013) S448–S452. doi:10.1016/j.jallcom.2012.04.054
- 12) Y. Mantani, T. Tsumura and K. Nakata: J. Jpn. Soc. Heat Treat. 52 (2012) 263–268.
- 13) Y. Mantani and Y. Takemoto: J. Japan Inst. Met. Mater. 79 (2015) 461–467. doi:10.2320/jinstmet.JAW201506
- 14) H.Y. Kim, T. Sasaki, K. Okutu, J.I. Kim, T. Inamura, H. Hosoda and S. Miyazaki: Acta Mater. 54 (2006) 423–433. doi:10.1016/j.actamat.2005.09.014
- 15) D.L. Moffat and D.C. Larbalestier: Metall. Trans. A 19 (1988) 1677–1686. doi:10.1007/BF02645135
- 16) R. Davis: J. Mater. Sci. 14 (1979) 712–722. doi:10.1007/BF00772735
- 17) K.A. Bywater and J.W. Christian: Philos. Mag. A 25 (1972) 1249–1273. doi:10.1080/14786437208223852
- 18) K. Ueda, T. Kobayashi and T. Narushima: J. Japan Inst. Met. Mater. 80 (2016) 60–65. doi:10.2320/jinstmet.JB201503
- 19) S. Kawano, S. Kobayashi and S. Okano: Mater. Trans. 60 (2019) 1842–1849. doi:10.2320/matertrans.ME201908
- 20) Y. Takemoto, Y. Miyake and T. Senuma: J. Japan Inst. Metals 73 (2009) 752–757. doi:10.2320/jinstmet.73.752
- 21) S.G. Fedotov and P.K. Belousov: Phys. Met. Metallogr. 17 (1964) 83–96.
- 22) H. Matsumoto and H. Ito: Mater. Trans. 60 (2019) 1833–1841. doi:10.2320/matertrans.ME201907
- 23) T. Sugimoto, M. Ikeda, S. Komatsu and K. Kamei: Netsushori 29 (1989) 191–197.
- 24) T. Sugimoto, M. Ikeda and S. Komatsu: Materia Japan 37 (1998) 27–30. doi:10.2320/materia.37.27
- 25) H. Matsumoto, S. Watanabe and S. Hanada: Mater. Sci. Eng. A 448 (2007) 39–48. doi:10.1016/j.msea.2006.11.022
- 26) H. Matsumoto, K. Kodaira and A. Chiba: J. Japan Inst. Metals 72 (2008) 989–996. doi:10.2320/jinstmet.72.989
- 27) Y. Mantani and Y. Takemoto: Proc. 9th Pacific Rim Int. Conf. on Advanced Materials and Processing, ed. by T. Furuhara, M. Nishida and S. Miura, (The Japan Inst. Metals and Materials, 2016) pp. 644–647.
- 28) Y. Mantani, M. Tajima and K. Kudou: Memories of Suzuka National College of Technology 42 (2009) 63–68.
- 29) M. Ijiri, Y. Tomita, T. Ishikawa, K. Kadowaki and Y. Takemoto: J. Japan Inst. Met. Mater. 81 (2017) 345–351. doi:10.2320/jinstmet.J2017011
- 30) S. Saeki, S. Kobayashi and S. Okano: J. Japan Inst. Met. Mater. 82 (2018) 197–203. doi:10.2320/jinstmet.J2017059
- 31) Y. Takemoto, M. Tsunekawa, Y. Manabe, S. Itano and Y. Muraoka: J. Japan Inst. Met. Mater. 82 (2018) 307–313. doi:10.2320/jinstmet.J2018014
- 32) Y. Zhang, H. Liu and Z. Jin: Calphad 25 (2001) 305–317. doi:10.1016/S0364-5916(01)00051-7
- 33) “Damping materials and their performance measurement”. ONO SOKKI CO., LTD. https://www.onosokki.co.jp/English/hp_e/whats_new/SV_rpt/damp/index.htm.
- 34) M. Bönisch, A. Panigrahi, M. Stoica, M. Calin, E. Ahrens, M. Zehetbauer, W. Skrotzki and J. Eckert: Nat. Commun. 8 (2017) 1429. doi:10.1038/s41467-017-01578-1
- 35) M. Bönisch, P. Panigrahi, M. Calin, T. Waitz, M. Zehetbauer, W. Skrotzki and J. Eckert: J. Alloy. Compd. 697 (2017) 300–309. doi:10.1016/j.jallcom.2016.12.108
- 36) M. Tahara, H.Y. Kim, H. Hosoda and S. Miyazaki: Acta Mater. 57 (2009) 2461–2469. doi:10.1016/j.actamat.2009.01.037
- 37) Z.C. Zhou, Y.F. Yang, J. Du, S.Y. Gu, X.B. Zhu, Y.J. Yan and M. Sun: Mater. Trans. 61 (2020) 1051–1057. doi:10.2320/matertrans.MT-M2019379
- 38) X. Ren and K. Otsuka: MRS Bull. 27 (2002) 116–120. doi:10.1557/mrs2002.47
- 39) Q. Wang, F. Han, C. Cui, S. Bu and L. Bai: Mater. Lett. 61 (2007) 5185–5187. doi:10.1016/j.matlet.2007.04.025
- 40) G. Covarel, V. Pelosin and A. Rivière: Scr. Mater. 46 (2002) 319–324. doi:10.1016/S1359-6462(01)01248-9