Abstract
Titanium aluminide (TiAl) alloy is attracting attention in the automobile and aviation industries as a promising lightweight heat-resistant alloy material. Parts used in high-temperature environments must have ductility and toughness at room temperature in addition to high strength at high temperatures, however, some alloys, such as TiAl alloys, are known to be difficult materials for casting and machining. Recently, manufacturing processes using additive manufacturing (AM) have been studied to solve these problems. In the present research, the effect of energy density during the AM process on surface roughness and on the strength of the built parts was studied by changing build parameters. As the energy density increased, the porosity and surface roughness decreased. Additionally, higher energy density tended to increase the fraction of lamellar structure. It was found, however, that an increase in lamellar structure does not necessarily lead to any improvement in tensile or creep strength at 750°C. We found that a constant energy density of 15 J/mm3 showed better tensile and creep properties than those of the standard parameter. Our results suggest that it is important to optimize the parameters according to the required properties of the parts.
This Paper was Originally Published in Japanese in J. JILM 72 (2022) 308–313. Abstract is slightly modified. The captions of Table 2, 3, 5 and 6 are slightly modified. The captions of Fig. 1, 2, 3, 4, 7 and 10 are slightly modified.
1. Introduction
Titanium aluminide (TiAl) alloys are intermetallic compounds consisting of titanium and aluminum, and are attracting attention in the automotive and aviation industries as lightweight heat-resistant materials. In the automotive industry, turbine wheels are required to be lightweight to improve the engine response of turbochargers, and in the aircraft industry, engines are required to be lightweight to improve fuel efficiency.1–3) These parts are rotating parts used in high-temperature environments, and high specific strength (strength/density) is desired. In addition to high-temperature strength, heat-resistant alloy structural materials must have sufficient ductility and toughness at room temperature. Currently, heat-resistant steels and nickel (Ni)-based superalloys are used for these parts, but these materials are heavy due to their high density. TiAl has higher specific strength than conventional Ni-based superalloys and titanium alloys, and is expected to be a next-generation heat-resistant material. However, TiAl alloys are known to be difficult materials to machine due to their poor ductility at room temperature, and cutting causes defects such as microcracks and tears, requiring advanced machining techniques.4–6)
Against this background, new manufacturing methods have begun to be developed these days; additive manufacturing (AM) technology, for example, is expected to become a promising technology.6–8) Previous studies have carried out microstructure observation of TiAl alloys fabricated by AM, and the effects of heat treatment on mechanical properties and microstructure have been examined.9–14) The superior properties of AM TiAl alloys over cast materials have been reported, suggesting the possibility of TiAl alloy fabrication by AM technology.10–12) However, the microstructure of parts fabricated by AM may vary depending on the electron beam melting (EBM) process parameters, and the mechanical properties are also expected to change as the microstructure changes. For example, it has been reported that the range of process parameters that can be used in selective laser melting (SLM) has been clarified by changing the parameters and checking the internal defects of the specimens.15) In AM processes using TiAl, Al evaporation is remarkable due to localized energy application, and the effect of process parameters on Al loss during building has also been reported.15,16)
Although these recent studies have reported on the AM of TiAl alloys for strength tests and microstructure observation, there have been few studies on the process parameters that are important during the building process. In this study, we investigated the effects of process parameters on the microstructure and high-temperature mechanical properties of TiAl alloys by examining the microstructure and mechanical properties at high temperatures.
2. Experimental Procedures
In this study, Arcam Ti–48Al–2Cr–2Nb Powder (45–150 µm) was used, and manufacturing was performed using an Arcam A2X EBM system (Arcam EBM, Sweden). The chemical composition of the powder used is shown in Table 1. Different parameters were used to manufacture the different specimens, including the standard parameters recommended by the equipment manufacturer, which were set using an automatic correction function. The automatic correction function varies the beam current and beam scanning speed for each beam scanning line to ensure uniform energy distribution regardless of the shape of the specimen. The beam current was varied in proportion to the beam scanning line length, and the beam scanning speed was varied based on the speed function and the magnitude of the beam current. This correction prevents localized heat input caused by the geometry of the specimen and/or the beam scanning pattern, and ensures uniform heat input over the entire built surface at all times.

Table 1 Chemical composition of the Ti–48Al–2Cr–2Nb powder (mass%).
The effects of process parameters on mechanical properties and microstructure were investigated. For this part of the present study, the automatic correction function was turned off. We examined the relationship between the mechanical properties of the material and its microstructure, which are closely related to the energy density during the build process. The energy density is calculated using the following equation:17)
| \begin{equation*}
P = \frac{I \times V}{v \times d \times t}
\end{equation*}
|
where
P is the energy density [J/mm
3],
I is the beam current [mA],
V is the accelerating voltage [kV],
v is the beam speed [mm/s],
d is the hatching space [mm], and
t is the layer thickness [mm].
Of these parameters, three (beam current, beam speed, and hatching space) were varied among three different conditions for each parameter, i.e., nine different conditions were used to fabricate specimens. The standard parameter recommended by the equipment manufacturer (with automatic correction function) was also used as a reference. Table 2 shows the fixed parameters used, and Table 3 shows the process parameters that we varied.
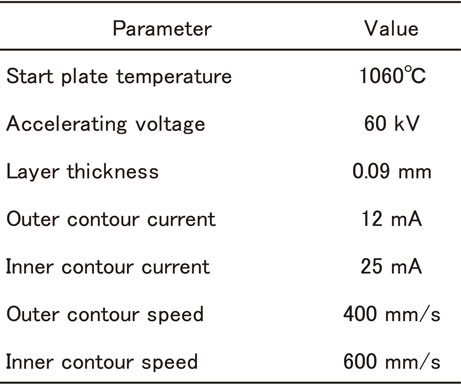
Table 2 The fixed EBM process parameters used in this study.

Table 3 The varied EBM process parameters used in this study.
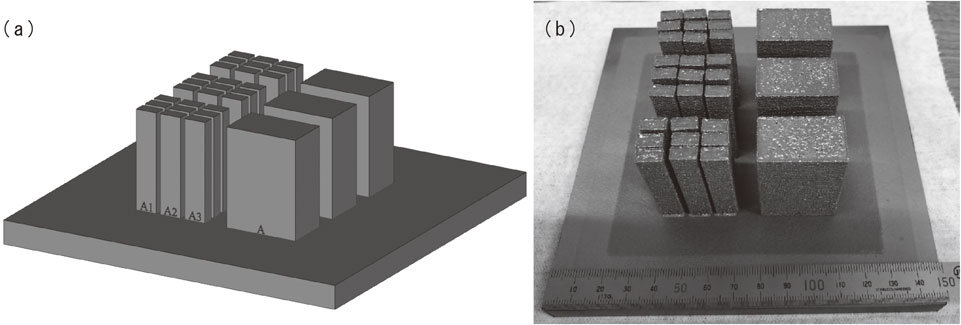
Under the standard parameter, the beam current was set to 8 mA and the speed function was set to 55 instead of the beam speed. In practice, the values were changed by correction, so the approximate ranges are shown in Table 3 based on the log data after building. The 3D model of the specimens and their actual appearance after building are shown in Fig. 1. As shown in Fig. 1, nine small rectangular blocks and one large block were simultaneously built. In addition, three building conditions were used for each batch, i.e., a total of nine conditions were used for the three batches. The top surface of the large block was observed and the surface roughness of the top surface was measured by 3D measurement microscope. Additionally, the center of each fabricated small rectangular block was cut out for microstructure observation using a scanning electron microscope (SEM), and its density was measured. The porosity fraction was calculated from the SEM images using image analysis software (ImageJ, national institutes of health). Under some conditions, the percentage of microstructure was also calculated.
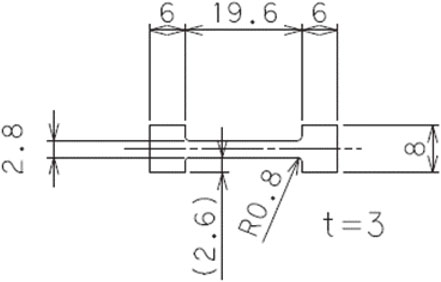
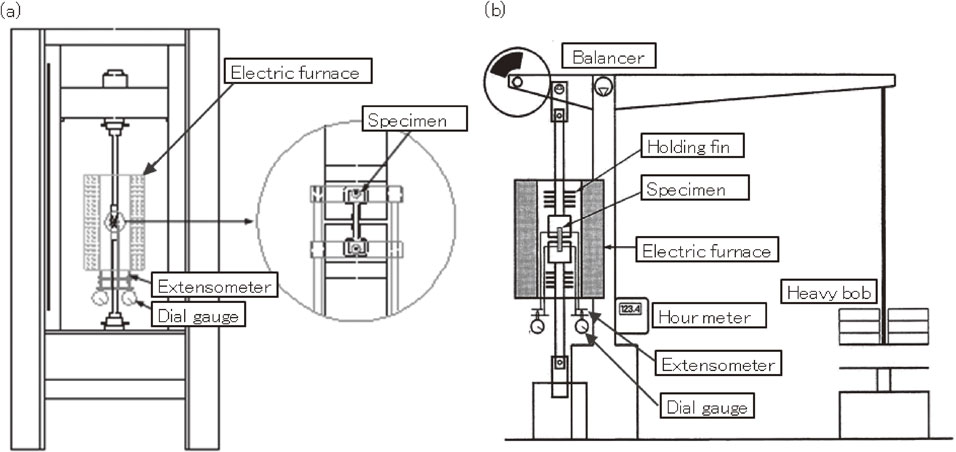
The small rectangular blocks were processed by hot isostatic pressing (HIP) at 1200°C/140 MPa/4 h for built specimens with the shape shown in Fig. 2, and tensile and creep tests were performed (Table 4). Figure 3 shows an overview of the tensile and creep test equipment. The elongation of the specimen in the tensile and creep tests was measured with a dial gauge via a pair of extensometers directly attached to the top and bottom edges of the specimen. Tensile and creep tests were performed with several types of high energy density under the nine conditions.
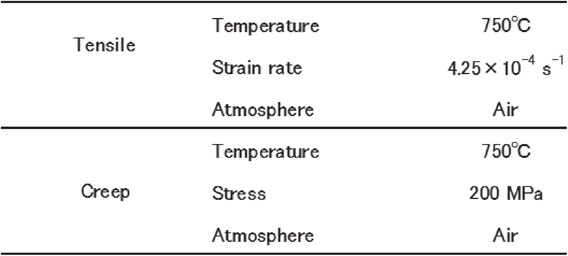
Table 4 The conditions for tensile and creep tests.
3. Results and Discussion
3.1 Surface characterization and microstructure
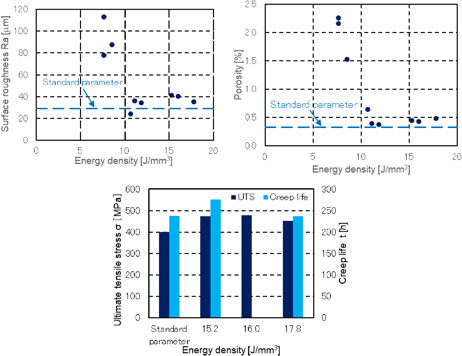
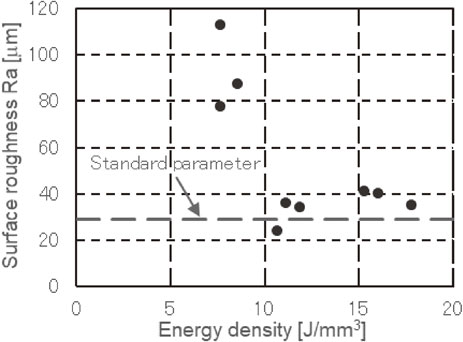
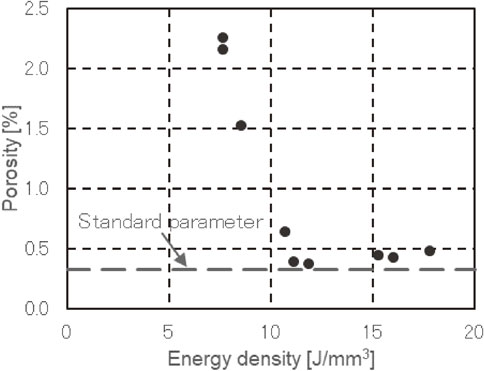
The surfaces of the built blocks are shown in Fig. 4. The results of the measurement of the surface roughness and porosity of each block are shown in Table 5. The relationship between energy density and surface roughness is shown in Fig. 5, and the relationship between energy density and porosity is shown in Fig. 6.
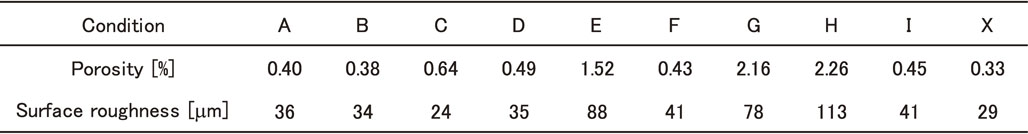
Table 5 The area fraction of porosity and surface roughness of each specimen.
Under conditions E, G, and H (Fig. 4), where the energy density was particularly low, the surface was spongy, while under conditions D and F, where the energy density was high, a smooth melted surface was observed. Table 5 and Fig. 5 also show that the surface roughness varied with the energy density, with lower energy densities resulting in higher values of surface roughness. The built block with standard parameters yielded the second lowest value of surface roughness.
Table 5 and Fig. 6 also confirm that the energy density affects porosity. As the energy density decreased, porosity increased. The reason for this would be insufficient melting caused by the shortage of energy density. It has been reported that, in general, a specific input of energy is necessary to guarantee a dense component.16) In the present study, surface roughness and porosity values tended to be higher when the energy density was less than 10 J/mm3, suggesting that an energy density of 10 J/mm3 or higher is necessary to achieve the desired built block. In this study, the built block with standard parameters showed the lowest porosity value. Because in the case of this block the parameters were automatically corrected according to the shape to be built, it is considered that sufficient energy density was ensured to melt the TiAl powder. Therefore, both surface roughness and porosity are considered to have good values in this case.
The microstructures obtained after building are shown in Fig. 7, and the area percentages of the microstructures calculated by image analysis software are shown in Table 6. As shown in Fig. 7, γ bands10,18) with layered equiaxed γ grains were observed in the specimen using the standard parameter, confirming that this block was the standard microstructure after building. Under all parameter conditions, the microstructure was found to be duplex (a mixture of equiaxed γ and γ/α2 lamellar grains). Under the non-standard conditions, γ bands were not confirmed and the equiaxed γ grains were found to be scattered. It is thought that γ bands were more likely to form under the standard parameters due to the uniform heat input ensured by the automatic correction of the parameters; the variation of the heat input within a layer was small. Under the standard parameters, local heat input due to differences in geometry and beam scanning patterns was suppressed by the correction of the beam current and beam speed, and the heat input was always uniform across the built surface. In contrast, if there is no correction and the beam speed is constant, localized heat input may temporarily vary at the corners of the shape or at the turn of the beam scanning, and the cooling rate is not necessarily constant at each location. These differences in heat input cause thermal effects on the layer below the molten pool, which result in variation in the formation microstructure. Therefore, there are expected to be places where equiaxed γ grains form and places where such grains do not form.


Table 6 The energy density and area fractions of the γ, lamellar, and α2 phase of each specimen.
It has been reported that, even in SLM building, the heat input increases at the beam turnaround point, resulting in a non-uniform microstructure.15) Although the observed microstructures were all duplex under the non-standard process parameters, as shown in Table 6, differences in the ratio of equiaxed γ grains to lamellar microstructure were observed depending on differences in energy density: the higher the energy density, the higher the percentage of lamellar structure. It has been reported that, in general, the microstructure of SUS316L fabricated by SLM differs depending on the laser power,19) and it has been pointed out that varying the laser power changes the temperature gradient and grain growth rate during the solidification process, which affects the formation of the structure.19) In the present study as well, differences in energy density due to changes in the process parameters affected the cooling rate and therefore the grain growth rate. It has also been reported that differences in cooling rate affect the grain size of equiaxed γ grains, and the precipitation ratio of lamellar microstructures.20,21) The differences in cooling rate affect microstructure formation in TiAl of the same composition, with a lamellar microstructure forming when the cooling rate is small and equiaxed γ grains forming when the cooling rate is large.21) It has also been shown that there are differences in the microstructures formed under different heat treatment temperatures, and it has been reported that the volume fraction of α is higher when held at higher temperatures during the α + γ phase.22) This suggests that the ratio of lamellar microstructure would be larger under higher energy density conditions because the time hold at higher temperatures during melting is longer, and the retention time in the α + γ phase is also longer.
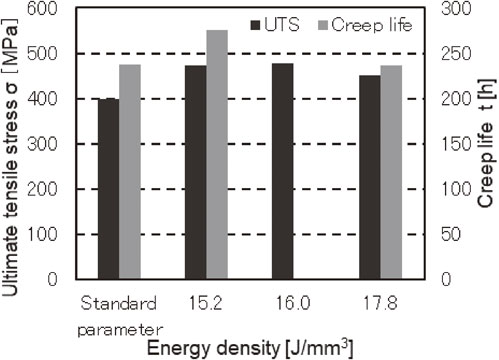
3.2 High-temperature strength properties
The stress-strain curves and creep curves of the present specimens are shown in Figs. 8 and 9, respectively. The minimum creep rate is shown in Table 7, and the relationships among energy density, tensile strength, and creep life are summarized in Fig. 10. Specimens prepared under conditions D, F, I, and the standard parameters were used for the tensile test, and specimens prepared under conditions D, I, and the standard parameters were used for the creep test. Conditions D, F, and I yielded higher values for both ductility and tensile strength than those of the standard parameters (Fig. 8). These three conditions had relatively high energy density. The reason for the higher strength under these conditions compared to the standard parameters may be related to the percentage of lamellar structure. Table 6 shows that the percentage of lamellar microstructure was higher under the conditions in which the process parameters were changed. It is generally known that the tensile strength of a specimen with α2 microstructure is higher than that of one with equiaxed γ grains.23) Therefore, a lamellar microstructure containing an α2 microstructure tends to have higher strength.23) Thus, the strength was higher under conditions D, F, and I, where the ratio of lamellar microstructure was higher than that under the standard parameters. In addition, since γ bands were observed in the standard parameter specimen and the tensile test in this study was loaded normal to layer direction these γ bands, the ductility of the standard parameter would be considered low.


Table 7 Creep test results and minimum creep rate.
Differences in ductility were observed among conditions D, F, and I. This is thought to be related to the ratio of equiaxed γ grains. Equiaxed γ grains are relatively easily deformed by shearing deformation and tend to be highly ductile.23) Therefore, the ductility of condition I, which showed a higher percentage of equiaxed γ grains, is considered to have the highest value. Figure 9 shows that condition I has the longest creep life, while that of condition D is almost the same as that of the standard parameters. These results suggest that the energy density of the standard parameters is between 16 and 25 J/mm3. However, since the standard parameters are corrected depending on the shape, different energy densities are expected when building different shapes.
The reason for the longer creep life for condition I compared to the standard parameters may be due to the higher percentage of lamellar structure. It is known that a lamellar microstructure is generally effective in inhibiting the propagation of dislocation and crack, and that creep life tends to be improved when lamellar microstructure is abundant.24) Condition I is considered to have improved creep life because it yielded a higher proportion of lamellar microstructure than the standard parameters. The minimum creep rate results in Table 7 also show that condition I had the lowest value, indicating that the rate of deformation was suppressed. Furthermore, the results in Fig. 10 show that condition I was better than the standard parameters for both tensile strength and creep life. This indicates that the standard parameters are not necessarily the optimal process parameters and that there is still room for optimization.
When the energy density is too low, interlayer defects occur. On the other hand, when the energy density is too high, the strength of the material is reduced due to the resultant decrease in ductility. Therefore, there is an optimum energy density for achieving a high level of both strength and ductility in the alloy. In a previous study, it was pointed out that strength and ductility can be achieved by maintaining the high density of the specimen and building at the lowest possible energy density.25) It is also known that strength varies depending on the shape of the part to be fabricated even with the same process parameters,26) so it is important to optimize the process parameters according to the shape of the part to be built and the required strength.
4. Conclusion
EBM equipment was used to build specimens under different conditions, including standard parameters and various other process parameters, and the surface properties, microstructure, tensile properties, and creep properties of the resultant specimens were investigated to clarify the relationships between energy density and these properties. In the TiAl blocks built in the present study, porosity fraction was large and surface roughness was high when energy density was less than 10 J/mm3. This means that the energy density was not high enough to melt the TiAl powder, resulting in the formation of internal defects. On the other hand, the percentage of lamellar structure increased with increasing energy density. This is because the ratio of lamellar microstructure formation changes as the retention time and cooling rate at high temperatures vary with the energy density. Changes in the ratio of lamellar structure also affected tensile and creep properties. Since some conditions were found to yield better results in tensile strength and creep life than the standard parameters, there is room for optimization. Energy density that was too high also reduced strength, suggesting that there may be an optimum energy density. Since specific properties are required for parts that will become products, it is important to vary the mechanical properties of each part by changing the process parameters in order to achieve the best results.
Acknowledgments
This research was supported in part by the “Strategic Fundamental Technology Improvement Support Operation” of the Subsidy for Measures to Support the Management of Small and Medium Enterprises, and by the Light Metal Educational Foundation. We hereby express our deep appreciation.
REFERENCES
- 1) T. Tetsui, K. Shindo, S. Kaji, S. Kobayashi and M. Takeyama: Intermetallics 13 (2005) 971–978. doi:10.1016/j.intermet.2004.12.012
- 2) Y.W. Kim: JOM 41 (1989) 24–30. doi:10.1007/BF03220267
- 3) Y.W. Kim: JOM 46 (1994) 30–39. doi:10.1007/BF03220745
- 4) S. Nishikiori and S. Masaki: J. Japan Inst. Metals 64 (2000) 992–998. doi:10.2320/jinstmet1952.64.11_992
- 5) H. Clemens, W. Wallgram, S. Kremmer, V. Güther, A. Otto and A. Bartels: Adv. Eng. Mater. 10 (2008) 707–713. doi:10.1002/adem.200800164
- 6) B.P. Bewlay, S. Nag, A. Suzuki and M.J. Weimer: Mater. High Temp. 33 (2016) 549–559. doi:10.1080/09603409.2016.1183068
- 7) W. Ge, C. Guo and F. Lin: Procedia Eng. 81 (2014) 1192–1197. doi:10.1016/j.proeng.2014.10.096
- 8) L.E. Murr, S.M. Gaytan, A. Ceylan, E. Martinez, J.L. Martinez, D.H. Hernandez, B.I. Machado, D.A. Ramirez, F. Medina, S. Collins and R.B. Wicker: Acta Mater. 58 (2010) 1887–1894. doi:10.1016/j.actamat.2009.11.032
- 9) S. Biamino, A. Penna, U. Ackelid, S. Sabbadini, O. Tassa, P. Fino, M. Pavese, P. Gennaro and C. Badini: Intermetallics 19 (2011) 776–781. doi:10.1016/j.intermet.2010.11.017
- 10) M. Seifi, A.A. Salem, D.P. Satko, U. Ackelid, S.L. Semiatin and J.J. Lewandowski: J. Alloy. Compd. 729 (2017) 1118–1135. doi:10.1016/j.jallcom.2017.09.163
- 11) K. Cho, R. Kobayashi, J.Y. Oh, H.Y. Yasuda, M. Todai, T. Nakano, A. Ikeda, M. Ueda and M. Takeyama: Intermetallics 95 (2018) 1–10. doi:10.1016/j.intermet.2018.01.009
- 12) H. Yue, Y. Chen, X. Wang and F. Kong: J. Alloy. Compd. 750 (2018) 617–625. doi:10.1016/j.jallcom.2018.03.343
- 13) K. Cho, H. Kawabata, T. Hayashi, H.Y. Yasuda, H. Nakashima, M. Takeyama and T. Nakano: Addit. Manuf. 46 (2021) 102091. doi:10.1016/j.addma.2021.102091
- 14) K. Cho, H. Odo, K. Okamoto, H.Y. Yasuda, H. Nakashima, M. Takeyama and T. Nakano: Crystals 11 (2021) 809. doi:10.3390/cryst11070809
- 15) J. Schwerdtfeger and C. Körner: Intermetallics 49 (2014) 29–35. doi:10.1016/j.intermet.2014.01.004
- 16) D. Wimler, J. Lindemann, M. Reith, A. Kirchner, M. Allen, W.G. Vargas, M. Franke, B. Klöden, T. Weißgärber, V. Güther, M. Schloffer, H. Clemens and S. Mayer: Intermetallics 131 (2021) 107109. doi:10.1016/j.intermet.2021.107109
- 17) Japan Technology Research Association for Advanced 3D Additive Manufacturing Technology, “For designers and engineers”, Introduction to Metal Additive Manufacturing, Wizap Corporation (2016).
- 18) M. Todai, T. Nakano, T. Liu, H.Y. Yasuda, K. Hagihara, K. Cho, M. Ueda and M. Takeyama: Addit. Manuf. 13 (2017) 61–70. doi:10.1016/j.addma.2016.11.001
- 19) T. Niendorf, S. Leuders, A. Riemer, H.A. Richard, T. Tröster and D. Schwarze: Metall. Mater. Trans. B 44 (2013) 794–796. doi:10.1007/s11663-013-9875-z
- 20) M. Hosomi and T. Maeda: J. Japan Inst. Metals 60 (1996) 433–439. doi:10.2320/jinstmet1952.60.4_433
- 21) D. Hu, A.J. Huang and X. Wu: Intermetallics 15 (2007) 327–332. doi:10.1016/j.intermet.2006.07.007
- 22) D.M. Dimiduk, D.B. Miracle, Y.W. Kim and M.G. Mendiratta: ISIJ Int. 31 (1991) 1223–1234. doi:10.2355/isijinternational.31.1223
- 23) Y. Koyanagi: Denkiseiko 88 (2017) 77–84.
- 24) S. Yokoshima and M. Yamaguchi: Materia Japan 35 (1996) 542–550. doi:10.2320/materia.35.542
- 25) T. Nakamoto, T. Kimura and N. Shirakawa: J. Soc. Instrum. Control Eng. 54 (2015) 392–398. doi:10.11499/sicejl.54.392
- 26) K. Gokan, Y. Yamagishi, K. Mizuta, K. Kakehi and M. Onoi: Trans. JSME 87 (2021) 21-00146. doi:10.1299/transjsme.21-00146