Abstract
The effect of oxygen addition on the microstructure formation during cooling from the β phase in the Ti–Nb alloy was investigated. The alloy ingots of Ti–(13∼20) at%Nb–(0∼3) at%O were arc-melted. They were homogenized at 1200°C for 3.6 ks and then hot-rolled at 850°C into 1.5 mm thick sheets. The disk specimen of 3 mm diameter was heated up to β phase field at 1000°C in the differential thermal analysis apparatus. And then specimen was cooled to room temperature at a cooling rate of 20°C/min. The β → α transformation was accelerated by the oxygen addition in Ti–(13∼15) at%Nb alloys. On the other hand, the oxygen addition promoted β → isothermal ωi transformation in Ti–(16∼20) at%Nb alloys. The promoting effect increased up to 1.5% oxygen, but the effect weakened by adding more than 1.5 at% oxygen in Ti–(18, 20) at%Nb alloys. The addition of oxygen over 3.0 at%O might suppress the β → ωi transformation in Ti–20 at%Nb alloy.
1. Introduction
The ω phase is formed as a metastable structure during quenching or aging of the β phase in Ti and Zr alloys containing the β-stabilizers, such as niobium and molybdenum. Since the ω phase formation affects mechanical properties, mostly leading to brittleness, many researchers studied it experimentally and theoretically.1–7) The amount of the ω phase is critical for mechanical properties. If the ω phase volume fraction is less than 0.6, the ω phase strengthens titanium alloys with reasonable ductility.3) The amount of the athermal ω phase, ωa, would change depending on the concentration of the β-stabilizers. The lower and upper limits of the β-stabilizer’s concentration for the occurrence of β → ωa transformation in various Ti alloys can be arranged in terms of the average valence electron density, e/a. They are approximately 4.13 and 4.2, respectively.8) To reduce the amount of the ωa phase, β-stabilizers concentration in Ti alloys should be increased as the e/a value gets close to 4.2. The amount of the ωa phase can also be adjusted by changing α-stabilizers concentration in Ti alloys. The addition of the α-stabilizers, i.e., aluminum, tin, and oxygen, suppresses the formation of the ωa phase.3) Williams reported that increasing oxygen content suppressed the ωa phase formation in Ti alloys.9) Adding 0.15 mass% oxygen in Ti–20 mass%V suppressed the ωa phase formation.10) Kawano et al. also showed that the suppression of ωa phase formation was observed in Ti–18Nb–3O alloy.11) The oxygen addition in a Ti alloy generally suppresses ωa phase formation. However, the effect of oxygen addition on the isothermal ω phase, ωi, formation is still under discussion. Froes et al. examined the formation kinetics of the ωi phase in β matrix in the Ti–11.5Mo–6Zr–4.5Sn in mass% (Beta III) with a different oxygen levels of 0.17 and 0.28 mass%. They showed that increasing oxygen content accelerated the kinetics of α phase formation and retarded those of ωi phase formation.12) Niinomi et al. investigated the stability of the ωi phase precipitates using two-step aging in the Ti–29Nb–13Ta–4.6Zr (mass%) alloy. The stability of ωi particles formed by the first step aging at 300°C was increased as oxygen content increased from 0.1 to 0.4 mass% in the second step aging at 450°C. The partitioning of oxygen to the ωi particles was confirmed, and the high concentration of oxygen in the ωi particles stabilized the ωi phase.13) Kathleen and Marquis investigated the influence of oxygen on the ωi precipitation during aging in the Ti–20 at%Nb alloy with up to about 5 at%O. They revealed that oxygen partitioned to the ωi phase during aging and the region of ωi phase stability expanded to the higher temperatures, suggesting that oxygen increases ωi phase stability.14) As described above, there are discrepancies for the role of oxygen addition on the the ωi phase formation. Acceleration or suppression of the ωi phase may vary depending on not only β-stabilizers concentration but also oxygen concentration. The present study, therefore, aims to reveal the effect of oxygen addition on the ωi phase formation in Ti–(13∼20) at%Nb alloys with focusing on the start temperature of the ωi phase formation during cooling process from high temperature β phase field.
2. Experimental Procedures
Sponge titanium (>99 mass%), granular niobium (>99.9 mass%), TiO powder (99.9 mass%), and titanium foil (>99.5 mass%) were used for the sample preparation. These pure metals and oxides were weighed for a nominal alloy composition of Ti–(13, 14, 15, 16, 17) at%Nb–(0, 1.0, 1.5, 3.0) at%O, Ti–18 at%Nb–(0, 0.5, 0.7, 1.0, 1.5, 3.0) at%O, and Ti–20 at%Nb–(0, 0.3, 0.7, 1.0, 1.5, 3.0) at%O. The TiO powder was wrapped in titanium foil during weighing. A button-shaped ingot of 10 g was arc-melted using a tungsten electrode in a water-cooled copper hearth. A pure titanium block was melted to purify the argon gas atmosphere before argon arc melting. The alloy button was melted eight times and was flipped over before each melting run to create a uniform composition. The niobium and oxygen concentrations of the alloys were measured by energy dispersive spectroscopy (JEOL: JEM-6310) and the infrared absorption method (LECO: ONH836), respectively. The ingot was wrapped with tantalum foil, and after evacuating, it was sealed in a quartz tube filled with argon at 0.02 MPa. It was homogenized at 1200°C for 3.6 ks in the β phase and then quenched into iced brine. The homogenized alloy button was hot-rolled at 850°C to obtain an approximately 1.5 mm thick plate sample. The plate sample was fabricated into disks of about 3 mm in diameter. The disk was heated to the β phase field at 1000°C in the differential thermal analysis (DTA) apparatus and then cooled to room temperature at a cooling rate of 20°C/min for the DTA experiment. The microstructure of disks after the DTA experiment was examined by transmission electron microscopy (TEM).
3. Experimental Results
3.1 DTA experiment and microstructure analyses
The concentration of niobium in the alloys used in this study was within ±0.2 at% of the nominal composition. The oxygen-free alloys contained approximately 0.25 at% (0.075 mass%) oxygen, and the alloys to which oxygen was intentionally added exhibited about 0.25 at% higher than those of nominal compositions; however, in this study, they are displayed as the nominal composition hereafter. The nitrogen and hydrogen concentrations in the alloys were approximately 130 ppm and 40 ppm in weight percent, respectively. Hereafter, the composition will be displayed in the atomic percent, and the unit will be omitted.
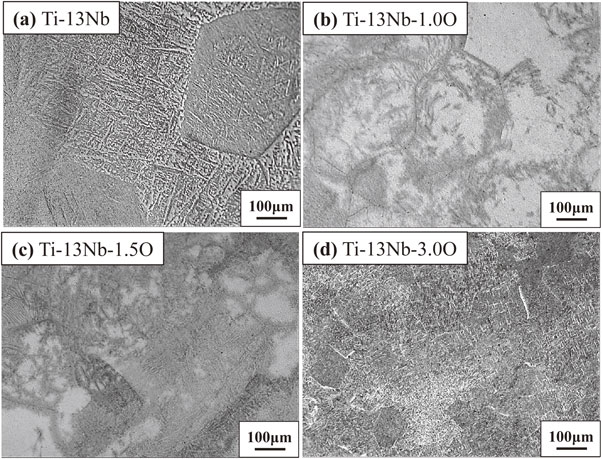
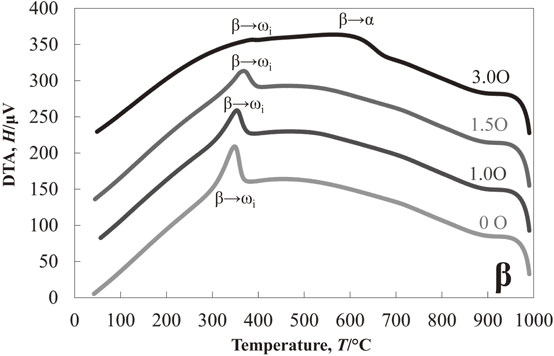
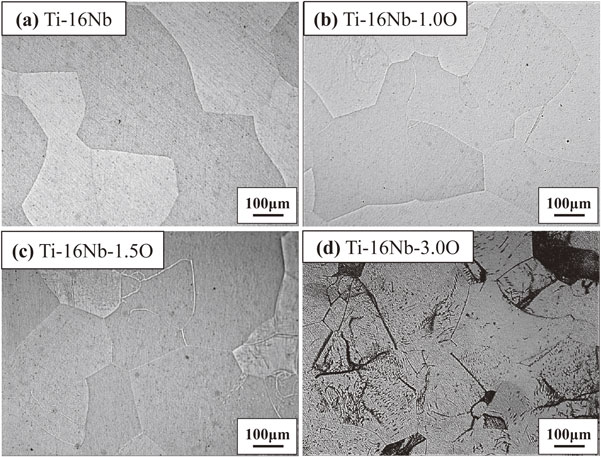
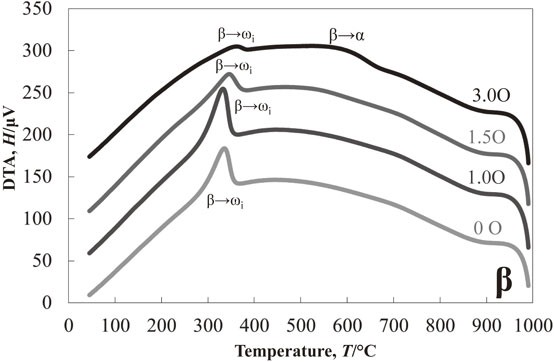
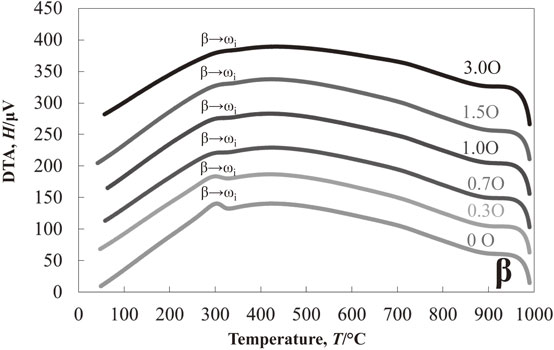
Figure 1 shows the results of the DTA experiment in the cooling process of Ti–13Nb–(0, 1.0, 1.5, 3.0)O alloys from 1000°C. One exothermic peak at about 425°C was detected in the oxygen-free Ti–13Nb alloy. On the other hand, two exothermic peaks at around 535°C and 445°C were found in the Ti–13Nb–1.0O alloy. The two exothermic peaks were also found in the Ti–13Nb–(1.5, 3.0)O alloys; at around 565°C and 445°C for the Ti–13Nb–1.5O alloy, and 630°C and 300°C for the Ti–13Nb–3.0O alloy, respectively. The exothermic peak at 300°C for the Ti–13Nb–3.0O alloy was weak and broadened. Optical micrographs of the Ti–13Nb–(0, 1.0, 1.5, 3.0)O alloys after the DTA experiments are shown in Fig. 2. The fine laths were found in the whole sample of Ti–13Nb alloy in Fig. 2(a). On the other hand, fine plates were separately nucleated along mainly large and small grain boundaries of the Ti–13Nb–1.0O alloy in Fig. 2(b). The number of fine plates increased as the oxygen concentration in the Ti–13Nb alloys increased, as shown in Fig. 2(c) and (d). The fine plates were homogeneously precipitated in the Ti–13Nb–3.0O alloy. The XRD profiles of Ti–13Nb–(0, 1.0, 1.5, 3.0)O alloys after the DTA experiments are shown in Fig. 3. The diffraction peaks of Ti–13Nb alloy were indexed as the α′′ phase. The diffraction peaks detected in the XRD profiles of Ti–13Nb–(1.0, 1.5, 3.0)O alloys were indexed as α, β and ω phases. The optical microscopy and XRD results revealed that the exothermic peak of Ti–13Nb alloy corresponded to β → α′′ phase transformation. The laths structure in Fig. 2(a) was formed by the β → α′′ martensitic transformation. In the Ti–13Nb–(1.0, 1.5, 3.0)O alloys β → α and β → ω phase transformations occurred because they consisted of α, β and ω phases after the DTA experiment. Previous studies showed that the phase transformation of β → α would occur at a higher temperature than that of β → ω. The exothermic peak in the DTA experiments for Ti–13Nb–(1.0, 1.5, 3.0)O alloys observed at a higher temperature was due to β → α, while that observed at a lower temperature was attributed to β → ω. Oxygen addition to Ti–13Nb alloy promoted the β → α and β → ω transformations instead of β → α′′ transformation. The exothermic peak observed at a high temperature in the DTA experiment of Ti–13Nb–(1.0, 1.5, 3.0)O alloys shifted to a higher temperature, indicating that the phase transformation of β → α was accelerated by the addition of oxygen. The exothermic peak of β → ω shifted to a higher temperature and then to a lower temperature as oxygen increased in Ti–13Nb–(1.0, 1.5, 3.0)O alloys. Figure 4 shows DTA curves of Ti–14Nb–(0, 1.0, 1.5, 3.0)O alloys in the cooling process from 1000°C. Optical microscopy and XRD analyses of Ti–14Nb–(0, 1.0, 1.5, 3.0)O alloys after the DTA experiment revealed that exothermic peaks observed in Fig. 4 could be explained in the same way as those of Ti–13Nb–(0, 1.0, 1.5, 3.0)O alloys in Fig. 1. However, all exothermic peaks in Fig. 4 shifted to a lower temperature than those in Fig. 1. The DTA curves for Ti–15Nb–(0, 1.0, 1.5, 3.0)O alloys in the cooling process from 1000°C are shown in Fig. 5. The exothermic peak at around 375°C for Ti–15Nb alloy seems to be double peaks. The exothermic peaks of Ti–15Nb–(1.0, 1.5, 3.0)O alloys were similar to those found in Figs. 1 and 4. Figure 6 shows the XRD profiles of Ti–15Nb–(0, 1.0, 1.5, 3.0)O alloys after the DTA experiment. Since the diffraction peaks of Ti–15Nb alloy were indexed as α′′, β and ω phases, the double exothermic peaks of Ti–15Nb alloy were attributed to the phase transformations of β → α′′ and β → ω. Optical microscopy and XRD results in Fig. 6 of Ti–15Nb–(1.0, 1.5, 3.0)O alloys after the DTA experiment clarified that exothermic peaks observed in Fig. 5 could be explained in the same way as those of Ti–(13, 14)Nb–(0, 1.0, 1.5, 3.0)O alloys in Figs. 1 and 4. Figure 7 shows DTA curves of Ti–16Nb–(0, 1.0, 1.5, 3.0)O alloys in the cooling process from 1000°C. A single exothermic peak was found in the Ti–16Nb–(0, 1.0, 1.5)O alloys, while two exothermic peaks were detected in the DTA curve of the Ti–16Nb–3.0O alloy. The exothermic peak at about 390°C in the Ti–16Nb–3.0O alloy was weak compared to those in the Ti–16Nb–(0, 1.0, 1.5)O alloys. Optical micrographs of Ti–16Nb–(0, 1.0, 1.5, 3.0)O alloys after the DTA experiments are shown in Fig. 8. The β grains were only observed in the Ti–16Nb–(0, 1.0, 1.5)O alloys, while the fine plates were dispersedly formed in the Ti–16Nb–3.0O alloy. The XRD profiles of Ti–16Nb–(0, 1.0, 1.5, 3.0)O alloys after the DTA experiments are shown in Fig. 9. The diffraction peaks of β and ω phases were observed in Ti–16Nb–(0, 1.0, 1.5)O alloys. On the other hand, the XRD profile of Ti–16Nb–3.0O alloy contained diffraction peaks of α, β and ω phases. Since the isothermal ω phase is often formed as nano-particles of less than 100 nm in β phase matrix, the formation of ω phase could not be resolved by optical microscopy, resulting in β grains being only observed in Figs. 8(a)–(c). It is interesting to see that the onset temperature of β → ω transformation of Ti–16Nb–(0, 1.0, 1.5)O alloys increased as oxygen concentration increased, indicating oxygen promoting β → ω transformation. DTA curves of Ti–17Nb–(0, 1.0, 1.5, 3.0)O alloys in the cooling process from 1000°C are shown in Fig. 10. A single exothermic peak was found in the Ti–17Nb–(0, 1.0, 1.5)O alloys, while two exothermic peaks were detected in the DTA curve of the Ti–17Nb–3.0O alloy. The DTA curves in Fig. 10 were similar to those in Fig. 9. However, the exothermic peaks in Fig. 10 were shifted to a lower temperature than those in Fig. 9. Optical microscopy and XRD analyses of Ti–17Nb–(0, 1.0, 1.5, 3.0)O alloys after the DTA experiment revealed that the single exothermic peak in Ti–17Nb–(0, 1.0, 1.5)O alloys was due to β → ω transformation, while two exothermic peaks in Ti–17Nb–3.0O alloys were attributed to β → α and β → ω transformations. Figure 11 shows DTA curves of Ti–18Nb–(0, 0.5, 0.7, 1.0, 1.5, 3.0)O alloys in the cooling process from 1000°C. A single exothermic peak was detected in each DTA curve. Optical microscopy and XRD analyses of Ti–18Nb–(0, 0.5, 0.7, 1.0, 1.5, 3.0)O alloys after the DTA experiment revealed that the single exothermic peak in Fig. 11 was due to β → ω transformation. Figure 12 shows DTA curves of Ti–20Nb–(0, 0.3, 0.7, 1.0, 1.5, 3.0)O alloys in the cooling process from 1000°C. A single exothermic peak was detected in each DTA curve. Optical microscopy and XRD analyses of these alloys after the DTA experiment clarified that the single exothermic peak in Fig. 12 was due to β → ω transformation. Figure 13 shows TEM micrographs (a) selected area diffraction pattern and (b) dark-field image of ω phase of Ti–20Nb after the DTA experiment. The diffraction pattern can be indexed as β and ω phase, and the crystallographical orientation relationship between β and ω phases was the same in the previous papers.15,16)
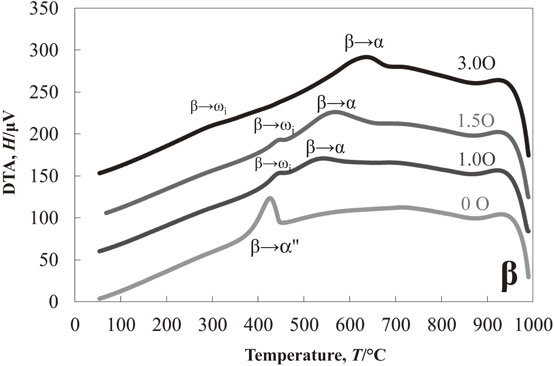
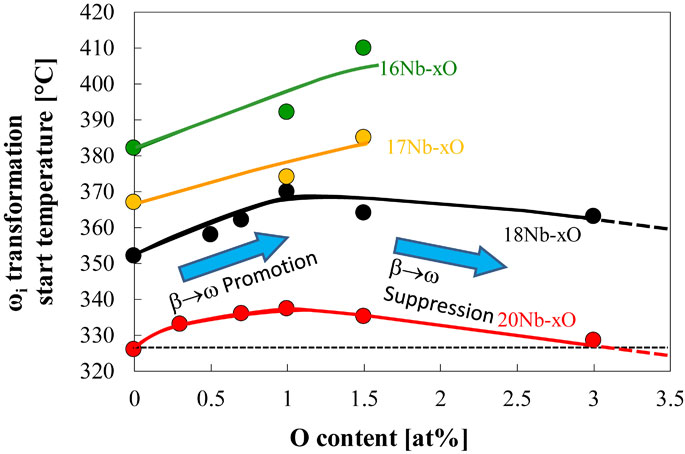
Figure 14 represents the variation of the onset temperature for β → ωi phase transformation as a function of oxygen concentration in the alloys, which exhibited a single exothermic peak of β → ω phase in the DTA experiment. Therefore, since the β → α phase transformation was followed by the β → ω phase transformation in Ti–(16, 17)Nb–3.0O alloys, the data for these alloys are not plotted in Fig. 14. The onset temperature of β → ω phase transformation increased as the oxygen content increased up to about 1.5 at%, then decreased when more oxygen was added, i.e., 3.0 at% oxygen. It should be noted that the oxygen addition promoted β → ω transformation, but excess oxygen addition would suppress its transformation, e.g., over 3.0 at% for Ti–20Nb alloy as shown in Fig. 14.
4. Discussion
4.1 Effect of the oxygen addition on the β → α′′ martensitic transformation and β → α diffusional transformation during the cooling process
Figures 1 and 4 show that oxygen addition in the Ti–(13, 14)Nb alloys suppressed the β → α′′ phase transformation. Because the oxygen atoms are an interstitial element and induce local distortion of the β-phase lattice, the oxygen addition would inhibit the collective displacement of the atoms required for martensitic transformation. The formation of strain field by oxygen addition should be a reason for the suppression of the β → α′′ transformation.11) The suppression of β → α′′ transformation would also be related to the acceleration of β → α transformation by oxygen addition. The phase diagram of the Ti–O binary alloy indicates that oxygen acts as an α phase stabilizer. As shown in Figs. 1, 4, and 5, the addition of oxygen increased the temperature of the exothermic peak of β → α transformation in the DTA curves of Ti–(13, 14, 15)Nb containing oxygen, indicating the promotion of β → α transformation induced by oxygen addition. The formation of the α phase in the β phase yielded partitioning of niobium and oxygen. The niobium was partitioned to the β phase, and the oxygen was concentrated in the α phase. The partitioning of niobium to the β phase occurred in the Ti–(13, 14)Nb alloys could promote β → ωi transformation rather than β → α′′ transformation. As shown in the DTA experiments of Ti–(13∼20)Nb alloys, if the niobium content in the β phase exceeds 16 at%, β → ωi transformation will take place. However, the explanation for the suppression of β → α′′ transformation based on partitioning of alloying elements can not be perfectly applied to the DTA curves of Ti–(13, 14)Nb containing oxygen. The exothermic peaks of β → ωi transformation were detected at temperatures from about 400 to 450°C in the Ti–(13, 14)Nb–(1.0, 1.5)O and Ti–15Nb–(1.0, 1.5, 3.0)O alloys, while the exothermic peaks of β → ωi transformation in the Ti–(16∼20)Nb–(0∼3.0)O alloys were observed at temperatures from about 300 to 400°C. This temperature difference for β → ωi transformation was attributed that the β → ωi transformation, which followed the β → α transformation, could be accelerated due to the heterogeneous nucleation of the ωi phase on α phase precipitates.
4.2 Effect of the oxygen addition on the β → ωi transformation during the cooling process
The oxygen addition accelerated the β → isothermal ωi transformation, as shown in Fig. 14. It should be noted that the oxygen addition suppressed the β → athermal ωa transformation in various Ti alloys.3,9–11) Williams explained the reason for the suppression of β → ωa transformation due to the oxygen addition was as follows. The stress field of linear defects required for the occurrence of the β → ωa transformation should interact with those of the interstitial oxygen atoms. Such the interaction would impede the ordering of neighboring liner defects for the β → ωa transformation, resulting in the suppression of the β → ωa transformation.9) Niu showed that the oxygen atoms in collapsing {111} planes required for β → ωa transformation should increase the energy barrier (29 meV/atom) of the β → ωa transformation remarkably.17) Thus, the strain field of the interstitial oxygen atoms in the β phase lattice is the cause of suppression of β → ωa transformation by oxygen addition.
In general, the phase transformation is controlled by not only elastic strain energy but also chemical free energy difference, i.e., the driving force for transformation. One possible reason for the promotion of the β → ωi transformation due to the oxygen addition is the increase of driving force for the β → ωi transformation by the oxygen addition. Uesugi reported the Gibbs free energy of β and ω phases and gave an insight into the effect of oxygen addition on the β → ωi transformation from the first principle calculation. The calculation found that from the enthalpy point of view, oxygen stabilizes the β phase to the ω phase, while from the entropy point of view, oxygen stabilizes the ω phase to the β phase. This suggests oxygen may act as a ω phase stabilizer at elevated temperatures. The Gibbs free energy of β and ω phases was evaluated in Ti–Nb and Ti–Nb–2.7 at%O system, and those results revealed that the T0 temperature of the β/ωi phases in the Ti–Nb system would be increased by the 2.7 at% oxygen, suggesting the oxygen addition promotes the β → ωi transformation.18) Niu et al. indicated that the oxygen atoms in the uncollapsing {111} planes exert a much smaller retarding effect (5 meV/atom) on the β → ωi transformation.17) Therefore, if there is a time for oxygen diffusion, oxygen atoms diffuse away from the collapsing {111} planes to the uncollapsing {111} planes and then enter into the ωi region to stabilize the ωi phase. However, it should be noted that Fig. 14 also suggested that excess oxygen over about 3.0 at% may suppress the β → ωi transformation in Ti–20Nb alloy. Since the diffusion of interstitial oxygen atoms in titanium is significantly slower than that of interstitial carbon in steels.19) When the amount of oxygen increases, it won’t be easy for all oxygen atoms to be away from the region of the β → ωi transformation and act as inhibiter for collapsing {111} planes for the β → ωi transformation. It indicates that the lower the transformation temperature, the slower the diffusion, so the suppressing effect of oxygen on the transformation will be more apparent. This effect can be seen in Fig. 14. The maximum promotion of the start temperature for β → ωi transformation by oxygen addition in Ti–18Nb and Ti–20Nb alloys were about 20 and 10°C, where the transformation temperatures for β → ωi transformation of these alloys were about 350–370°C and 325–335°C, respectively. Froes et al. showed that oxygen addition increased the incubation time for ωi phase formation in the Ti–11.5Mo–6Zr–4.5Sn in mass% (Beta III) alloy.12) And they also illustrated that as increasing aging temperature over about 350°C, the difference in the incubation time decreased as increasing aging temperature and finally, over 450°C, oxygen might accelerate ωi phase formation, it did not occur in reality due to the formation of α phase. Alloying elements should influence the diffusion of oxygen in Ti alloys. The alloying elements in the Beta III alloy might slow the diffusion of oxygen atoms and let oxygen atoms act as inhibitors for the collapsing {111} planes for the β → ωi transformation.
The effects of oxygen addition on the β → ωi transformation may vary from acceleration to suppression depending on whether the oxygen atoms could diffuse away from the region of β → ωi, i.e., the transformation temperature of the β → ωi, oxygen concentration, and interaction of the alloying elements for oxygen diffusion.
5. Conclusions
The influence of the oxygen addition on the microstructure formation in Ti–Nb alloys during cooling from the β phase was examined, and the following conclusions were obtained.
The promotion of the β → ωi transformation by the oxygen addition was confirmed in the Ti–(16∼20)Nb alloys. The promotion effect of the oxygen addition on the β → ωi transformation was increased up to 1.5 at%O and then decreased for further addition of oxygen. The addition of oxygen over 3.0 at% would suppress the β → ωi transformation in Ti–20Nb alloy. Although oxygen would act as the ωi phase stabilizer from the thermodynamic point of view, it also could work as an inhibitor for the collapsing {111} planes for the β → ωi transformation. Therefore, the oxygen diffusion is needed to initiate the collapsing {111} planes for the β → ωi transformation, and then oxygen may occupy the octahedral site of the ω phase to stabilize.
The oxygen addition accelerated the β → α transformation in the Ti–Nb alloys during cooling. The β → α transformation would induce the partitioning of solute atoms, i.e., niobium and oxygen would concentrate in the β and the α phases, respectively. The β → α′′ martensitic transformation was suppressed by both the strain field of oxygen atoms and the condensation of niobium in the β phase due to the β → α transformation.
Acknowledgments
The authors would like to thank Sota Kawano, a graduate student at Ehime University, for his experiments. This work was partly supported by the education and research funds of the Light Metal Educational Foundation, Inc. This work was also partly supported by JKA and its promotion funds (27-165) from Auto Race. We would like to thank the Mechanical & Material Research Laboratory, Tottori Institute of Industrial Technology, for the measurement of the oxygen, nitrogen, and hydrogen content in the alloys.
REFERENCES
- 1) B.S. Hickman: J. Mater. Sci. 4 (1969) 554–563. doi:10.1007/BF00550217
- 2) S.K. Sikka, Y.K. Vohra and R. Chidambaram: Prog. Mater. Sci. 27 (1982) 245–310. doi:10.1016/0079-6425(82)90002-0
- 3) J.C. Williams, B.S. Hickman and H.L. Marcus: Metall. Trans. 2 (1971) 1913–1919. doi:10.1007/BF02913423
- 4) J. Nejezchlebová, M. Janovská, H. Seiner, P. Sedlák, M. Landa, J. Šmilauerová, J. Stráský, P. Harcuba and M. Janeček: Acta Mater. 110 (2016) 185–191. doi:10.1016/j.actamat.2016.03.033
- 5) D. De Fontaine, N.E. Paton and J.C. Williams: Acta Metall. 19 (1971) 1153–1162. doi:10.1016/0001-6160(71)90047-2
- 6) H.Y. Kim, Y. Al-Zain, T. Inamura, H. Hosoda and S. Miyazaki: Ti 2011 - Proc. 12th World Conf. Titan., 2, (2012) pp. 1110–1113.
- 7) D. de Fontaine: Metall. Trans. A 19 (1988) 169–175. doi:10.1007/BF02652523
- 8) E.W. Collings: The Physical Metallurgy of Titanium Alloys, (American Society for Metals, Ohio, 1984).
- 9) J.C. Williams, D. de Fontaine and N.E. Paton: Metall. Trans. 4 (1973) 2701–2708. doi:10.1007/BF02644570
- 10) S. Hanada and O. Izumi: Metall. Trans. A 18 (1987) 265–271. doi:10.1007/BF02825707
- 11) S. Kawano, S. Kobayashi and S. Okano: Mater. Trans. 60 (2019) 1842–1849. doi:10.2320/matertrans.ME201908
- 12) F.H. Froes, C.F. Yolton, J.M. Capenos, M.G.H. Wells and J.C. Williams: Metall. Mater. Trans. A 11 (1980) 21–31. doi:10.1007/BF02700435
- 13) M. Niinomi, M. Nakai, M. Hendrickson, P. Nandwana, T. Alam, D. Choudhuri and R. Banerjee: Scr. Mater. 123 (2016) 144–148. doi:10.1016/j.scriptamat.2016.06.027
- 14) K. Chou and E.A. Marquis: Acta Mater. 181 (2019) 367–376. doi:10.1016/j.actamat.2019.09.049
- 15) J.M. Silcock: Acta Metall. 6 (1958) 481–493. doi:10.1016/0001-6160(58)90111-1
- 16) I.A. Bagariatskii and G.I. Nosova: Sov. Phys. Crystallogr. 3 (1959) 15–26.
- 17) J.G. Niu, D.H. Ping, T. Ohno and W.T. Geng: Model. Simul. Mater. Sci. Eng. 22 (2014) 015007. doi:10.1088/0965-0393/22/1/015007
- 18) T. Uesugi: Report of Titanium Metastable Phase/Precipitation Phase Research Group, Research Group Report 77: Japan Inst. Light Metals, Tokyo, (2020) pp. 55–65.
- 19) H. Nakajima and M. Koiwa: ISIJ Int. 31 (1991) 757–766. doi:10.2355/isijinternational.31.757