Abstract
One of the important physico-chemical properties of materials under metal additive manufacturing process is the interfacial properties of liquid/solid such as the wettability between a liquid and its own solid. However, the data of the wettability between a liquid and its own solid for metal systems is limited. In this study, we propose the evaluation method for the interfacial properties between liquid alloy and its solid alloy based on the morphology of as built surface in powder bed fusion. The liquid/solid contact angle for Ti–6 mass%Al–4 mass%V is measured based on the sample built by electron-beam additive manufacturing, and its interfacial tension is evaluated by Young’s equation. The contact angle and interfacial tension between Ti–6 mass%Al–4 mass%V liquid alloy and its solid alloy are found to be 12° and 376 mN/m, respectively.
This Paper was Originally Published in Japanese in J. JILM 72 (2022) 304–307.
1. Introduction
Metal additive manufacturing is a new method for manufacturing highly functional products with high added value, which cannot be achieved by conventional technology.1) Controlling crystal orientation (structure) and shape is a strong factor in additive manufacturing, and research on it has proceeded in metal systems.2–13) Powder bed fusion is one of the methods for metal additive manufacturing. In this method, solidification follows the melting of a source metal powder, which leads to complicated phenomena involving solids and liquids.14–17) Therefore, it is essential to consider various physicochemical properties related to solid and liquid substances as control factors.
Wettability is an interfacial property related to the material bonding and is one of the control factors in powder bed fusion. While good wettability guarantees bonding between layers owing to easy spreading of liquid on solid, bad wettability causes defects owing to lack of bonding.14) The target is wettability between a liquid and its own solid because basically the same materials are accumulated in powder bed fusion. Because measuring the wettability between a liquid and its own solid needs particular conditions like a steep temperature gradient, even measurements of pure metal systems have been limited owing to the difficulty of experiment at high temperature in such systems.18) Therefore, the contact angle between a liquid and its own solid is conveniently treated as 0° in simulations except for specific cases such as oxygen effects.16) Knowledge of wettability is, thus, essential for deep understanding of such interfacial phenomena and simulating with high accuracy.16)
This work proposes a new method for measuring the contact angle between a liquid and its solid based on the three-dimensional surface morphology of a sample built by metal additive manufacturing with powder bed fusion. We tested this method by measuring the contact angle between liquid Ti–6 mass%Al–4 mass%V alloy and its solid using the three-dimensional morphology of the side surface of a sample built by electron-beam additive manufacturing. In addition, the interfacial tension between liquid and solid of the Ti–6 mass%Al–4 mass%V alloy was obtained from the resulting contact angle and literature values of the surface tensions for liquid and solid of the Ti–6 mass%Al–4 mass%V alloy.
2. Theory
In powder bed fusion, building proceeds by repeatedly spreading metal and alloy powders and subsequently melting them with an electron beam or a laser beam. A surface with a certain degree of smoothness is obtained on the top layer of the built sample because the spread powders are melted completely. However, non-melted material powders adhere on the side surface of the built sample because the material powders are close to the melts and the melts wet on the powder.17) This study focuses on the morphology of the side surface where the material powders adhere.
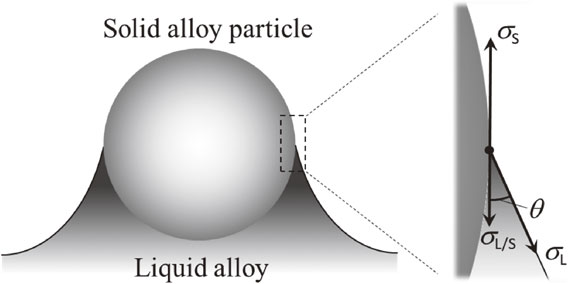
Figure 1 shows the cross-sectional schematic where a material powder is partly taken into the melt on the side surface of a built sample. The surface tension of the solid, σS, surface tension of the liquid, σL, and interfacial tension between the liquid and solid, σL/S, are balanced at the wetting front of the melt on the solid, i.e. the triple point where the solid, liquid, and gas phases coexist. Then, from Young’s equation,
| \begin{equation}
\sigma_{\text{S}} = \sigma_{\text{L}} \cdot \cos\theta + \sigma_{\text{L/S}},
\end{equation}
| (1) |
the liquid–solid contact angle for a built material, θ, is determined as the angle between the liquid surface and the tangential direction to the solid surface where the forces are applied. In addition, the interfacial tension between the liquid and solid for a built material can be calculated from the measured contact angle.
3. Experimental Methods
A Ti–6 mass%Al–4 mass%V alloy powder with a particle size of 45–100 µm (Arcam AB) was used as the sample for observing the surface morphology. A cylindrical sample with a diameter of 10 mm and height of 7 mm was built by metal powder-based additive manufacturing with an electron beam. The building direction was the axis of the cylindrical sample. The process parameter scheme involved in the apparatus was used for the building conditions such as the beam strategy, beam velocity, and beam energy. There is a method for measuring the contact angle based on the sample cross-section, as shown in Fig. 1. However, this requires statistical treatment of an enormous number of measurements because a scatter appears in the contact angle owing to the deviation from an ideal cross-section.19,20) Our group20) found that the angle could be measured with high accuracy from the three-dimensional morphology at the target position to overcome the problem of angle measurement by cross-sectional observation. Therefore, this study measured the angle using the three-dimensional morphology observed with a 3D laser microscope (VK-9710, Keyence).
4. Results and Discussion
The cylindrical built sample is shown in Fig. 2(a). As mentioned above, the side of the cylindrical sample is a rough surface where the un-melted powder sample adheres, while the top is a smooth surface. Figure 2(b) is the magnified image of the side surface of the cylindrical sample observed with an SEM. We find that the un-melted powder sample is partly taken into the region thought to be melted during the building process. Liquid and solid are expected to coexist because a large temperature gradient is formed by local heating due to the narrow beam irradiation region in metal additive manufacturing.17) Solidification theory based on the local-equilibrium assumption can be applied to metal additive manufacturing.21) In this work, solid and liquid are expected to coexist in the local equilibrium state under the large temperature gradient. Here, this position is the point for measuring the contact angle between the liquid and solid. However, the side surface of the sample includes a mix of the solid/liquid coexistence state and non-coexistence state. This is attributed to the large scatter of the temperature history due to such factors as the packing condition of the surrounding powders, local temperature gradient, and cooling velocity. Thus, appropriately setting the built-sample shape and building conditions can enable control of the local region to realize solid/liquid coexistence.

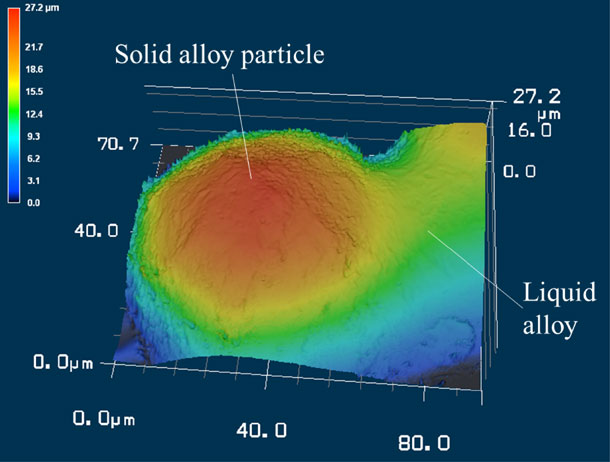
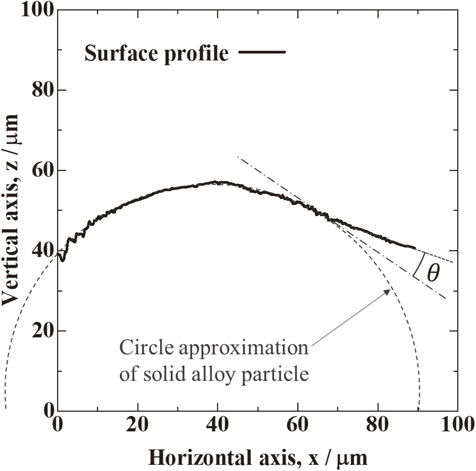
Figure 3 shows the resulting three-dimensional morphology of the sample surface measured with the 3D laser microscope, where a solid particle is taken into the melted alloy surface. The figure shows the position where the melt wets the upper hemisphere of the particle. This position was used to measure the surface morphology with the 3D laser microscope because the laser can irradiate the interface between the solid particle and melt. As a result, the un-melted solid particle is observed as part of a sphere on the melt region. It is thought that Marangoni convection, which is generated by the temperature dependence of surface tension under a temperature gradient, has little effect on the surface morphology of the melt because no disturbance of the melt region is observed around the solid particle. Figure 4 shows the cross-sectional profile obtained from the three-dimensional surface morphology in Fig. 3. The round shape in the figure is a solid particle, and the surface morphology departs from the round shape at certain points on the right side of the figure. In this work, the circle approximation was applied to the round shape of surface morphology, which was regarded as the solid particle, by assuming that the solid particle is a sphere.

Then, the point where the surface morphology departs from the spherical approximation was regarded as the three-phase contact line, i.e. the wetting front of the melt on the solid particle, and the contact angle was measured at this point.
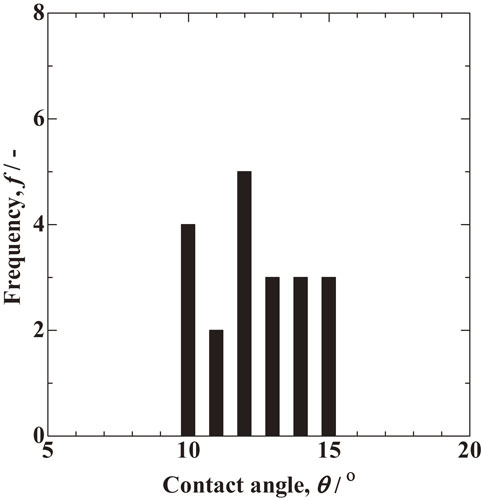
Figure 5 shows 20 contact-angle measurements in the states similar to those of the solid particle and melt in Fig. 4. All measured contact angles are in the very narrow range 10–15°, which means that angle measurement has high accuracy when based on surface morphology. In addition, the small scatter of the measurements indicates that local equilibrium is realized at all observed measurement positions. The scatter in angle measurements is attributed to the deviation of an actual particle from a spherical shape and the deviation of the surface from a spherical surface due to roughness. An average measured contact angle of 12 ± 3° was obtained between liquid and solid of the Ti–6 mass%Al–4 mass%V alloy. It should be noted that this contact angle is only the apparent one because the sample has been cooled and solidified. However, we expect that the state at high temperature remains to some extent after cooling because a high cooling rate is predicted owing to the local heating in a narrow irradiation region in metal additive manufacturing.17) The resulting angle measurement in this work means that the assumption of a 0° contact angle is not valid for the Ti–6 mass%Al–4 mass%V alloy. In addition, we predict that the wettability becomes poor, i.e. the contact angle becomes high, which makes it easier for defects to arise during manufacturing. Therefore, we suggest that the defect generation rate in an actual situation is higher than when the contact angle is assumed to be 0°.
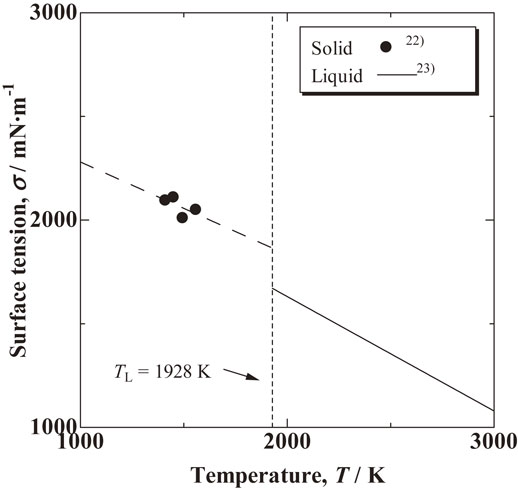
The solid surface tension, σS, liquid surface tension, σL, liquid/solid interfacial tension, σL/S, and contact angle, θ, are related in eq. (1), as shown in Fig. 1. Measured values have been reported for the solid22) and liquid23) surface tensions in Ti–6 mass%Al–4 mass%V alloy. The interfacial tension between liquid and solid of the Ti–6 mass%Al–4 mass%V alloy was calculated using these literature values. Figure 6 shows the reported temperature dependence of surface tension for solid and liquid of the Ti–6 mass%Al–4 mass%V alloy. In this study, the surface tensions of Ti–6 mass%Al–4 mass%V alloy at the liquidus temperature, 1928 K,23,24) were used to calculate the interfacial tension because the solid and liquid phases of Ti–6 mass%Al–4 mass%V alloy were assumed to coexist. The solid surface tension at the liquidus temperature is 1861 mN/m from its temperature function σS = 2729 − 0.45 · T (mN/m) obtained from the measured data in the literature. Meanwhile, the liquid surface tension at the liquidus temperature is 1520 mN/m from its temperature function σL = 2584 − 0.552 · T (mN/m). Using these values, 376 mN/m was obtained as the interfacial tension between liquid and solid of the Ti–6 mass%Al–4 mass%V alloy. The accuracy of the contact angle measurement and the scatter in literature data on solid and liquid surface tensions lead to an error in interfacial tension in this study. The error in the contact angle measurement in this work is ±3°, which is ±1% in terms of cos θ, as mentioned above. The reported error in surface tension for solid Ti–6 mass%Al–4 mass%V alloy is approximately ±10% (±200 mN/m),22,25) and that for its liquid is less than ±1% (±15 mN/m).23) On the basis of eq. (1), the calculated interfacial tension contains a large error due to the large scatter of literature values of the solid surface tension. There are no measured data on the contact angle or interfacial tension between liquid and solid of the Ti–6 mass%Al–4 mass%V alloy. However, Zhai et al.26) calculated an interfacial tension of 318 mN/m with the Thompson–Spaepen model.27) The average interfacial tension obtained in this work is similar to that obtained by model calculation, although the strict discussion is impossible because the value obtained by Zhai et al. is a model calculation and in addition there is an inherent error in the interfacial tension calculated in this work.
The following are possible reasons for the difference between the interfacial tension obtained in this work and that in the model calculation by Zhai et al.26) One is the temperature difference. The temperature in our work, 1928 K, is different from that in the model calculation, 1889 K, which results in a different interfacial tension because the model considers the temperature dependence of physical properties. In addition, the model calculation assumes a bcc structure for solid Ti–6 mass%Al–4 mass%V alloy, while actual Ti–6 mass%Al–4 mass%V alloy is predicted to have a complicated microstructure.28,29) This is one of the factors that cause the difference between the interfacial tension obtained in this work and that in the model calculation.
5. Conclusions
In this study, we measured two interfacial properties, the contact angle and interfacial tension, between liquid Ti–6 mass%Al–4 mass%V alloy and its solid using the surface morphology of the sample built by electron-beam additive manufacturing with powder bed fusion. The following are the findings:
-
(1)
The contact angle between the liquid and solid phases of the Ti–6 mass%Al–4 mass%V alloy was accurately measured using the 3D morphology of the side surface of a built sample.
-
(2)
The contact angle and interfacial tension between liquid and solid of the Ti–6 mass%Al–4 mass%V alloy are 12° and 376 mN/m, respectively.
Acknowledgement
This work was partly supported by the Council for Science, Technology and Innovation (CSTI) and the Cross-Ministerial Strategic Innovation Promotion Program (SIP).
REFERENCES
- 1) T. Nakano (joint author): Technology Roadmap 2021–2030 All Industry Edition, (Nikkei Business Publications, Inc., Tokyo, 2020) pp. 392–395.
- 2) T. Nakano: Kikaigijutsu 67(12) (2019) 21–27.
- 3) T. Nakano: J. Jpn. Weld. Soc. 89 (2020) 27–37. doi:10.2207/jjws.89.27
- 4) Y. Koizumi: J. Smart Process. 8 (2019) 132–138. doi:10.7791/jspmee.8.132
- 5) T. Ishimoto, K. Hagihara, K. Hisamoto, S.-H. Sun and T. Nakano: Scr. Mater. 132 (2017) 34–38. doi:10.1016/j.scriptamat.2016.12.038
- 6) K. Hagihara, T. Nakano, M. Suzuki, T. Ishimoto, Suyalatu and S.H. Sun: J. Alloy. Compd. 696 (2017) 67–72. doi:10.1016/j.jallcom.2016.11.191
- 7) M. Todai, T. Nakano, T. Liu, H.Y. Yasuda, K. Hagihara, K. Cho, M. Ueda and M. Takayama: Addit. Manuf. 13 (2017) 61–70. doi:10.1016/j.addma.2016.11.001
- 8) S.-H. Sun, K. Hagihara and T. Nakano: Mater. Des. 140 (2018) 307–316. doi:10.1016/j.matdes.2017.11.060
- 9) T. Ishimoto, J. Yasutomi, S. Sugimoto and T. Nakano: J. Smart Process. 7 (2018) 229–232. doi:10.7791/jspmee.7.229
- 10) O. Gokcekaya, N. Hayashi, T. Ishimoto, K. Ueda, T. Narushima and T. Nakano: Addit. Manuf. 36 (2020) 101624. doi:10.1016/j.addma.2020.101624
- 11) T. Ishimoto, S. Wu, Y. Ito, S.-H. Sun, H. Amano and T. Nakano: ISIJ Int. 60 (2020) 1758–1764. doi:10.2355/isijinternational.ISIJINT-2019-744
- 12) O. Gokcekaya, T. Ishimoto, T. Todo, R. Suganuma, R. Fukushima, T. Narushima and T. Nakano: Crystals 11 (2020) 9. doi:10.3390/cryst11010009
- 13) S.-H. Sun, K. Hagihara, T. Ishimoto, R. Suganuma, Y.-F. Xue and T. Nakano: Addit. Manuf. 47 (2021) 102329. doi:10.1016/j.addma.2021.102329
- 14) S. Das: Adv. Eng. Mater. 5 (2003) 701–711. doi:10.1002/adem.200310099
- 15) J.-P. Kruth, G. Levy, F. Klocke and T.H.C. Childs: CIRP Ann. Manuf. Technol. 56 (2007) 730–759. doi:10.1016/j.cirp.2007.10.004
- 16) C. Körner, A. Bauereiß and E. Attar: Modelling Simul. Mater. Sci. Eng. 21 (2013) 085011. doi:10.1088/0965-0393/21/8/085011
- 17) M. Markl and C. Körner: Annu. Rev. Mater. Res. 46 (2016) 93–123. doi:10.1146/annurev-matsci-070115-032158
- 18) N. Eustathopoulos, M.G. Nicholas and B. Drevet: Wettability at High Temperature, (Elsevier Science Ltd., Amsterdam, 1999) pp. 175–197.
- 19) S. Hara, M. Hanao and K. Ogino: J. Japan Inst. Metals 57 (1993) 164–169. doi:10.2320/jinstmet1952.57.2_164
- 20) M. Nakamoto, M. Likukkonen, M. Friman, E. Heikinheimo, M. Hämäläinen and L. Holappa: Metall. Mater. Trans. B 39 (2008) 570–580. doi:10.1007/s11663-008-9168-0
- 21) Y. Shimono, M. Oba, S. Nomoto, Y. Koizumi and A. Chiba: Proc. 27th Annu. Int. Solid Free. Fab. Symp., University of Texas, Austin, (2017) pp. 1048–1057.
- 22) T.A. Roth and P. Suppayak: Mater. Sci. Eng. 35 (1978) 187–196. doi:10.1016/0025-5416(78)90120-9
- 23) R. Aune, L. Battezzati, R. Brooks, I. Egry, H.J. Fecht, J.P. Garandet, K.C. Mills, A. Passerone, P.N. Quested, E. Ricci, S. Schneider, S. Seetharaman, R.K. Wunderlich and B. Vinet: Microgravity Sci. Technol. 16 (2005) 11–14. doi:10.1007/BF02945937
- 24) M. Boivineau, C. Cagran, D. Doytier, V. Eyraud, M.-H. Nadal, B. Wilthan and G. Pottlacher: Int. J. Thermophys. 27 (2006) 507–529. doi:10.1007/PL00021868
- 25) M. Liukkonen, M. Friman, M. Hämäläinen and L. Holappa: “Compilation and critical examination of surface energy values of solid alloys and inorganic compounds”, Helsinki University of Technology, Espoo, (2007).
- 26) B. Zhai, K. Zhou and H.P. Wang: Appl. Phys. A: Mater. Sci. Process. 126 (2020) 16. doi:10.1007/s00339-019-3184-6
- 27) C.V. Thompson and F. Spaepen: Acta Metall. 31 (1983) 2021–2027. doi:10.1016/0001-6160(83)90019-6
- 28) Y. Sun, M. Aindow and R.J. Hebert: Addit. Manuf. 21 (2018) 544–555. doi:10.1016/j.addma.2018.02.011
- 29) S. Liu and Y.C. Shin: Mater. Design 164 (2019) 107552. doi:10.1016/j.matdes.2018.107552