Mechanics of Materials
Effect of Microstructure on Shear Deformation in (α + γ) Duplex Stainless Steel
2023 年 64 巻 1 号 p. 227-232
詳細
2023 年 64 巻 1 号 p. 227-232
Duplex stainless steel has excellent strength and corrosion resistance, and it is widely used such, for example, in plant applications. The microduplex structure affects not only the physical properties but also the deformation behavior. The fracture considered to be caused by the peeling duplex interface has been confirmed in various experiments and parts manufacturing factories, but there are few detailed references to the morphology of the microduplex structure. In this study, we examined the relationship between the morphology of the microduplex structure and the deformation behavior by the shearing test with load, horizontal or vertical to the stretching direction of the austenite phase. The latter load divided the duplex interface and delayed the fracture. The results showed that the microduplex structure acts as resistance to the load orthogonal to itself.
This Paper was Originally Published in Japanese in J. JSTP 63 (2022) 9–14.
Duplex stainless steel is a high-strength stainless steel with a mixed microstructure of a ferrite (α) phase and an austenite (γ) phase. There have been various verifications and discussions on the material properties of duplex stainless steels, using uniaxial tensile tests. It has been reported that tensile properties are affected by the grain size and volume fraction of the hard phase, and by the strength ratio of the soft phase to the hard phase.1,2)
The ductile fracture behavior of metals that have a second phase has been actively studied. It has been theorized that voids formed in the interface between the two phases grow, merge, and cause fractures.3–12) The second phase of duplex stainless steels (the γ phase) is longitudinal in the roll direction. It has been reported that, in a hydraulic bulge test, voids generated at the duplex interface developed in the longitudinal direction of the γ phase and formed a directional fracture surface.13)
From the above, it is evident that the deformation and fracture phenomena of duplex stainless steels are affected by the morphology of the microduplex structure. The combination of the longitudinal direction of the γ phase and the load direction is considered to be critical to deformation and fracture, but few reports mention the relationship between the morphology of the microduplex structure and deformation. The fracture phenomena typical of duplex stainless steels, which occur during stretch-expand forming and bending, are a cause of poor formability. Analysis based on the morphology of the microduplex structure is essential, if formability is to be improved.
The authors focused on shear deformation in this study. The uniaxial tensile tests in previous studies considered only uniaxial deformation of the matrix phase and the second phase, and primarily observed the phase interface delamination and void formation caused by the strength difference between the phases. There was little reference to the morphology of the microduplex structure. Furthermore, plastic instability causes necking, which makes it difficult to measure in a stable manner the deformation and cracking behavior caused by the two-phase microstructure. When shear deformation is applied to duplex stainless steels, the load is applied in either the horizontal or vertical direction to the longitudinal direction of the island-like structure of the γ phase. Since the former is a deformation along the two-phase interface and the latter a deformation in the direction that causes the two-phase interface to break up, the status of the two-phase interface when deformation occurs (i.e., the effect of the deformation on the morphology of the microduplex structure) can be sufficiently well established. Further, since shear deformation is less likely to cause necking than uniaxial tension, the deformation behavior can be measured in a stable manner. Therefore, it is considered that analysis of deformation and fracture behaviors, focusing on the morphology of the microduplex structure, is possible by shear deformation.
In this report, the effect of shear deformation behavior on the two-phase microstructure was investigated by conducting shearing tests in the horizontal or vertical direction relative to the longitudinal direction of the island-like γ phase.
The duplex stainless steel SUS329J1 with the composition shown in Table 1 was used as the specimen. The thickness of the plate is 1.0 mm, and each phase is almost equal in volume.

Figure 1 shows the microstructure of the surface of the specimen in the transverse direction (TD) against the roll direction (RD). The darker part is the α phase and the lighter part is the γ phase. In this particular steel, the matrix phase is the α phase, and the γ phase forms an island-like structure in the matrix phase, with its longitudinal direction in the RD, to form a layered structure together with the α phase.

Microstructure of SUS329J1 on TD plane.
The curve of true stress against true strain obtained from the uniaxial tensile test is shown in Fig. 2. Compared to the RD, the TD showed higher proof stress and lower ductility.

Diagram of true stress–true strain curve.
The symmetrical specimen shown in Fig. 3 was used for the shearing test. This specimen geometry is common in shearing tests that use a tensile testing machine.14)
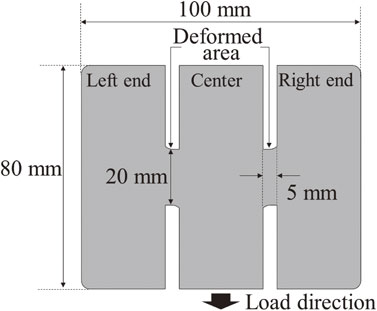
Specimen shape.
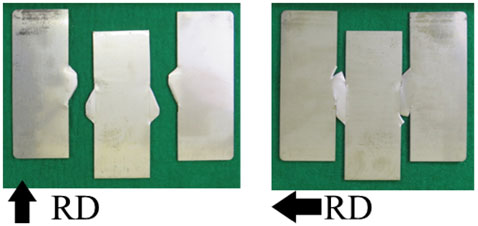
The shearing test jig shown in Fig. 4 was mounted on a universal testing machine (Zwick Roell, Z250SN). The specimen was fixed at the center and at both ends by the jig. The central part is connected to the movable crosshead, and shear deformation can be applied to the deformed area between the ends and the center by moving the crosshead. As the shear angle θ increases, the width of the deformation region tends to decrease in the horizontal direction, but in this test, since the horizontal distance is constrained to be constant, tensile deformation occurs in the width direction. Figure 5 shows the correspondence between the specimen direction and the load direction. The test specimens were prepared so that the movement direction of the crosshead and the RD were horizontal or vertical. As can be seen by comparing Fig. 1 and Fig. 5, the shearing test on the RD specimen applies a force along the island-like γ phase, while in the TD specimen the load is applied in the direction that will divide the phases. By comparing these results, it was considered possible to investigate the effect of the two-phase microstructure on deformation. Hereinafter, the former is referred to as “RD shear” and the latter as “TD shear”. The crosshead speed was set to 0.52 mm min−1 for both shearing tests. Markings were made on the specimen surface and the changes to the markings were monitored by a camera during the test. From those changes, the angular change θ was determined by an image correlation method, and the engineering shear strain εshear was calculated by eq. (1).
| \begin{equation} \varepsilon_{\text{shear}} = \tan\theta \end{equation} | (1) |

Diagrams of shearing test configuration.

Relationship between roll direction and shear deformation.
The fracture surfaces of the specimens were observed using a scanning electron microscope (JEOL JSM-6490A) at an acceleration voltage of 15 kV. The appearance of the fracture surfaces was observed with a microscope (Keyence VHX-5000).
2.4 Microstructure observation of shearing test specimenThe deformed areas of the specimens with shear strains of 0.2 and 0.5, and the fractured specimens, were subjected to microstructural observation using an optical microscope (Nikon OPTIPHOTO) and to electron backscatter diffraction (EBSD) measurement using a field emission scanning electron microscope (JEOL JSM-7200F). Specimens for microstructure observation were prepared by cutting out the deformed area, coating it with resin, and polishing to a mirror finish so that the surface in the thickness direction (ND) of the plate could be observed. After the specimens were etched, microstructural observation was conducted. Samples for EBSD measurements were prepared by cutting out the deformed area and polishing the ND surface as the measurement surface. EBSD measurements were performed on the center of the deformed area at an acceleration voltage of 15 kV, an irradiation current of 10−8 A, a magnification of 10,000×, and a step size of 0.03 µm.
Figure 6 shows the σshear–εshear curves obtained from RD and TD shearing tests. Since this specimen has two shear deformation areas, the shear stress σshear was calculated by dividing the shear load by the cross-section of the two areas. Up to the peak load, the σshear–εshear relationship was comparable in both directions. In the TD shear, although the region up to the peak load was slightly wider, no clear difference was observed in TD shear and RD shear.

Diagram of σshear–εshear curve.
Figure 7 is a photograph of the specimen appearance after RD shear destruction. The specimens were fractured from the top center of the deformed area to the bottom of both ends, in a direction of about 70°. The TD shear specimen shown in Fig. 8 fractured not at the end of the shear plane but at the center of the top and bottom edges of the deformed area and at the base of the edge-like fissures. A photograph of the fracture surface of the RD shear specimen is shown in Fig. 9. From Fig. 7 and Fig. 9 it can be seen that not only a fracture surface but also deformation similar to the drop and shear surface are generated. This is in agreement with the morphology of the fracture surface in general shear deformation observed in punching, etc.
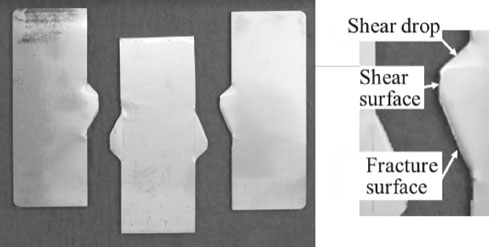
Specimen configuration after RD shearing test.

Specimen configuration after TD shearing test.
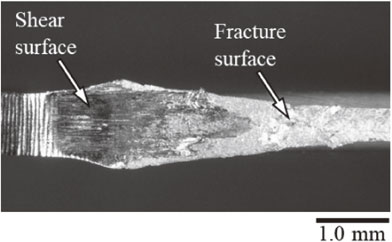
Photo of fracture surface on RD specimen.
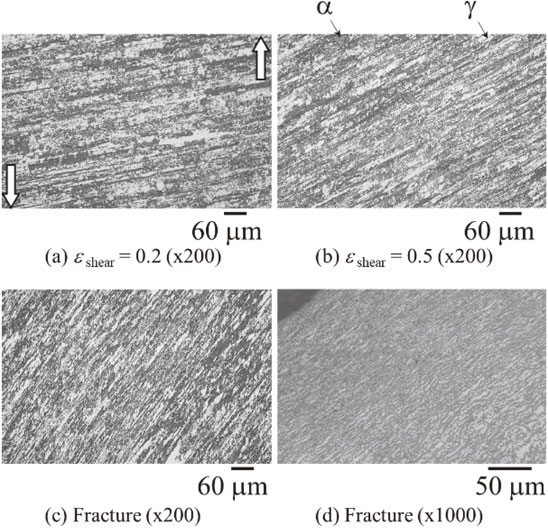
Figure 10 shows the changes in microstructure with increasing strain in RD shearing tests. The observation point was set at the center of the deformed area. The white arrows indicate the shear direction. In RD shearing tests, no significant changes in microstructural morphology were observed when the shear strain increased from 0.2 to 0.5. At fracture, the island-like γ phase was tilted at a distance of about 350 µm from the fracture surface. A structural flow in the direction of the maximum principal strain was observed, at a range of about 50 µm from the fracture surface, and the microstructure became finer at a range of 10 µm or less, very near the fracture surface.

Microstructure of RD specimen. (a), (b) Center of the deformed area. (c), (d) Near the fracture surface.
Figure 11 shows the change in microstructure with increasing strain in the TD shearing test. The island-like γ phase was tilted along the direction of maximum principal strain, and the tilting became more significant as the shear strain increased. The tilt of the γ phase was at a maximum at the time of fracture, but in TD shear it fractured not at the center of the deformed area but at the upper and lower ends of the deformed area, as shown in Fig. 8.
Microstructure of TD specimen. (a), (b), (c) Center of the deformed area. (d) Near the fracture surface.
The relationship between the morphology of the microduplex structure of the duplex stainless steel and the shear deformation mentioned in Chapter 3 is discussed in this chapter.
4.1 Shear direction dependence up to peak loadThe RD and TD shearing tests apply loads in the horizontal and vertical directions relative to the longitudinal direction of the island-like γ phase, respectively. Figure 10 and Fig. 11 show that the microstructure after deformation reflects the morphology of the initial microstructure, especially in TD shearing, where the deformation is accompanied by γ-phase tilting. The effect of the microstructure on shear deformation was investigated by observing the deformed microstructure with EBSD.
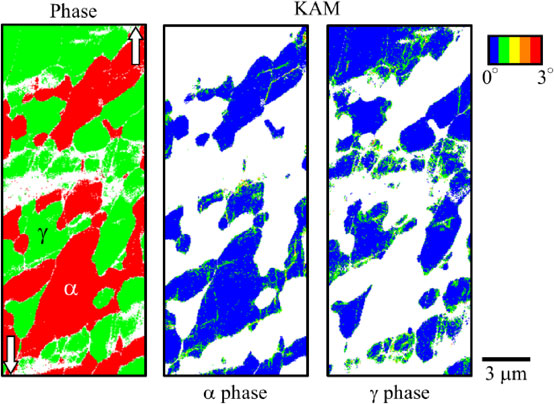
Phase maps and kernel average misorientation (KAM) maps of the center of the deformed specimen at a shear strain of 0.5, measured by EBSD, are shown in Fig. 12 and Fig. 13. The white arrows indicate the shear direction. The α phase is in red and the γ phase in green. The white region is where crystallinity is significantly reduced or fragmented due to deformation. A high KAM value means high strain.

Phase and KAM maps of RD specimen at center of deformed area, eshear = 0.5.
Phase and KAM maps of TD specimen at center of deformed area, eshear = 0.5.
The area ratio to the KAM value is shown in Fig. 14. Regardless of the direction, the area fraction of KAM values from 0° to 0.6° is higher in the α phase than in the γ phase, and the area fractions of KAM values from 0.6° to 1.2° and from 1.2° to 1.8° are higher in the γ phase than in the α phase. Therefore, it can be said that strain is concentrated in the γ phase in this shearing test, and the γ phase is considered to be easier to deform than the α phase. The KAM values of 1.8° to 3.0° are omitted because the area ratio is less than 1% and the values are similar for each phase, regardless of the direction. The white region in the phase map is considered to be undetected, due to a significant decrease in crystallinity caused by deformation. In the shearing tests, no process-induced transformation was observed in the γ phase.

KAM value distribution.
In the case of shear deformation in this study, the γ phase deforms more easily than the α phase, and the deformation of the α phase around the γ phase dictates the macroscopic shear deformation. Therefore, it is considered that the hard phase acted as a primary resistance to deformation; that is why the σshear–εshear curve was not affected by the direction. On the other hand, in the tensile test, the TD showed a higher proof stress than the RD. This is considered to be because the shrinkage of the width due to the tensile force on the TD did not occur easily. Although the γ phase is softer than the α phase, it is considered to have acted as a resistance to deformation, because in the tensile test on the transverse direction, the γ phase longitudinal direction corresponds to width direction in the tensile test piece, and the width contraction associated with the tension corresponds to compression in the γ phase longitudinal direction. In the tensile test on the rolling direction, the longitudinal direction of the γ phase corresponds to the tensile test piece longitudinal direction. Thus, it did not act as a resistance to the width contraction associated with the tension, which is considered to have caused the difference in the proof stress.
4.2 Dependence of fracture behavior on shear directionAlthough no clear difference is observed between RD shear and TD shear in the σshear–εshear curve, there are differences in the fracture positions and morphology between them. This suggests that the microstructure has an effect on the fracture phenomenon.
Figure 15 indicates the deformation behavior in the RD shearing test up to fracture. The contour is the amount of angular change associated with shear deformation and corresponds to the magnitude of the shear strain. In the RD shearing test, the shear strain was concentrated at the top center base of the deformed section, toward the bottom base of the fixed side. After the shear plane was formed, cracks were generated from above and below the deformed area, along the diagonal where the shear strain was high. The cracks merged in the center, and fracture resulted. From Fig. 7 and Fig. 15, it can be said that the deformation mode of this test is similar to that of shear punching. It is assumed that the fracture proceeds with the same mechanism as in commonly observed shear fracture.15)
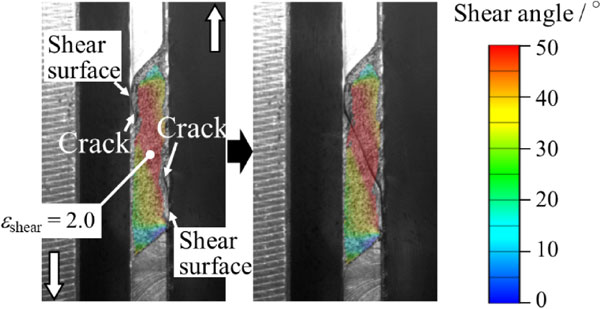
Shear deformation of RD specimen.
Figure 16 shows the deformation behavior in the TD shearing test up to fracture. In TD shear, strain concentration occurred at the same location as in RD shear, and shear planes were formed at the upper and lower edges of the deformed area. The lower edge then cracked in the width direction. Based on the deformation pattern, cracks similar to those in the RD shearing test were expected to occur, but no cracks were observed in the TD. It has been reported that crack propagation in duplex stainless steels tends to occur at the duplex interface.11,12) Applying this to the present shearing test, it can be assumed that the γ phase served as a barrier because the layered γ phase was orthogonal to the crack propagation direction. In Fig. 6 the strain at the peak load was slightly higher for the TD, suggesting that the crack growth suppression delayed the fracture and caused the deformation in the width direction to progress. This resulted in fracture at the upper and lower ends of the deformed area.

Shear deformation of TD specimen.
Table 2 shows the thickness reduction rate of the fractured section. The rate is higher in TD shear than in RD shear, which indicates the difference in fracture modes. In RD shear, cracks originating from the top and bottom of the deformed area propagated, merged in the center, and caused the fracture. Since the thickness reduction and the crack growth occurred at the same time, it is considered that the specimen fractured with a small thickness reduction. In the case of TD shear, it is estimated that the fracture was delayed by the suppression of crack propagation. As shear deformation progressed, the thickness reduction was considered to have accelerated because tensile force was applied to the upper and lower edges of the deformed part in the width direction.

SEM images of the fracture surface of the RD shearing test are shown in Fig. 17. The fracture surface shows a mixture of small dimples and elliptical apertures, with the apertures elongated in the shear direction. Since voids tend to elongate in the direction of principal strain and along the duplex interface in the case of duplex stainless steels, it was assumed that voids would elongate in the vertical direction in the deformed area in the RD shearing test. Fracture occurs when the voids merge in the width direction, and since the fracture occurred at an angle of about 70° in this case, the growing voids were severed diagonally, and thus appeared as ellipses on the fracture surface.

Fracture surface of RD specimen.
The fracture surface of the TD specimen is shown in Fig. 18. It is a mixture of small dimples and circular openings. From the fracture morphology, the direction of void elongation is considered to be normal to the fracture surface. The microstructure at the top and bottom of the deformed area indicates that the γ phase is tilted by the shear deformation, and it can be said that the fracture surface of the TD was formed by the tension in the horizontal direction to divide the γ phase. These results suggest that the elongated voids were vertically severed to form circular openings.

Fracture surface of TD specimen.
The following conclusions on the effect of microstructure on shear deformation of duplex stainless steels were obtained by comparing the results of the RD and TD shearing tests.
The Chugoku-Shikoku Branch of the Japan Society for Technology of Plasticity provided financial support for the publication of J. Jpn. Soc. Technol. Plast. as a supplementary prize of the Distinguished Contribution Award for Young Scientists.