Abstract
A machine learning method was developed, which predicts ionic conductivity based on chemical composition alone, aiming to develop an efficient method to search for lithium conductive oxides. Under the obtained guideline, the material search was focused on the Li2O–SiO2–MoO3 pseudo-ternary phase diagram, which is predicted to have high ionic conductivity (>10−4 S·cm−1). We investigated the formation range, ionic conductivity, and crystal structure of the lithium superionic conductor (LISICON) solid solution on the Li4SiO4–Li2MoO4 tie line. The ionic conductivity of the LISICON phases is about 10−7 S·cm−1, which is higher than that of the end members; however, two orders of magnitude lower than that of the analogous LISICON materials. In addition, the experimental values were two or three orders of magnitude lower than the predicted conductivity values by machine learning. However, the developed prediction model can be used as an initial guideline for material exploration since the predicted values follow the trend of practical conductivity in the phase diagram. The crystal structure analysis indicated that the distance between the lithium sites and the occupancy of each lithium site in the crystal structure contributed to the decrease in ionic conductivity. This strong correlation between crystal structure and ionic conductivity was one of the reasons for the discrepancy between the predicted ionic conductivity based on chemical composition alone and the experimental value.
This Paper was Originally Published in Japanese in Japan Soc. Powder Powder Metallurgy 69 (2022) 108–116.
1. Introduction
All-solid-state lithium batteries are promising next-generation batteries having superior output characteristics and safety than conventional lithium-ion batteries. All-solid-state batteries use a solid material as an electrolyte, and this is advantageous in comparison to the use of organic-solvent-based electrolytes because solid electrolytes are nonflammable and only allow the diffusion of lithium ions.
These solid-state lithium-ion conductors, which can be used as solid electrolytes, can be classified into sulfide-based materials and oxide-based materials. Li10GeP2S12, a sulfide-based material, has a high ionic conductivity of 1.2 · 10−2 S cm−1 at room temperature and shows battery characteristics that are equivalent to those of liquid electrolytes.1) The systematic search for materials using the substitution of cations and anions in Li10GeP2S12-type materials has led to Li9.54Si1.74P1.44S11.7Cl0.3, which has high ionic conductivity (2.5 · 10−2 S cm−1), and all-solid-state batteries containing this material exhibit superior charging/discharging characteristics between −30 and 100°C and output characteristics more than three times greater than those of liquid-based lithium batteries.2) However, it is challenging to handle sulfide-based materials in the ambient atmosphere. In contrast, oxide-based materials have superior stability in the ambient atmosphere; however, their conductivities are one-to-two orders of magnitude lower than those of sulfide-based materials.
Therefore, to increase the efficiency of the search for oxide-based lithium-ion conductors, material search methods that incorporate machine learning methods have been developed.3) A material recommender system4,5) that predicts the existence of unreported chemical compositions without specifying the crystal structure was applied as an effective search method to discover new materials having unknown crystal structures. Multiple new materials have been found in searches based on the material recommender system, and the efficiency of searching for new materials has been improved. Nevertheless, the ionic conductivities of the identified materials remain low (<10−5 S cm−1). Therefore, this method has not led to the discovery of practical new materials. Thus, an additional guideline, which can predict the ionic conductivity for any chemical composition is required. This kind of new guideline could be used in combination with the recommender system to predict new compositions having high ionic conductivity, resulting in the discovery of highly conducting solid electrolyte materials.
Therefore, in this study, we developed a machine learning model that predicts the ionic conductivity of a material from its chemical composition alone and applied it to identify lithium-ion conductors having high ionic conductivity. As shown in Fig. 1, this prediction model predicted a relatively high ionic conductivity (>10−4 S cm−1) for pseudo-ternary phases of Li2O–SiO2–MoO3. In the process of investigating the known materials in the phase diagram, it became clear that a material with lithium superionic conductor (LISICON) structure was reported on the Li4SiO4–Li2MoO4 tie line (Li4−2xMoxSi1−xO4; x = 0.25).6,7)

Ionic conductivity of 6.3 · 10−7 S cm−1 for the Li3.5Mo0.25Si0.75O4 was reported while it has not been registered in any inorganic crystal structure database and has not been included in the training datasets for machine-learning-based ionic conductivity prediction. Further, the crystal structures and solid solution range of this material have not been reported. For the reported composition, the Mo6+ content is low; hence, the effect of introducing aliovalent cations is not enough.6) Therefore, there is the possibility to improve its ionic conductivity by further Mo6+ doping. However, continuous studies with various x values in Li4−2xMoxSi1−xO4 have not been reported. The following background may explain this situation. It is expected that increasing the Mo6+ content could improve the electronic conductivity, because, typically, the co-doping of transition metals, such as Mo, with alkali metals, produces a mixed valence state (for example, Mo6+/Mo5+).8) However, high electronic conductivity is unfavorable for solid electrolytes because it leads to internal short circuits of batteries. Therefore, materials using these elements have been thought to be unsuitable for solid electrolytes, although this is an unexplored area.
Therefore, in this study, we focused on the Li4SiO4–Li2MoO4 tie line in the ternary phase diagram, which was predicted to have high ionic conductivity. Along with the chemical formula of Li4−2xMoxSi1−xO4, the relationship between the obtained phases and ionic conductivity was investigated. The crystal structure of the obtained phase was analyzed by the Rietveld refinement using powder neutron diffraction data. The electronic conductivity of the LISICON phase was also evaluated.
2. Experimental Methods
Collected information of chemical compositions and ionic conductivities of 256 lithium-based solid electrolyte materials from previous reports were used as a machine learning dataset to predict the ionic conductivity. Regression-based learning was carried out using the features obtained from the chemical composition,9) where the objective variable was the ionic conductivity at room temperature (approximately 300 K). Forty-one physical properties and intrinsic values (e.g., ionic radius,10) electronegativity,11,12) polarizability13)), which can be derived from the chemical composition of each material, were used to generate the feature descriptors. Finally, 820 features were obtained by a conversion process (i.e., the mean, variance, standard deviation, etc.) using each chemical composition. All the input data were obtained from the references.10–18) Table 1 shows the information related to the elements used in this study. The ‘Random Forest’ machine learning algorithm, which is widely used in materials informatics related to inorganic materials,5,19–23) was selected. Because ‘Random Forest’ can also calculate the importance of features, this enables the judgment of the reliability of prediction results not only from the value of the error function but also from the perspective of synthetic chemistry; the function as implemented in ‘scikit-learn’24,25) was used. The 256 datasets were randomly divided into training data and test data, for which 178 were used as training data and 78 as test data. The prediction model was constructed using the training data, and the ionic conductivity of the test data was predicted using the constructed model to evaluate the generalization performance.
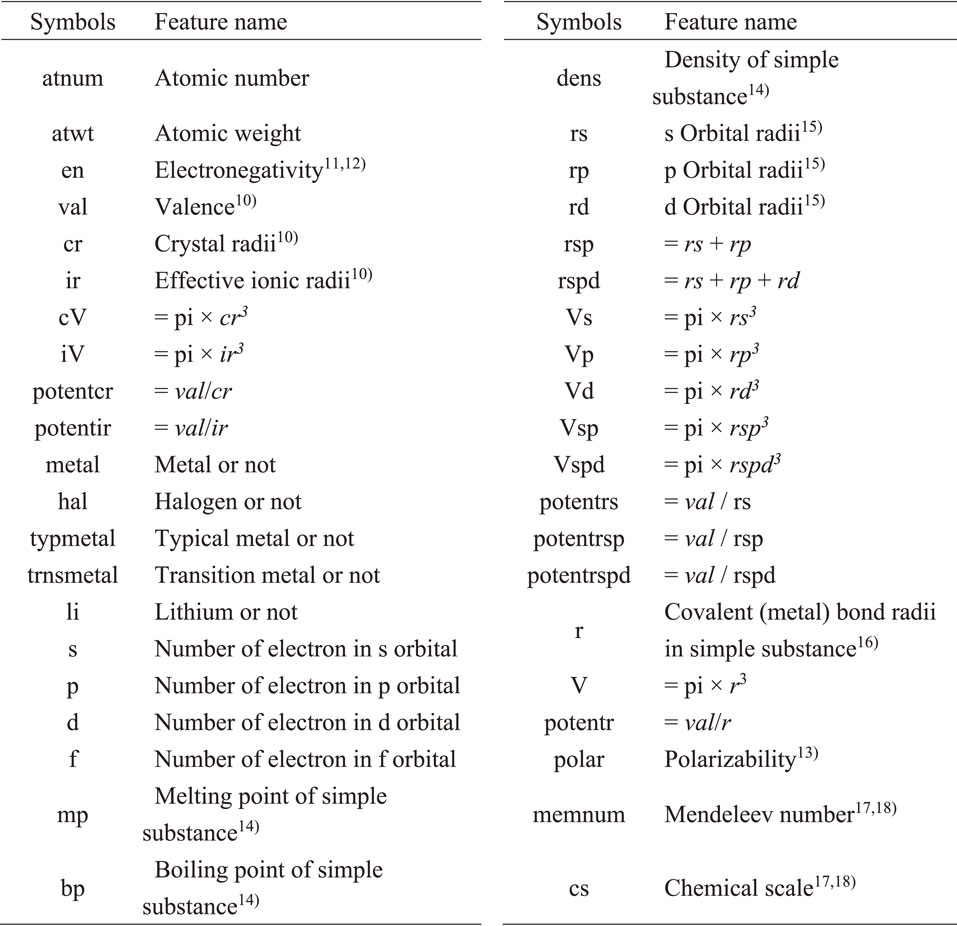
Table 1 List of information related to the elements used to generate the features with their symbols.
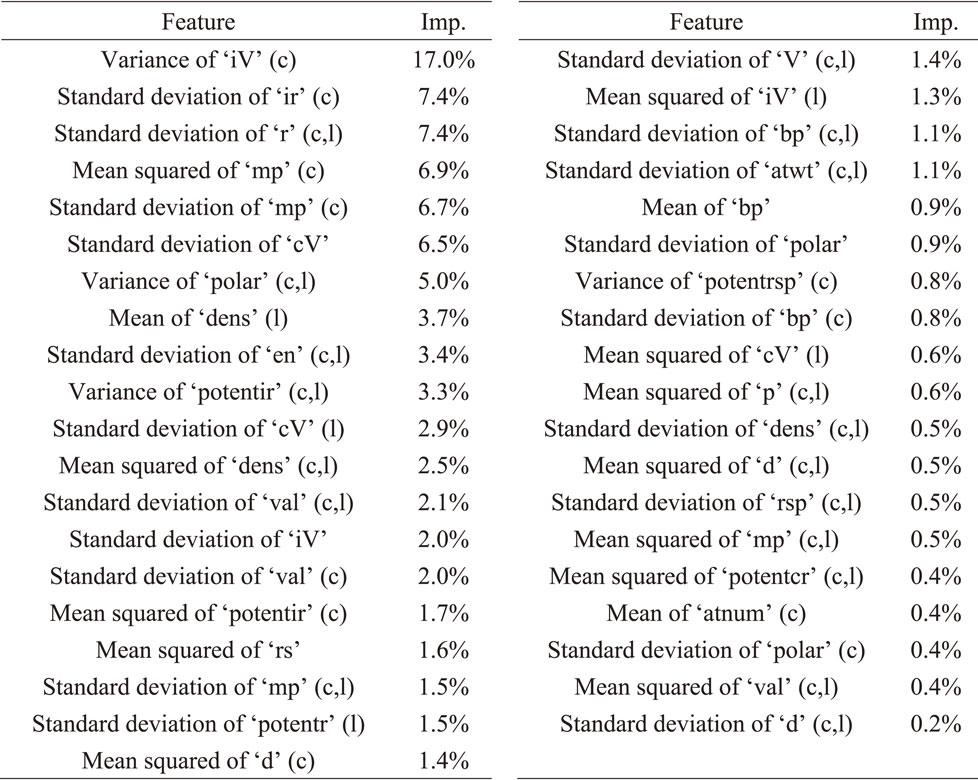
In the learning process using training data, the hyperparameters were tuned using black-box optimization26) and five-fold cross-validation. Furthermore, because there were numerous features in the dataset, they were reduced using the ‘Filter’ method27) based on the correlation coefficient between the features. Additionally, the ‘Wrapper’ method27) (Boruta28)) was used to reduce the features based on their importance in the ‘Random Forest’ algorithm. Ultimately, 39 features were used, as listed in Table 2, along with their importance values, as calculated by ‘Random Forest’, during the model learning stage.
The Li4−2xMoxSi1−xO4 samples were synthesized using a solid-state method. The starting materials, which were Li2O (≥99%, Kojundo Chemical Laboratory), SiO2 (99.9%, Kojundo Chemical Laboratory), and MoO3 (>99.5%, Kanto Chemical Co.), were weighed according to the stoichiometric ratio. The raw materials were placed in the zirconia pot of a planetary ball mill device (Fritsch Japan Co., Ltd., PL-7 Premium Line) together with ten 10-mm-diameter zirconia balls and twenty 5-mm-diameter zirconia balls and pulverized and mixed at 380 rpm for 8 h. After the milling process, the obtained powder was pressed at approximately 700 MPa to yield pellets having diameters and thicknesses of 10 mm and 1–3 mm, respectively. The pellets were sintered in the ambient atmosphere at 850°C for 12 h. The sintered samples were crushed in a zirconia mortar, and pellets were prepared at a pressure of approximately 700 MPa. The pellets had thicknesses of 0.8–1.2 mm and were subsequently calcined under the same conditions to obtain the final samples.
Phase identification of the samples was performed by powder X-ray diffraction measurements (Rigaku, SmartLab). The diffraction data was collected using Cu–Kα1 radiation with a scanning range of 10° ≤ 2θ ≤ 60° in steps of 0.03°.
The ionic conductivity was evaluated using the alternating current (AC) impedance method using a frequency response analyzer (VSP-300, Bio-Logic). The applied voltage was 400 mV, and the frequency range was 1 × 10⁻¹ to 7 × 10⁶ Hz. All measurements were performed in an Ar atmosphere. In case the sample was a sintered body, gold paste (99.5%, Au-176010, Nilaco; resistivity <1 · 10−4 Ω cm) was first applied to both sides and then heated for 5 min in an electric furnace at 300°C to form electrodes. For evaluating the cold-pressed samples, gold powder (manufactured by AS ONE, TA-02) was crimped on both sides of the pellets to form a gold electrode. The measured samples have thicknesses of approximately 1 mm and diameter of 6 mm. The conductivities of the samples were calculated by analyzing the data obtained by AC impedance measurements by fitting to an equivalent circuit in ZView (Scribner Associates, Inc.).29)
The electronic conductivity was evaluated using the DC method. An arbitrary voltage was applied to a cell having the same configuration as that used for the AC impedance measurements, and the response current was recorded. The measurements were recorded at 25, 50, and 100°C, and the applied voltages were from 0.1 to 1 V in steps of 0.1 V.
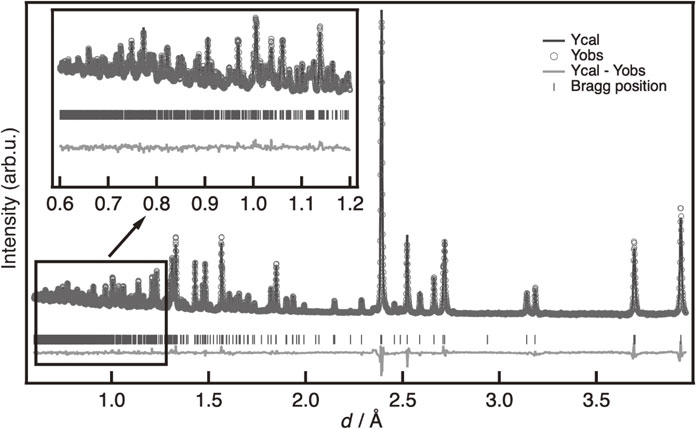
Crystal structure analysis was conducted using the Rietveld method on powder neutron diffraction data.30) For the measurements, approximately 1.0 g of the sample was enclosed in a vanadium tube (6.0-mm diameter) under an Ar atmosphere. Then, neutron diffraction measurements at room temperature (approximately 300 K) were conducted with a time-of-flight (TOF)-type special environment powder diffractometer (BL09, SPICA) at the Japan Proton Accelerator Research Complex (J-PARC).31) The back bank data having high d-resolution were used for crystal structure analysis, and the optimization of structural parameters by the Rietveld method was performed using Z-Rietveld.32,33)
3. Results and Discussion
Figure 2(a) shows a plot of the ionic conductivities predicted by the ‘Random Forest’ algorithm compared to actual data, and Fig. 2(b) shows the aggregated results of the importance of the features shown in Table 2 for each physical and intrinsic property. The plots of training and test data in Fig. 2(a) are aligned on the diagonal line, indicating that the developed prediction model has a relatively good accuracy. In contrast, the root mean squared errors (RMSEs) for the training and test data were RMSEtrain = 1.064 and RMSEtest = 1.648, respectively. In other words, the predictive accuracy of the test data was slightly inferior to that of the training data. However, the results in Fig. 2(a) suggest that the region with lower accuracy is that corresponding to low ionic conductivity (<10−15 S cm−1). The effective ion volume and polarizability showed high contribution rates in the analysis of the importance distribution of the features shown in Fig. 2(b). The control of bottleneck size and lattice size, as well as the introduction of elements with high polarizability, are thought to be key general design guidelines for ionic conductors. These results imply that the developed prediction system could make meaningful predictions based on solid-state chemistry principles especially for highly conductive compositions (>10−15 S cm−1).34) Therefore, as shown in Fig. 1, a material search was conducted in the Li2O–SiO2–MoO3 system pseudo-ternary phase diagram for which high ionic conductivity had been predicted.

Figure 3 shows the X-ray diffraction patterns of Li4−2xMoxSi1−xO4. At x = 0.15, where the Mo content is low, a multiphase including a LISICON-type and Li4SiO4-type was obtained. Furthermore, at larger x values, a LISICON-type single phase was obtained between x = 0.3 and 0.4, and a multiphase including LISICON-type and Li2MoO4-type was obtained between x = 0.5 and 0.8. The peak position of the LISICON phase shifted to the low-angle side as x increased; hence, the lattice expansion by Mo doping was indicated. This implies the formation of a lattice-expanded solid solution in which Si4+ (0.26 Å, coordination number 4) with a small ionic radius is substituted by larger Mo6+ (0.41 Å, coordination number 4).10) The XRD data and previous report6) revealed that the solid solution formation region of the LISICON phase is approximately from 0.2 to 0.45 in x. This solid solution region is narrower than that of most LISICON materials, probably because of the relatively large difference in ionic radius between the framework cations.35–37)
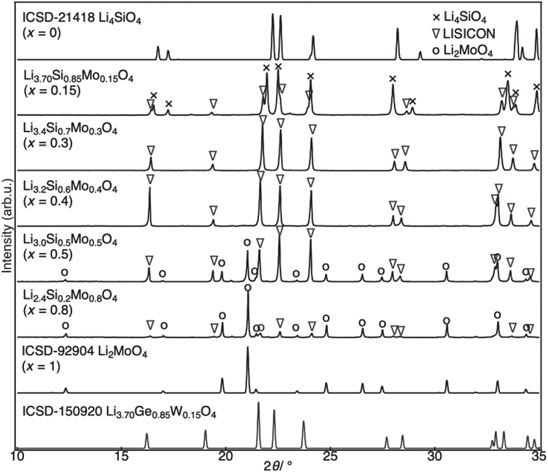
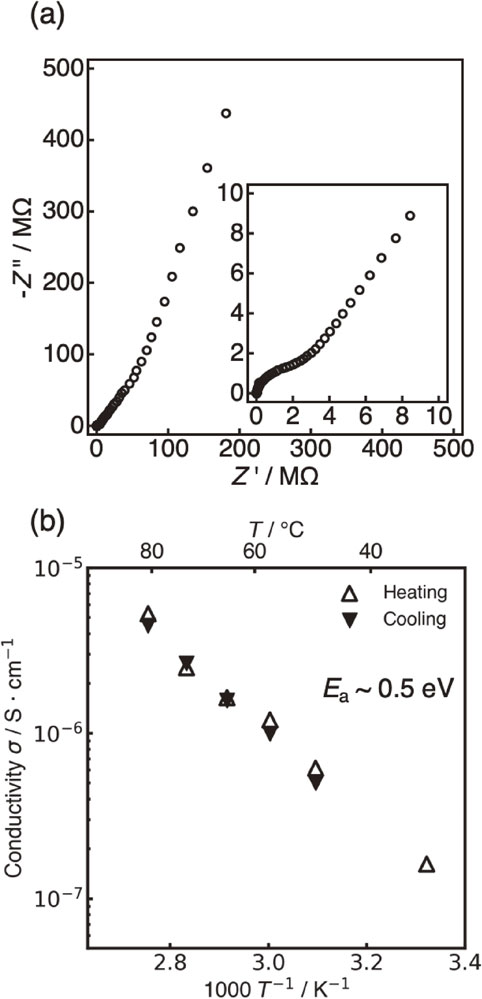
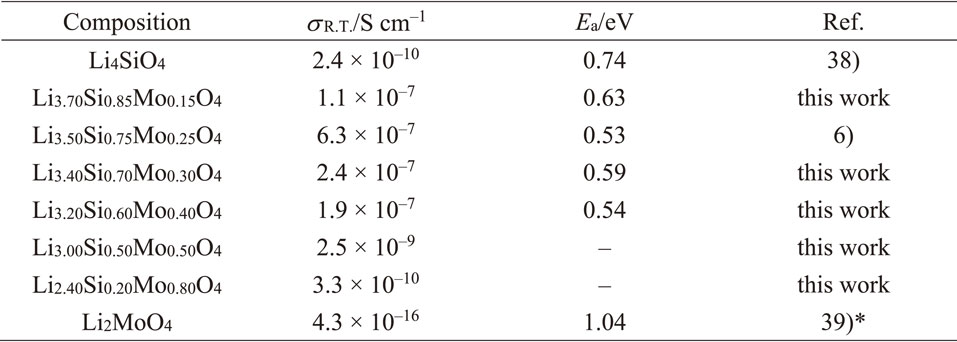
Figure 4 shows the Nyquist plot of the x = 0.4 sample and the Arrhenius plot obtained from the temperature dependence of the ionic conductivity. The Nyquist plot contains a semicircle in the high-frequency region, and it was fitted with an RC parallel circuit to calculate the ionic conductivity. Because the capacitance value was approximately 10−11 F, it was expected that the conductivity value included both bulk and grain boundary contributions. The activation energy was also calculated from the slope of the Arrhenius plot. Samples having other compositions were also analyzed in the same way to determine the ionic conductivity and activation energy. However, it was difficult to measure the conductivity of the x = 0.5 and 0.8 samples prepared as sintered pellet; therefore, the cold-pressed pellets were evaluated for those compositions. Figure 5 summarizes the ion conducting properties along with the results of phase identification. Table 3 shows a summary of the specific conductivity and activation energy values. Some previously reported results are also included.6,38,39) The introduction of Mo into the Li4SiO4 increased the extremely low ion conductivity of Li4SiO4 (x = 0, 2.4 × 10⁻¹⁰ S cm−1) by approximately three orders of magnitude while decreasing the activation energy for lithium-ion conduction. In addition, the Mo introduction contributed to the LISICON phase formation. The ionic conductivity was particularly high in the LISICON single-phase region and showed the highest value of the synthesized samples (2.6 · 10−7 S cm−1) at x = 0.3. Furthermore, the conductivity decreased for compositions with a high Mo content, i.e., x > 0.4. Therefore, the Li4−2xMoxSi1−xO4 system exhibited high ionic conductivity in the region where the LISICON single phase was formed. The machine learning prediction could imply this experimentally confirmed conductivity trend since the intermediate region on the Li4SiO4–Li2MoO4 tie line exhibit relatively high ionic conductivity compared to the compositions around the end members in Fig. 1. Therefore, the developed prediction model can be used as an initial guideline for material exploration within the phase diagram. However, the experimentally obtained ionic conductivity did not achieve the predicted values by machine learning (>10−4 S cm−1) over all compositions. These results suggest that there is room for improvement in the predictive accuracy and reliability of the machine learning model developed in this study.
Concerning trends within the solid-solution range of the LISICON phase, a larger x (i.e., higher Mo content) was found to result in lower conductivity. For Li4−2xMoxSi1−xO4, a larger x value also resulted in a larger lattice size (i.e., larger bottleneck size) together with a smaller amount of lithium (i.e., carrier number). Therefore, this trend indicates that a decrease in the amount of lithium could have a dominant effect on the x > 0.25 composition, which results in a lowering of the ionic conductivity.
The electronic conductivity of the x = 0.3 composition was evaluated by the DC polarization method. The terminal current values are plotted as a function of the applied voltages in Fig. 6. The electronic conductivity calculated from the slope of the linear region in the plots is 1.2 · 10−8 S cm−1 at 100°C. In addition, the AC impedance of the same sample was measured again at 100°C, yielding a conductivity of 1.9 · 10−5 S cm−1. Therefore, the contribution of the electronic conductivity to the conductivity as measured using AC impedance was small enough (<0.1%), indicating that this was a pure ionic conductor that is suitable for use as a solid electrolyte.

The crystal structure of the LISICON phase was investigated by Rietveld analysis using powder neutron diffraction measurement data. Figure 7 and Table 4 show the results obtained for the x = 0.4 composition and the refined structural parameters, respectively. The initial structural model was constructed using the Li3.70Ge0.85W0.15O440) (ICSD-150920), which belongs to the orthorhombic space group Pnma (62). The Ge and W co-existing position (4c site) was substituted by Si and Mo with stoichiometric ratios.
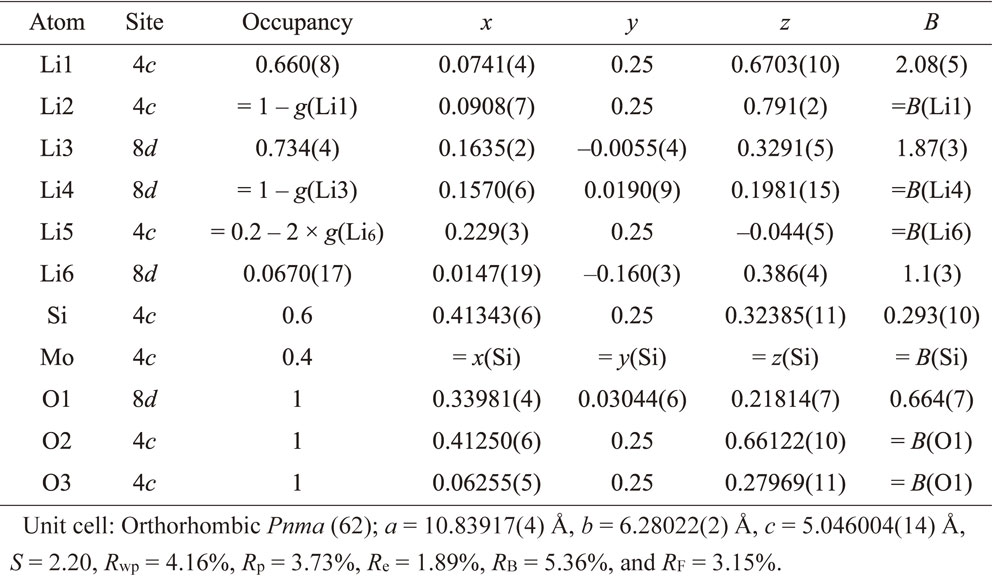
Table 4 Refined structural parameters obtained from Rietveld refinement on neutron powder diffraction data of Li4−2xMoxSi1−xO4 (x = 0.4).
The Li position was determined by differential Fourier synthesis, and the occupancy and position of the six Li positions were refined. The reliability factor (Rwp) and goodness of fit (S), which indicate the reliability of the structural analysis, were 4.16% and 2.20, respectively. Therefore, reasonable analysis results were obtained for the diffraction data. The lattice constants were a = 10.83917(4) Å, b = 6.28022(2) Å, and c = 5.046004(14) Å.
The LISICON phase of Li3.70Ge0.85W0.15O4 has a similar combination of tetravalent (Ge4+) and hexavalent (W6+) cations, an ionic conductivity at room temperature of 5.0 · 10−5 S cm−1, and lattice constants of a = 10.94 Å, b = 6.27 Å, and c = 5.16 Å.40) In comparison, the conductivity of Li4−2xMoxSi1−xO4 (x = 0.4) is 1.9 · 10−7 S cm−1, and this is two orders of magnitude lower. This significant difference in conductivity will be discussed.
The smaller bottleneck size for lithium conduction by the smaller lattice constant could be considered because this structure has smaller framework elements than Ge and W (i.e., Si and Mo). However, the difference in lattice parameters is approximately 2%; hence, the contribution of this effect is thought to be small. The correlation between the ionic conductivity and average ionic radius of the framework elements in the binary LISICON material (Li-M-M′-O) has already been reported.41) However, even considering these relationships, the conductivity is two orders of magnitude lower. Specifically, the average ionic radius of the framework elements of Li4−2xMoxSi1−xO4 (x = 0.4) is 0.32 Å. However the ionic conductivity of Li3.5Si0.5V0.5O4 with the same average ionic radius (0.31 Å) is approximately 1.0 · 10−5 S cm−1. There are also differences in the amount of lithium. The conductivity of Li4−2xMoxSi1−xO4 (x = 0.25), which contains a larger amount of lithium, is 6.3 · 10−7 S cm−1; hence, the effect of the amount of lithium is thought to be similarly small.
In order to consider the origin of the intrinsically low ionic conductivity in this Li4−2xMoxSi1−xO4 LISICON system, the lithium distribution in the structure and the occupancy of each site were analyzed. Figure 8 shows the lithium distribution of the Li4−2xMoxSi1−xO4 (x = 0.4) obtained from the crystal structure analysis. In this figure, a bond is shown when the distance between the adjacent Li sites was less than 2.30 Å. This threshold value (2.30 Å) is reported as the distance between the adjacent lithium sites, which characterize superionic conductors such as garnet-type, sodium superionic conductor (NASICON)-type, and Li10GeP2S12-type.42)

When considering all the lithium positions, both Li4−2xMoxSi1−xO4 (x = 0.4) and Li3.70Ge0.85W0.15O4 have adjacent lithium sites within 2.30 Å. In addition, it can be seen that a three-dimensional lithium network is formed in these structures. Ion diffusion is thought to proceed within the LISICON structure through this continuous channel. Meanwhile, except for the lithium position where the lithium site occupancy is less than 0.2, it can be seen that the three-dimensional lithium network is divided at Li4−2xMoxSi1−xO4 (x = 0.4). This fact indicated that lithium localization occurred in the Li4−2xMoxSi1−xO4 (x = 0.4) structure, and the low occupancy positions (g(Li) < 0.2) existed between the high occupancy positions (g(Li) > 0.2). As a result, the distance between lithium positions with high occupancy is larger than the threshold value (2.30 Å). On the other hand, in Li3.70Ge0.85W0.15O4, a three-dimensional network of lithium positions within 2.30 Å is formed, even if only the high occupancy lithium positions are considered. These structural features could result in large differences in ionic conductivity even in similar LISICON types. Therefore, the Li4−2xMoxSi1−xO4 (x = 0.4) exhibited greatly decreased ionic conductivity compared to related LISICON materials. Furthermore, the trend in decreased conductivity with increase in x in the LISICON-type solid solution region (x = 0.2–0.45) also corresponds to a reduction in the amount of lithium in high occupancy positions and the division of the lithium network. Therefore, the lithium distribution and occupancy in the crystal structure are important factors determining the ionic conductivity in the LISICON phase. These facts may contribute to the deviation from the ionic conductivity prediction results that were obtained from chemical composition data alone.
4. Conclusion
We developed a machine learning method for predicting the ionic conductivity from the chemical composition of lithium-ion-conducting phases. The ‘Random Forest’ algorithm showed good predictive performance for the test data, and the features with high importance reflected some of the general ionic conductor design guidelines. Because a relatively high ionic conductivity was predicted in the pseudo-ternary phase diagram for the Li2O–SiO2–MoO3 system (>10−4 S cm−1), this system was selected as a material search field. Synthesis and evaluation along with the Li4SiO4–Li2MoO4 tie line revealed that the solid solution formation region of the LISICON phase is from x = 0.2 to 0.45 in the Li4−2xMoxSi1−xO4. The solid solution of the LISICON phase showed a relatively high conductivity of 10−7 S cm−1 at room temperature. The contribution of electronic conduction to total conductivity was approximately 1/1000th that of the ionic conductivity, confirming that the material was a pure lithium-ion conductor. Meanwhile, the Li4−2xMoxSi1−xO4 LISICON phase has an ionic conductivity that is approximately two orders of magnitude lower than that of related LISICON materials, suggesting that the lithium position and occupancy in the crystal structure are important factors determining ionic conductivity. In addition, those experimental values were two or three orders of magnitude lower than the conductivity values predicted by the machine learning model. However, the developed model can be used as an initial guideline for material exploration since the predicted values follow the trend of practical conductivity in the phase diagram. Therefore, the prediction model developed in this study still has potential for improvement by increasing the amount of training data and examining various algorithms.
Acknowledgments
The powder neutron diffraction experiments were conducted with the support of the neutron joint use S1-type experimental proposal (2019S10) of the High-Energy Accelerator Research Organization Institute of Materials Structure Science and with the assistance of Dr. Takashi Saito and Dr. Takashi Kamiyama. Part of this research was supported by JST, PRESTO (JPMJPR17N7), and the JSPS Grant-in-Aid for Scientific Research (19H05785).
REFERENCES
- 1) N. Kamaya, K. Homma, Y. Yamakawa, M. Hirayama, R. Kanno, M. Yonemura, T. Kamiyama, Y. Kato, S. Hama, K. Kawamoto and A. Mitsui: Nat. Mater. 10 (2011) 682–686. doi:10.1038/nmat3066
- 2) Y. Kato, S. Hori, T. Saito, K. Suzuki, M. Hirayama, A. Mitsui, M. Yonemura, H. Iba and R. Kanno: Nat. Energy 1 (2016) 16030. doi:10.1038/nenergy.2016.30
- 3) K. Suzuki et al.: J. Mater. Chem. A 8 (2020) 11582–11588. doi:10.1039/D0TA02556A
- 4) A. Seko, H. Hayashi, H. Kashima and I. Tanaka: Phys. Rev. Mater. 2 (2018) 013805. doi:10.1103/PhysRevMaterials.2.013805
- 5) A. Seko, H. Hayashi and I. Tanaka: J. Chem. Phys. 148 (2018) 241719. doi:10.1063/1.5016210
- 6) J. Kuwano, M. Nagamine, M. Higuchi and M. Kato: Denki Kagaku Oyobi Kogyo Butsuri Kagaku 49 (1981) 667–668. doi:10.5796/kogyobutsurikagaku.49.667
- 7) H.Y.P. Hong: Mater. Res. Bull. 13 (1978) 117–124. doi:10.1016/0025-5408(78)90075-2
- 8) A. Stavenhagen and E. Engels: Ber. Dtsch. Chem. Ges. 28 (1895) 2280–2281. doi:10.1002/cber.189502802213
- 9) F. Sakata, M. Kotera, K. Tanaka, H. Nakano, M. Ukita, R. Shirasawa, S. Tomiya and K. Funatsu: J. Comput. Aided Chem. 19 (2018) 7–18. doi:10.2751/jcac.19.7
- 10) R.D. Shannon: Acta Crystallogr. Sect. A 32 (1976) 751–767. doi:10.1107/S0567739476001551
- 11) L. Pauling: J. Am. Chem. Soc. 54 (1932) 3570–3582. doi:10.1021/ja01348a011
- 12) L. Pauling: The Partial Ionic Character of Covalent Bonds and the Relative Electronegativity of Atoms. In: The Nature of the Chemical Bond and the Structure of Molecules and Crystals: An Introduction to Modern Structural Chemistry, (Cornell University Press, Cornell University, NY, 1960) pp. 65–70.
- 13) P. Schwerdtfeger and J.K. Nagle: Mol. Phys. 117 (2019) 1200–1225. doi:10.1080/00268976.2018.1535143
- 14) National Astronomical Observatory of Japan: Chronological Scientific Tables, 2020th ed., (Maruzen, Tokyo, 2019).
- 15) A. Zunger: Phys. Rev. B 22 (1980) 5839–5872. doi:10.1103/PhysRevB.22.5839
- 16) B. Cordero, V. Gómez, A.E. Platero-Prats, M. Revés, J. Echeverría, E. Cremades, F. Barragán and S. Alvarez: J. Chem. Soc. Dalton Trans. 21 (2008) 2832–2838. doi:10.1039/b801115j
- 17) D.G. Pettifor: Solid State Commun. 51 (1984) 31–34. doi:10.1016/0038-1098(84)90765-8
- 18) D.G. Pettifor: J. Phys. C 19 (1986) 285–313. doi:10.1088/0022-3719/19/3/002
- 19) L. Breiman: Mach. Learn. 45 (2001) 5–32. doi:10.1023/A:1010933404324
- 20) A. Furmanchuk, A. Agrawal and A. Choudhary: RSC Adv. 6 (2016) 95246–95251. doi:10.1039/C6RA19284J
- 21) V. Stanev, C. Oses, A.G. Kusne, E. Rodriguez, J. Paglione, S. Curtarolo and I. Takeuchi: Npj Comput. Mater. 4 (2018) 1–14. doi:10.1038/s41524-018-0085-8
- 22) J. Carrete, W. Li, N. Mingo, S. Wang and S. Curtarolo: Phys. Rev. X 4 (2014) 011019. doi:10.1103/PhysRevX.4.011019
- 23) Y. Zhao, Y. Cui, Z. Xiong, J. Jin, Z. Liu, R. Dong and J. Hu: ACS Omega 5 (2020) 3596–3606. doi:10.1021/acsomega.9b04012
- 24) L. Buitinck, G. Louppe, M. Blondel, F. Pedregosa, A. Mueller, O. Grisel, V. Niculae, P. Prettenhofer, A. Gramfort, J. Grobler, R. Layton, J. Vanderplas, A. Joly, B. Holt and G. Varoquaux: (2013) 1–15.
- 25) F. Pedregosa et al.: J. Mach. Learn. Res. 12 (2011) 2825–2830.
- 26) T. Akiba, S. Sano, T. Yanase, T. Ohta and M. Koyama: Proc. ACM SIGKDD Int. Conf. Knowl. Discov. Data Min., (2019) pp. 2623–2631.
- 27) Y. Saeys, I. Inza and P. Larrañaga: Bioinformatics 23 (2007) 2507–2517. doi:10.1093/bioinformatics/btm344
- 28) M.B. Kursa and W.R. Rudnicki: J. Stat. Softw. 36 (2010) 1–13. doi:10.18637/jss.v036.i11
- 29) K.R. Cooper: J. Electrochem. Soc. 157 (2010) B1731. doi:10.1149/1.3481561
- 30) H.M. Rietveld: J. Appl. Crystallogr. 2 (1969) 65–71. doi:10.1107/S0021889869006558
- 31) M. Yonemura, K. Mori, T. Kamiyama, T. Fukunaga, S. Torii, M. Nagao, Y. Ishikawa, Y. Onodera, D.S. Adipranoto, H. Arai, Y. Uchimoto and Z. Ogumi: J. Phys. Conf. Ser. 502 (2014) 012053. doi:10.1088/1742-6596/502/1/012053
- 32) R. Oishi, M. Yonemura, Y. Nishimaki, S. Torii, A. Hoshikawa, T. Ishigaki, T. Morishima, K. Mori and T. Kamiyama: Nucl. Instrum. Methods Phys. Res. Sect. A 600 (2009) 94–96. doi:10.1016/j.nima.2008.11.056
- 33) R. Oishi-Tomiyasu, M. Yonemura and T. Morishima: J. Appl. Crystallogr. 45 (2012) 299–308. doi:10.1107/S0021889812003998
- 34) R. Kanno, M. Murayama and K. Sakamoto: Solid State Ionics (2002) 13–22.
- 35) J. Kuwano and A.R. West: Mater. Res. Bull. 15 (1980) 1661–1667. doi:10.1016/0025-5408(80)90249-4
- 36) A. Khorassani and A.R. West: Solid State Ionics 7 (1982) 1–8. doi:10.1016/0167-2738(82)90060-1
- 37) A.R. Rodger, J. Kuwano and A.R. West: Solid State Ionics 15 (1985) 185–198. doi:10.1016/0167-2738(85)90002-5
- 38) B.E. Liebert and R.A. Huggins: Mater. Res. Bull. 11 (1976) 533–538. doi:10.1016/0025-5408(76)90235-X
- 39) W. Ben Nasr, H. Kchaou and A. Ben Rhaiem: Phys. E 102 (2018) 110–116. doi:10.1016/j.physe.2018.04.026
- 40) E.I. Burmakin, V.I. Voronin and G.S. Shekhtman: Russ. J. Electrochem. 39 (2003) 1124–1129. doi:10.1023/A:1026135806929
- 41) J.C. Bachman, S. Muy, A. Grimaud, H.H. Chang, N. Pour, S.F. Lux, O. Paschos, F. Maglia, S. Lupart, P. Lamp, L. Giordano and Y. Shao-Horn: Chem. Rev. 116 (2016) 140–162. doi:10.1021/acs.chemrev.5b00563
- 42) X. He, Q. Bai, Y. Liu, A.M. Nolan, C. Ling and Y. Mo: Adv. Energy Mater. 9 (2019) 1902078. doi:10.1002/aenm.201902078