Abstract
Suppressed hydrogen peroxide (H2O2) generation and practical H2 oxidation reaction (HOR) activity of the anode catalyst surface is crucial to improve proton exchange membrane fuel cells (PEMFCs) performance. Here, the influence of surface modification on H2O2 generation and HOR activity by introducing tungsten suboxides (WOx) was investigated for platinum catalyst surfaces. A Pt(111) single-crystal substrate surface was used as the model of Pt-nanoparticle anode catalyst surface and modified with WOx through the reactive arc plasma deposition (APD) of W under an O2 partial pressure (p(O2) = 1 × 10⁻¹ or 10−3 Pa). The oxidation states of WOx were estimated by X-ray photoelectron spectroscopy, and the resulting electrocatalytic properties of H2O2 generation and HOR activity were investigated using a scanning electrochemical microscope. The as-prepared oxidation states of WOx were modified depending on p(O2) during the APD. Contrarily, potential cycle (PC) loadings resulted in a similar oxidation state of WOx: substoichiometric oxides containing W4+ or W5+, irrespective of the as-prepared oxidation states of the deposited tungsten. Regardless of the WOx oxidation state, the WOx/Pt(111) surfaces exhibited suppressed H2O2 generation, even accompanied by enhanced HOR activity compared with the clean Pt(111). Therefore, the WOx surface modification can improve the properties of Pt-based anode catalysts and contribute to high-performance catalyst developments.

1. Introduction
Proton exchange membrane fuel cells (PEMFCs) are attracting attention as clean-energy devices, which can convert the chemical energy of H2 into electrical energy through electrochemical reactions. The cathode and anode of PEMFCs are separated by an approximately 10 µm-thick polymer electrolyte membrane (PEM),1) and electrochemical oxygen reduction reaction (ORR) (eq. (1)) and hydrogen oxidation reaction (HOR) (eq. (2)) occur at the cathode and anode, respectively.
| \begin{equation}
\text{O$_{2}$} + \text{4H$^{+}$} + \text{4e$^{-}$} \to \text{2H$_{2}$O}.
\end{equation}
| (1) |
| \begin{equation}
\text{H$_{2}$} \to \text{2H$^{+}$} + \text{2e$^{-}$}.
\end{equation}
| (2) |
PEMFCs are now used in automotive and static applications. However, the high cost and short lifetime of the catalysts, PEM, gas-diffusion layers, etc., must be overcome to realize its widespread use.
2)
The chemical degradation of the PEM, which limits the lifetime of PEMFCs, is a crucial development target.3) In particular, hydrogen peroxide (H2O2) generation at the anode catalyst surface triggers PEM degradation through the scission of the chain of the perfluoroalkylsulfonic acid (PFSA).
At present, carbon-supported Pt nanoparticles (Pt/C) are utilized as PEMFC anode catalysts to facilitate HOR at the anode. However, a portion of O2 can diffuse from the cathode to the anode through the PEM.4) Consequently, the anode Pt/C catalyst promotes ORR through two-electron (eq. (3)) and four-electron pathways (eq. (1)).
| \begin{equation}
\text{O$_{2}$} + \text{2H$^{+}$} + \text{2e$^{-}$} \to \text{H$_{2}$O$_{2}$}
\end{equation}
| (3) |
Dissimilar to the ORR at the cathode, where the four-electron pathway (
eq. (1)) is dominant, the low electrochemical potential at the anode (close to 0 V vs. reversible hydrogen electrode (RHE)) results in H
2O
2 generation via the two-electron pathway (
eq. (3)).
5–9) Thus, the generated H
2O
2 forms reactive radicals (
•OH), which severely damage the PEM.
10) Therefore, the suppression of H
2O
2 generation at the anode Pt/C catalyst surface while maintaining the HOR activity is required to develop effective anode catalyst materials.
11–13)
Here, the influence of surface modification by tungsten suboxides (WOx) on H2O2 generation and HOR activity was investigated. To date, the cooperation of WOx between adjacent Pt anode catalysts has been mainly studied in terms of CO tolerance.14–17) The CO tolerance property is also essential for the PEMFC anode, particularly when using CO-contaminated fuels. Furthermore, in terms of the mitigation of PEM degradation, Trogodas and Ramani reported that the addition of tungsten trioxide (WO3) to Pt/C suppressed H2O2 generation.18,19) Furthermore, regarding the HOR activity, Muthuraman et al. showed that the use of WO3-added Pt/C enhanced the PEMFC performance,20) implying that the addition of WO3 to the Pt/C anode enhanced the HOR activity. However, the oxidation states of tungsten oxides adjacent to Pt and/or the carbon support at the beginning-of-life and end-of-life states remain unclear. Therefore, we prepared two model Pt catalyst surfaces, i.e., Pt(111) single-crystal surfaces modified using two different oxidation states of tungsten (WOx/Pt(111)). The two essential electrocatalytic properties of the PEMFC anode, H2O2 generation, and HOR, were evaluated by scanning electrochemical microscope (SECM). Moreover, electrochemical potential cycles (PCs) were loaded for the WOx/Pt(111) model catalyst surfaces, and changes in electrocatalytic properties (H2O2 generation and HOR) induced by the PC loadings are discussed mainly based on the oxidation states of WOx on the Pt(111) substrate surface.
2. Experimental Procedure
2.1 Sample preparation and surface characterization
2.1.1 Vacuum system
The WOx/Pt(111) surface preparation and characterization were conducted in a vacuum system comprising two ultrahigh vacuum (UHV) chambers (∼10−8 Pa) evacuated using ion pumps and one load-lock chamber (∼10−6 Pa) evacuated using turbo molecular pumps.21,22) The first UHV chamber was equipped with an X-ray photoelectron spectroscopy (XPS) system, an ion gun (OMI-0735ND-S, OMEGATRON), and a direct current (DC) power supply for the UHV annealing of the samples (PAN110-3A, KIKUSUI ELECTRONICS). The second UHV chamber had a scanning tunneling microscopy (STM) system. The load-lock chamber was equipped with an arc plasma deposition (APD) gun (APS-1, ADVANCE-RIKO). The Pt(111) substrate was mounted onto a sample holder with a ceramic heater and was transferred into each chamber using magnet feed through rods.
2.1.2 WOx/Pt(111)
The surface of the Pt(111) single-crystal substrate (99.99%; miscut angle, <0.1°; Mateck) was cleaned by repeated cycles of Ar+ ion sputtering and annealing at ca. 1183 K in the UHV chamber. After subsequent cooling, the surface-cleaned Pt(111) substrate was transferred to the load-lock chamber. WOx was deposited onto the surface-cleaned Pt(111) through the reactive APD23,24) of W under an O2 partial pressure (p(O2)) of 1 × 10⁻¹ and 1 × 10⁻³ Pa. The arc voltage of the APD was fixed at 100 V. A metal W rod (diameter, 10 mm; 99.96%, Semicom Co., Ltd.) was used as a target for the APD. During the reactive APD, high-purity O2 gas (>99.99995%, TAIYO NIPPON SANSO) was introduced into the chamber through a variable leak valve (VAT, 59024-GE01). The deposition amounts of the WOx were calibrated and estimated using a quartz oscillator based on the mass thickness of metal W (density of 19.3 and z-ratio of 0.16). The typical equivalent mass thickness per pulse was ca. 0.002 nm of metal W. Thus, irrespective of the p(O2) of 1 × 10⁻¹ or 1 × 10⁻³ Pa, ca. 0.8 nm-thick (ca. 1.5 µmW/cm2substrate) WOx was deposited onto Pt(111) in the vacuum system.
Thereafter, the WOx-deposited Pt(111) surface was transferred back to the first UHV chamber and annealed at ca. 703 K for 10 min. Note that the W4f bands of WOx/Pt(111) were unchanged by the aforementioned UHV annealing (Fig. A1). Hereinafter, according to the p(O2) (1 × 10⁻¹ or 1 × 10⁻³ Pa) during the reactive APD of tungsten, the WOx/Pt(111) surfaces are referred to as p(O2)-WOx/Pt(111).
2.1.3 Characterization
(1) XPS
The oxidation states of the deposited WOx on the Pt(111) substrate surface were analyzed by XPS in the first UHV chamber, equipped with an X-ray gun (MgKα radiation, XR50, SPECS) and a hemispherical analyzer (PHOIBOS 1500, SPECS). The resulting XPS spectra were analyzed using CasaXPS (Casa Software Ltd.).
(2) STM
STM observations of the WOx/Pt(111) surfaces were conducted in the second UHV chamber with a typical tunneling current of 0.05 nA. The obtained images were analyzed using the Gwyddion open-source software.
2.2 Electrochemical measurements
The vacuum-prepared WOx/Pt(111) was transferred to an N2-purged glove box without exposure to air using a home-built transfer system.25,26) Thereafter, the WOx/Pt(111) surface was covered with an N2-purged solution. A mixed solution of 0.01 M HClO4 + 0.1 M NaClO4 was used to evaluate the HOR activity, and 0.1 M HClO4 was used to evaluate the H2O2 generation property. The solutions were prepared with research-grade chemicals (HClO4, KANTO CHEMICAL; NaClO4, SENDAI WAKO PURE CHEMICALS) and ultrapure water (18.2 MΩ·cm, Milli-Q). All the electrochemical measurements were conducted at room temperature (ca. 298 K).
2.2.1 Cyclic voltammetry
Cyclic voltammetry (CV) was conducted in N2-purged 0.1 M HClO4 in the N2-purged glove box. A conventional three-electrode cell was used. In addition, an RHE and Pt wire were used as the reference electrode (RE) and counter electrode (CE), respectively. The potential sweep rate was fixed at 50 mV/s. The CV measurements were conducted separately from evaluations of HOR activity and H2O2 generation by SECM.
2.2.2 Scanning electrochemical microscopy
The details of the evaluations of the anode properties of the samples by SECM have been previously described.22,27,28) The HV402-E (HOKUTO DENKO) SECM system was used. An Ag/AgCl electrode (saturated KCl, HOKUTO DENKO) and a Pt wire (0.05 mm diameter) electrode were used as the RE and CE of the SECM, respectively. The electrode potentials estimated using Ag/AgCl were converted to vs. RHE scale.27) The HOR activity and H2O2 generation evaluations were conducted in air after the sample surfaces were covered with the N2-purged solution in the glove box.
(1) HOR activity
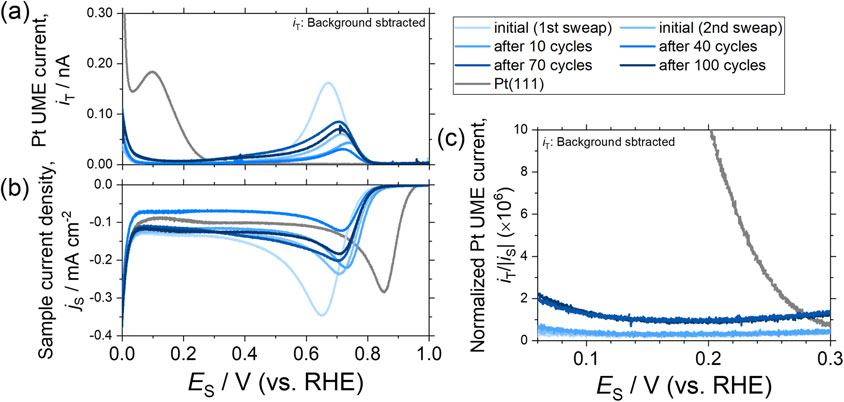
The HOR activity was estimated in the tip generation/substrate collection (TG/SC) mode of SECM in 0.01 M HClO4 + 0.1 M NaClO4.27,29–31) The 25 µm-diameter Pt ultramicroelectrode (UME) surrounded by an insulating glass tube (Sensolytics) was employed as the probe of the SECM measurement. In the TG/SC mode, the distance between the sample surface and UME was fixed at less than 10 µm. The Pt UME potential was maintained at −0.54 V vs. RHE, at which the hydrogen evolution reaction proceeds. The WOx/Pt(111) sample electrode potential (ES) was swept from 0.71 to −0.09 V vs. RHE at a rate of 5 mV/s. The schematics of the TG/SC mode is shown in Fig. 1(a). Under such SECM conditions, the HOR at the sample electrode surface can be feedbacked to the electrochemical current of the Pt UME (iT). As shown in Fig. 1(a), the Pt UME provides the sample electrode with H2 via electrochemical hydrogen evolution reaction. Thereafter, depending on the HOR activity of the sample, H+ is generated on the sample electrode surface. The generated H+ is consumed by the electrochemical hydrogen evolution reaction on the Pt UME, which results in iT-value increase. Here, the standard rate constant (k0) of the HOR was estimated by fitting the dependence of normalized iT-values (IT = iT/iT,∞) against ES to the theoretical equations32–34) where iT,∞ is the Pt UME current recorded prior to the Pt UME/sample surface approach with a sufficient distance from the sample electrode surface.

The H2O2 generation property was evaluated in the substrate generation/tip collection (SG/TC) mode of SECM in O2-saturated 0.1 M HClO4.27,35,36) The Pt UME purchased from Hokuto Denko (Pt diameter, 20 µm) was used as a probe to detect the H2O2 generated at the sample electrode surface. The schematic illustration of H2O2 generation evaluation by the SECM measurement is displayed in Fig. 1(b). The Pt UME potential was maintained at 1.26 V vs. RHE, at which the generated H2O2 could be detected as the anodic Pt UME current (iT). ES was scanned from 1.01 to 0 V vs. RHE at a rate of 2 mV/s.
(3) Potential cycle loading
To investigate the electrochemical stability of the APD-prepared WOx/Pt(111) surfaces, PCs were loaded onto the sample surface. During the PC loading, ES was swept in the range of 0.05–1.0 V vs. RHE at a rate of 100 mV/s for 100 times. The PC loading was conducted just after the evaluation of the H2O2 generation or HOR activity using the same solutions as those used for the respective evaluations.
3. Results and Discussions
3.1 Oxidation states of WOx
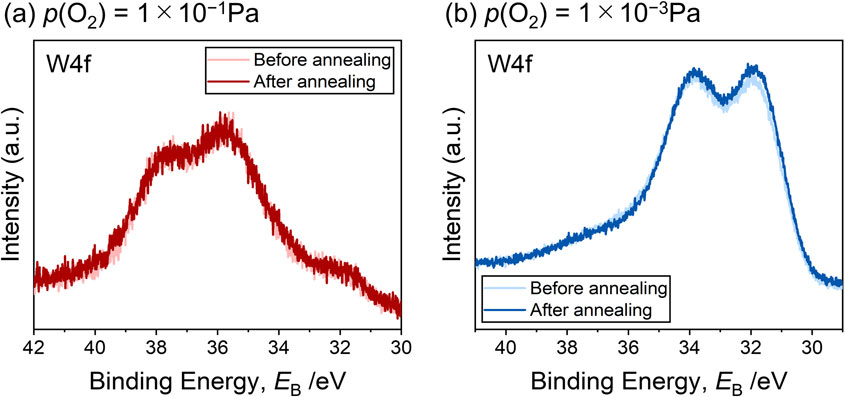
Figure 2 shows the W4f bands of the samples (a) as-prepared and (b) after the 100 PC loadings of WOx/Pt(111) surfaces measured by XPS. The spectral intensities of the W4f bands were normalized to those of the Pt4f bands. The spectral fittings were conducted according to a previous study,37) and the deconvoluted components of each W4f doublet are shown in Fig. 2(a), (b). Wx+ represents the tungsten suboxides with valence numbers smaller than four.

For the W4f bands of the as-prepared WOx/Pt(111) (Fig. 2(a)), the fitting results indicated that WOx comprised various oxidation states of W. According to the area intensity ratios of W4f7/2, each component of the bands was estimated and is shown in Fig. 2(c). The main components of tungsten suboxides for the as-prepared 1 × 10⁻¹ Pa- and 1 × 10⁻³ Pa-WOx/Pt(111) were W6+ and Wx+, respectively. Thus, the surface WOx with different oxidation states can be prepared by changing p(O2) during the reactive APD of tungsten. It is reasonable that a high p(O2) results in the surface WOx having high oxidation states.
Figure 2(b) shows the W4f bands recorded after the 100 PC loading. Despite the different as-prepared oxidation states, the PC loadings resulted in similar oxidation states of the WOx. The PCs were loaded in O2-saturated 0.1 M HClO4 with the evaluation of the H2O2 generation of WOx/Pt(111), the results of which are subsequently described. The results obtained for the band deconvolutions are also shown in Fig. 2(b), and the estimated ratios of each component of the oxidized W are presented in Fig. 2(c), based on the deconvoluted W4f7/2 peak areas. For 1 × 10⁻¹ Pa-WOx/Pt(111), the main component of fully oxidized tungsten (W6+) in its as-prepared state was reduced after the 100 PC loadings. Contrarily, 1 × 10⁻³ Pa-WOx/Pt(111) was oxidized by the loadings. Therefore, the WOx on the Pt surfaces tended to become substoichiometric oxides of W, containing components, such as W4+ or W5+, rather than fully oxidized W+6 (WO3). Interestingly, this result was inconsistent with the E-pH diagram,38) which shows fully oxidized WO3 as an equilibrium phase in the acidic environment used in this study. Oppositely, the result was consistent with previous electrochemical experimental studies. For example, Liu et al. reported a similar change in the W4f band of the WO3-supported Pt nanoparticles by applying potential cycles of 300 times in the range of 0–1.4 V vs. normal hydrogen electrode in 0.1 M HClO4.39) According to Martín et al., a Pt-WO3 electrode exhibited similar changes in the W4f bands after the cell testing, where Pt and WO3 were electrochemically co-deposited on the cathode side of a single PEMFC.40) Possibly, the coexistence of WO3 adjacent to Pt would change the equilibria of the tungsten oxides under the PC test condition.
Noteworthily, the band intensities of W4f decreased after the 100 PC loading, irrespective of the as-prepared oxidation states of WOx. The results implied the dissolution of the surface WOx because of the PC loading. The possibility of dissolution is also suggested by CVs (Fig. 5), which are shown in later section. A previous study showed similar experimental results; the electrodeposited WOx on Pt coil surfaces dissolved in acidic media.41)
3.2 Morphologies of surface WOx
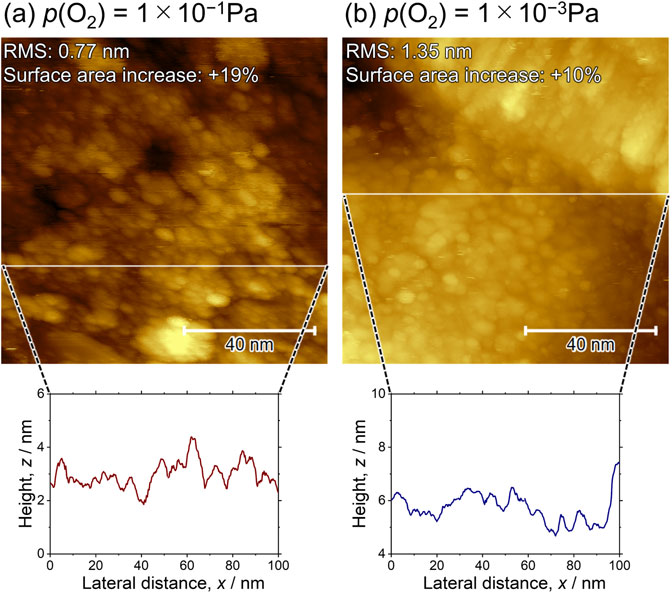
Figure 3 shows the STM images of the as-prepared WOx/Pt(111) surfaces. Cluster-like structures were observed on the 1 × 10⁻¹ Pa- and 1 × 10⁻³ Pa-WOx/Pt(111) surfaces. The root-mean-square roughness of both surfaces estimated from the STM images was approximately 0.2–0.4 nm, i.e., the monoatomic level of height fluctuations. The increases in surface area, compared with an atomically flat surface of Pt(111), were 11% (a) and 4% (b) for the 1 × 10⁻¹ Pa- and 1 × 10⁻³ Pa-WOx/Pt(111) surfaces, respectively. Thus, a difference in the initial surface area would less likely affect the resulting initial electrocatalytic properties (HOR and H2O2 generation), which are subsequently described.

Figure 4 shows the STM images of both WOx/Pt(111) surfaces obtained after the PC loadings in O2-saturated 0.1 M HClO4, accompanied by the SECM evaluation of H2O2 generation. The WOx/Pt(111) surfaces were once exposed to air during the SECM evaluations, whereas the STM images of the as-prepared samples (Fig. 3) were obtained in the UHV chamber without exposing the sample to air. For the PC-loaded WOx/Pt(111) surfaces, the line profiles of the surfaces indicated a-few-nanometer-height fluctuations, and surface roughness increased compared with the as-prepared surfaces (Fig. 3). The result implied that the WOx/Pt(111) surfaces were roughened by the 100 PC loadings, although the surface morphologies were similar for the PC-loaded 1 × 10⁻¹ Pa- and 1 × 10⁻³ Pa-WOx/Pt(111) surfaces.
3.3 Cyclic voltammetry
Figure 5 shows the CV curves recorded just after the immersions of the as-prepared WOx/Pt(111) surfaces in 0.1 M HClO4; the curves of the first five potential sweeps are shown. In particular, the 1st sweep exhibited large anodic currents for both WOx/Pt(111) surfaces. Such CV features imply irreversible anodic reactions of the surface WOx, such as oxidation, and/or anodic dissolution. The results were consistent with the XPS results (Fig. 2) that suggested PC-loading-induced changes in the oxidation states and possible dissolution of the surface WOx. As shown in the CV curves of the 2nd to 5th sweeps, such irreversible CV features became moderate, suggesting that the surfaces were gradually stabilized by the sweepings. Notably, the irreversible CV features were more obvious for 1 × 10⁻³ Pa-WOx/Pt(111) compared with those for 1 × 10⁻¹ Pa-WOx/Pt(111), revealing that the former 1 × 10⁻³ Pa-WOx/Pt(111) was electrochemically less stable against potential sweeps in the pristine state.
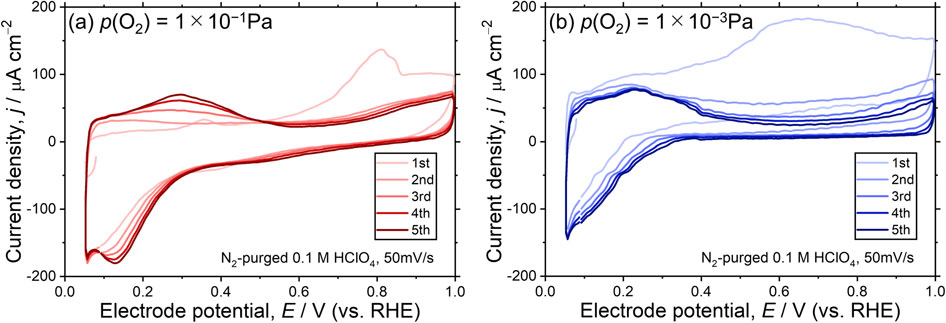
Figure 6 shows changes in the CV curves during the PC loading. The curves were recorded after 10, 40, 70, and 100 PCs. For reference, the corresponding 5th sweep of the as-prepared WOx/Pt(111) surfaces (Fig. 5) are also shown. Compared with the remarkable changes in the first five CV curves of the as-prepared states (Fig. 5), the CV curves of the PC-loaded surfaces were observed to be rather stable against the potential sweeps of the CV measurements.
As shown in Fig. 5 and 6, all the CV curves were characterized by asymmetric redox pairs around 0.2 V vs. RHE, which are probably related to tungsten bronze formation (eq. (4))42–45) and the spillover of adsorbed H2 on adjacent Pt sites to WOx (eq. (5)).46,47) In addition, H2 adsorption/desorption on the Pt surface (eq. (6)) could have affected the CV shapes in such potential regions.7–9)
| \begin{equation}
\text{WO$_{x}$} + \text{$y$H$^{+}$} + \text{$y$e$^{-}$} = \text{H$_{y}$WO$_{x}$}.
\end{equation}
| (4) |
| \begin{equation}
\text{WO$_{x}$} + \text{$y$Pt-H$_{\text{ads}}$} = \text{H$_{y}$WO$_{x}$} + \text{$y$Pt}.
\end{equation}
| (5) |
| \begin{equation}
\text{Pt} + \text{$y$H$^{+}$} + \text{$y$e$^{-}$} = \text{$y$Pt-H$_{\text{ads}}$}.
\end{equation}
| (6) |
Therefore, the CV responses suggested that the electrochemical properties of Pt(111) could have been modified by the surface WO
x, although the aforementioned possible electrochemical reactions (W bronze formation and surface adsorbed hydrogen spillover) are difficult to distinguish based on the present results.
3.4 HOR activity (standard rate constant of k0)
Figure 7 summarizes the SECM-estimated standard rate constants (k0) of HOR, which is the essential reaction at the PEMFC anode. The k0-value of the UHV-cleaned Pt(111) from our previous study27) is also shown as a reference. Representative IT vs. ES curves recorded to estimate the k0-values are shown in Fig. A2. Interestingly, irrespective of p(O2), i.e., the as-prepared oxidation states of the surface WOx, the estimated k0-values for 1 × 10⁻¹ Pa- and 1 × 10⁻³ Pa-WOx/Pt(111) surfaces were larger than those of the clean Pt(111), indicating that the HOR activity of Pt can be enhanced by the surface modification of tungsten suboxides. Furthermore, the k0-values remained higher than those of the clean Pt(111), even after 100 PC loadings, although the values slightly decreased.

As previously deduced from the STM images of the as-prepared WOx/Pt(111) surfaces (Fig. 3), the increase in surface areas by the WOx deposition was not the major factor of the enhanced HOR activity. Rather, the electrochemical properties of the Pt(111) surface modified by the surface WOx were expected to increase the k0-values of the HOR (enhanced activity) of the WOx/Pt(111) surfaces. HOR activity correlates with the binding strength between the Pt electrode surface and adsorbed hydrogen (Hads).48,49) Thus, the HOR activity enhancement by the surface WOx might originate from modified adsorption states of Hads on the Pt surfaces, possibly due to e.g. the hydrogen spillover,46,47) accompanied by W-bronze formation.42–45) At present, the reason why 1 × 10⁻³ Pa-WOx/Pt(111) exhibited higher k0-value than 1 × 10⁻¹ Pa-WOx/Pt(111) remains unclear, yet difference in Hads on the Pt surface sites, which would correspond to the oxidation states of adjacent WOx, might affect the HOR activity. In addition, change in the HOR activity of 1 × 10⁻³ Pa-WOx/Pt(111) against the 100 PCs loading (Fig. 7) was remarkable, compared with that of 1 × 10⁻¹ Pa-WOx/Pt(111). This result might be related to the corresponding CVs changes shown in Fig. 5; that is, 1 × 10⁻³ Pa-WOx/Pt(111) sample was electrochemically less stable against the potential sweeps.
At any rate, it appears that the oxidation state of the surface WOx not so much affects the HOR at the active site of Pt(111), resulting in the enhanced HOR activity of both samples even after the PC loading. Such an effect is quite advantageous in terms of applications for PEMFC anode catalysts.
3.5 H2O2 generation
The evaluated H2O2 generation properties of the WOx/Pt(111) surfaces are shown in Fig. 8. The H2O2 detection current recorded at the Pt UME (iT) normalized by the sample electrode current corresponding to the ORR (iS) of the WOx/Pt(111) surfaces (vertical axis) are plotted against the numbers of PCs (horizontal axis). The iT/|iS|-values at 0.06 V vs. RHE for each sample are shown. The property estimated for the clean Pt(111) is also shown as a reference. The dependence of iT and iS against ES is shown in Fig. A3 and A4 (10−1 Pa- and 10−3 Pa-WOx/Pt(111), respectively).
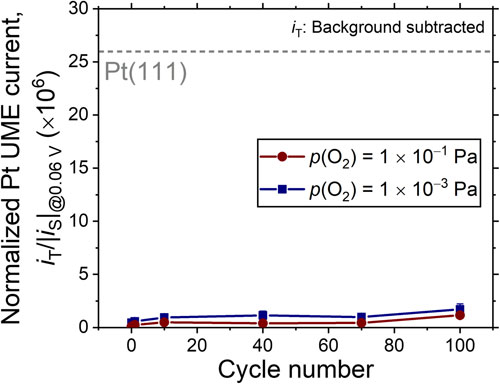
As shown in Fig. 8, the iT/|iS|-values of 1 × 10⁻¹ Pa- and 1 × 10⁻³ Pa-WOx/Pt(111) were considerably smaller than those of the clean Pt(111) throughout the PC loading. The results indicated that the H2O2 generation at the Pt(111) surface was markedly suppressed by the surface WOx. Notably, the iT/|iS|-values, i.e., the H2O2 generation slightly increased as the PC numbers increased. Considering the XPS (Fig. 2) and STM (Fig. 4) analyses after 100 PC loadings, the results possibly correspond to the chemical bonding state and morphological changes of the surface WOx, such as the oxidation state changes, possible dissolution of the surface WOx, and roughening of the WOx/Pt(111) surfaces. However, even after the 100 PC loadings, the iT/|iS|-values of 1 × 10⁻¹ Pa- and 1 × 10⁻³ Pa-WOx/Pt(111) were only less than 1/10, compared with those of the clean Pt(111), clearly indicating that the H2O2 generation could be effectively suppressed by the surface WOx under the power generation conditions of PEMFCs. The mechanism of H2O2 generation on platinum surface close to 0 V vs. RHE is still controversial.8,50,51) Therefore, it is quite difficult to clarify influence of the adjacent WOx of the Pt surface site on suppression of H2O2 generation only based on the present data.
4. Conclusion
Tungsten-suboxide-modified Pt(111) surfaces were prepared as model catalysts for PEMFC anode through the reactive APD of W under two O2 partial pressures (p(O2) = 1 × 10⁻¹ or 10−3 Pa) onto the surface-cleaned Pt(111) in a vacuum. The H2O2 generation properties, HOR activities and their dependence on the PC loadings of the prepared WOx/Pt(111) surfaces were investigated in the SG/TC and TG/SC modes of SECM. The XPS results indicated that the oxidation states of the as-prepared surface WOx were dependent on the p(O2), whereas the oxidation states converged to similar suboxides containing W4+ or W5+ after the 100 PC loadings. Nevertheless, both WOx/Pt(111) surfaces exhibited suppressed H2O2 generation with enhanced HOR activity compared with the clean Pt(111) surface even after the PC loadings. This study highlights that the surface modification of the Pt catalyst using tungsten suboxides could effectively mitigate membrane degradation in PEMFCs.
Acknowledgments
This study was supported by JSPS KAKENHI Grant Number JP21H01645 (TW), JST SPRING Grant Number JPMJSP2114 (KH), and the New Energy and Industrial Technology Development Organization (NEDO) of Japan.
REFERENCES
- 1) H. Matsui, S. Takao, K. Higashi, T. Kaneko, G. Samjeské, T. Uruga, M. Tada and Y. Iwasawa: ACS Appl. Mater. Interfaces 14 (2022) 6762–6776. doi:10.1021/acsami.1c22336
- 2) B.G. Pollet, S.S. Kocha and I. Staffell: Curr. Opin. Electrochem. 16 (2019) 90–95. doi:10.1016/j.coelec.2019.04.021
- 3) R. Borup et al.: Chem. Rev. 107 (2007) 3904–3951. doi:10.1021/cr050182l
- 4) M. Inaba, T. Kinumoto, M. Kiriake, R. Umebayashi, A. Tasaka and Z. Ogumi: Electrochim. Acta 51 (2006) 5746–5753. doi:10.1016/j.electacta.2006.03.008
- 5) U.A. Paulus, T.J. Schmidt, H.A. Gasteiger and R.J. Behm: J. Electroanal. Chem. 495 (2001) 134–145. doi:10.1016/S0022-0728(00)00407-1
- 6) O. Antoine and R. Durand: J. Appl. Electrochem. 30 (2000) 839–844. doi:10.1023/A:1003999818560
- 7) K. Ono, Y. Yasuda, K. Sekizawa, N. Takeuchi, T. Yoshida and M. Sudoh: Electrochim. Acta 97 (2013) 58–65. doi:10.1016/j.electacta.2013.02.070
- 8) N.M. Markovic, H.A. Gasteiger and P.N. Ross: J. Phys. Chem. 99 (1995) 3411–3415. doi:10.1021/j100011a001
- 9) N.M. Marković, R.R. Adžić, B.D. Cahan and E.B. Yeager: J. Electroanal. Chem. 377 (1994) 249–259. doi:10.1016/0022-0728(94)03467-2
- 10) T. Kinumoto, M. Inaba, Y. Nakayama, K. Ogata, R. Umebayashi, A. Tasaka, Y. Iriyama, T. Abe and Z. Ogumi: J. Power Sources 158 (2006) 1222–1228. doi:10.1016/j.jpowsour.2005.10.043
- 11) G. Shi, D.A. Tryk, T. Iwataki, H. Yano, M. Uchida, A. Iiyama and H. Uchida: J. Mater. Chem. A 8 (2020) 1091–1094. doi:10.1039/C9TA12023H
- 12) H. Uchida, G. Shi, M. Imran and D.A. Tryk: J. Electrochem. Soc. 169 (2022) 014516. doi:10.1149/1945-7111/ac4b86
- 13) Y. Nakamori, N. Suzuki, K. Tanaka, T. Aoki, T. Nohira and R. Hagiwara: J. Electrochem. Soc. 165 (2018) F463–F467. doi:10.1149/2.0341807jes
- 14) D.W.G. Stewart, K. Scott, A.J. Wain, T.E. Rosser, E. Brightman, D. Macphee and M. Mamlouk: ACS Appl. Mater. Interfaces 12 (2020) 37079–37091. doi:10.1021/acsami.0c07804
- 15) S.M. Brković, V.M. Nikolić, M.P. Marčeta Kaninski and I.A. Pašti: Int. J. Hydrogen Energ. 44 (2019) 13364–13372. doi:10.1016/j.ijhydene.2019.03.270
- 16) J. Liu and L. Jiang: Int. J. Hydrogen Energ. 43 (2018) 8944–8952. doi:10.1016/j.ijhydene.2018.03.131
- 17) B. Wickman, M. Wesselmark, C. Lagergren and G. Lindbergh: Electrochim. Acta 56 (2011) 9496–9503. doi:10.1016/j.electacta.2011.08.046
- 18) P. Trogadas and V. Ramani: J. Electrochem. Soc. 155 (2008) B696–B703. doi:10.1149/1.2912830
- 19) P. Trogadas and V. Ramani: ECS Trans. 11 (2007) 949–960. doi:10.1149/1.2781007
- 20) N. Muthuraman, P.K. Guruvaiah and P. Gnanabaskara Agneeswara: Mater. Chem. Phys. 133 (2012) 924–931. doi:10.1016/j.matchemphys.2012.01.118
- 21) M. Asano, R. Kawamura, R. Sasakawa, N. Todoroki and T. Wadayama: ACS Catal. 6 (2016) 5285–5289. doi:10.1021/acscatal.6b01466
- 22) K. Hayashi, T. Tomimori, R. Sato, N. Todoroki and T. Wadayama: Phys. Chem. Chem. Phys. 25 (2023) 2770–2775. doi:10.1039/D2CP05430B
- 23) S. Takahashi, N. Takahashi, N. Todoroki and T. Wadayama: ACS Omega 1 (2016) 1247–1252. doi:10.1021/acsomega.6b00412
- 24) N. Todoroki, H. Tsurumaki, A. Shinomiya and T. Wadayama: Electrochem. Sci. Adv. (2022) e2200007. doi:10.1002/elsa.202200007
- 25) T. Wadayama, N. Todoroki, Y. Yamada, T. Sugawara, K. Miyamoto and Y. Iijama: Electrochem. Commun. 12 (2010) 1112–1115. doi:10.1016/j.elecom.2010.05.042
- 26) N. Todoroki, R. Takahashi, Y. Iijima, Y. Yamada, T. Hayashi and T. Wadayama: Mater. Trans. 54 (2013) 1735–1740. doi:10.2320/matertrans.M2013061
- 27) K. Hayashi, T. Tomimori, Y. Chida, N. Todoroki and T. Wadayama: J. Phys. Chem. C 125 (2021) 21481–21487. doi:10.1021/acs.jpcc.1c07322
- 28) K. Hayashi, K. Kusunoki, T. Tomimori, R. Sato, N. Todoroki and T. Wadayama: Phys. Chem. Chem. Phys. 24 (2022) 14277–14283. doi:10.1039/D2CP01261H
- 29) J. Zhou, Y. Zu and A.J. Bard: J. Electroanal. Chem. 491 (2000) 22–29. doi:10.1016/S0022-0728(00)00100-5
- 30) C.G. Zoski: J. Phys. Chem. B 107 (2003) 6401–6405. doi:10.1021/jp027436g
- 31) M.A. Brites Helú and J.L. Fernández: J. Electroanal. Chem. 784 (2017) 33–40. doi:10.1016/j.jelechem.2016.11.065
- 32) S. Amemiya, N. Nioradze, P. Santhosh and M.J. Deible: Anal. Chem. 83 (2011) 5928–5935. doi:10.1021/ac200862t
- 33) C. Lefrou and R. Cornut: ChemPhysChem 11 (2010) 547–556. doi:10.1002/cphc.200900600
- 34) R. Cornut and C. Lefrou: J. Electroanal. Chem. 621 (2008) 178–184. doi:10.1016/j.jelechem.2007.09.021
- 35) C.M. Sánchez-Sánchez and A.J. Bard: Anal. Chem. 81 (2009) 8094–8100. doi:10.1021/ac901291v
- 36) A. Kishi, S. Shironita and M. Umeda: J. Power Sources 197 (2012) 88–92. doi:10.1016/j.jpowsour.2011.08.010
- 37) F.Y. Xie, L. Gong, X. Liu, Y.T. Tao, W.H. Zhang, S.H. Chen, H. Meng and J. Chen: J. Electron Spectrosc. Relat. Phenom. 185 (2012) 112–118. doi:10.1016/j.elspec.2012.01.004
- 38) M. Anik and K. Osseo-Asare: J. Electrochem. Soc. 149 (2002) B224–B233. doi:10.1149/1.1471544
- 39) Y. Liu, S. Shrestha and W.E. Mustain: ACS Catal. 2 (2012) 456–463. doi:10.1021/cs200657w
- 40) A.J. Martín, A.M. Chaparro and L. Daza: J. Power Sources 196 (2011) 4187–4192. doi:10.1016/j.jpowsour.2010.09.015
- 41) N. Horibe, A. Ishihara, S. Mitsushima, N. Kamiya and K. Ota: J. Hydrog. Energy Syst. Soc. Japan 28 (2003) 37–41. doi:10.50988/hess.28.2_37
- 42) J. Park, S. Lee, H.E. Kim, A. Cho, S. Kim, Y. Ye, J.W. Han, H. Lee, J.H. Jang and J. Lee: Angew. Chem. Int. Ed. 58 (2019) 16038–16042. doi:10.1002/anie.201908122
- 43) Y.J. Huang, H.H. Dai, W.S. Li, G.L. Li, D. Shu and H.Y. Chen: J. Power Sources 184 (2008) 348–352. doi:10.1016/j.jpowsour.2008.04.004
- 44) Y. Takabatake, Z. Noda, S.M. Lyth, A. Hayashi and K. Sasaki: Int. J. Hydrogen Energ. 39 (2014) 5074–5082. doi:10.1016/j.ijhydene.2014.01.094
- 45) T. Wadayama, H. Wako and A. Hatta: Mater. Trans., JIM 37 (1996) 1486–1491. doi:10.2320/matertrans1989.37.1486
- 46) H. Tian, X. Cui, L. Zeng, L. Su, Y. Song and J. Shi: J. Mater. Chem. A 7 (2019) 6285–6293. doi:10.1039/C8TA12219A
- 47) M.L. Hernández-Pichardo, R.G. González-Huerta, P. Del Angel, M. Tufiño-Velazquez and L. Lartundo: Int. J. Hydrogen Energ. 40 (2015) 17371–17379. doi:10.1016/j.ijhydene.2015.06.165
- 48) M.P. Mercer and H.E. Hoster: Electrocatalysis 8 (2017) 518–529. doi:10.1007/s12678-017-0381-y
- 49) J. Zheng, W. Sheng, Z. Zhuang, B. Xu and Y. Yan: Sci. Adv. 2 (2016) e1501602. doi:10.1126/sciadv.1501602
- 50) J. Huang, V. Climent, A. Groß and J.M. Feliu: Chin. J. Catal. 43 (2022) 2837–2849. doi:10.1016/S1872-2067(22)64138-X
- 51) V. Briega-Martos, E. Herrero and J.M. Feliu: Electrochem. Commun. 85 (2017) 32–35. doi:10.1016/j.elecom.2017.10.016
Appendix
A1. XPS Prior to and after UHV Annealing
As mentioned in the main text, the WOx/Pt(111) surfaces underwent UHV annealing (703 K, 10 min), which should have created a slightly reducing atmosphere during the sample preparation process. To examine the influence of the UHV annealing on the WOx oxidation states, XPS was conducted prior to and after the UHV annealing. Figure A1 shows that the UHV annealing of both WOx/Pt(111) surfaces did not induce significant changes in the W4f bands.
A2. IT vs. ES Curves Recorded in the TG/SC Mode of SECM
The IT vs. ES curves recorded in the TG/SC mode of SECM are shown in Fig. A2. Standard rate constants (k0) were obtained by fitting these experimental curves to theoretical equations.32–34) The detailed equations and fitting methods are described in our previous study.27)
A3. Dependence of iT and iS against ES in the SG/TC Mode of SECM
Figure A3 and A4 show the voltammograms recorded in the SG/TC mode of SECM to evaluate the H2O2 generation properties. The Pt UME current (iT) (a) and the sample electrode current density (jS) (b) are also shown.
Notably, |jS| markedly increased below ca. 0.06 V vs. RHE owing to the electrochemical hydrogen evolution reaction (HER) from the sample electrode in the potential region. Thus, in such a potential region, the HER current density should overlap jS. Furthermore, the detection current of the generated H2, in addition to the generated H2O2, should overlap iT. Thus, the potential region of ES > 0.06 V vs. RHE is mainly discussed as the H2O2 generation properties of the WOx/Pt(111) surfaces. Figure A3 and A4(c) show the magnified iT normalized by iS against ES in the potential range of 0.06–0.3 V vs. RHE.
The corresponding responses recorded for the clean Pt(111) are shown in gray. Note that the data of the clean Pt(111) was recorded under refined experimental conditions, such as surface cleanliness, and O2-bubbling regulation compared with our previous reports.22,27,28)