Special Issue on Aluminium and Its Alloys for Zero Carbon Society, ICAA 18
Soft X-ray XAFS Analysis of Cluster Formation Process during 353 K Aging in Al–Mg–Si Alloys
2023 年 64 巻 2 号 p. 458-466
詳細
2023 年 64 巻 2 号 p. 458-466
This study investigated the cluster formation process in the early stages of 353 K aging in Al–1.04 mass%Si–0.55 mass%Mg alloys by means of soft X-ray absorption fine structure (XAFS) measurements and first-principles calculations. XAFS at the Si-K and Mg-K edges was carried out at the BL27SU beamline at SPring-8. To observe the structural changes in detail, an XAFS apparatus able to hold the sample at 353 K in a vacuum chamber and cool it rapidly to suppress the progress of clustering was developed. Density functional theory (DFT) calculations were used to simulate the Si-K and Mg-K edge spectra for various cluster models. Based on the results, the cluster formation process in the early stages of aging at 353 K was qualitatively clarified. Initially, Mg–Va (Va: vacancy) pairs and Si–Va pairs were formed, then 2-MgVa clusters formed by bonding between Mg–Va pairs along (100); subsequently, L10 clusters were formed by Mg atoms ordered along (100), and then SiVa-py clusters with Va adjacent to the first-nearest-neighbor atom of Si atoms and Si-py without adjacent Va were formed, in which Mg–Va pairs and Si–Va pairs were individually united, respectively. Monolayer and multilayer structures then developed as aging proceeded, involving Mg and Si atoms ordered along (100), in which Mg and Si atoms were bonded.

Relationship between XANES and calculated normalized difference absorption edge spectra for Mg-K edge, measured results for 0.3∼0.6 ks aging at 353 K and calculated results with Mg–Va (Va: vacancy) model. The baseline for the XANES normalized difference absorption edge spectra is the AQ spectrum and that for the calculated one is the Mg spectrum.
Al–Mg–Si alloys are precipitation-strengthened alloys and are known to exhibit complex age-hardening behavior. The hardness of these alloys increases significantly due to precipitation of the β′′ phase, which is the strengthening phase, during aging at about 443 K following solid-solution treatment. However, the amount of age-hardening declines significantly when the alloys are left at room temperature for a certain period of time following solid-solution treatment (natural aging) and then aged at about 443 K. This phenomenon is a known negative effect in two-step aging.1–11) On the other hand, the degree of age-hardening increases on immediately aging the alloys at temperatures ranging from about 343 to 373 K following solid-solution treatment (artificial aging) and then aging at about 443 K. This phenomenon is a known positive effect in two-step aging.1–11) It has been pointed out that the cause of these hardness differences is the difference in the structures of nanoclusters formed during natural aging and artificial aging. It is suggested that nanoclusters formed during natural aging inhibit precipitation of the β′′ phase, while nanoclusters formed during artificial aging can act as nucleation sites for the β′′ phase and facilitate its precipitation.1,2,5,9,11) The present authors8) have clarified the nanocluster formation process that occurs during natural aging. Furthermore, it became clear that the negative effect in two-step aging occurred with the participation of Mg-vacancy pairs in Mg/Si $ \simeq $ 1 and Si-rich clusters formed in the early stage of natural aging.8)
Many researchers have reported on the observation of precipitations during artificial aging.5,12–16) Serizawa et al.5) performed a study using 3-dimensional atom probe (3DAP) microscopy and found that Mg–Si clusters were formed during 373 K aging for 3.6, 600 and 604.8 ks in Al–0.95Mg–0.81Si (mass%) alloys.15) Murayama et al.,14) on the other hand, reported that Guinier-Preston (GP) zones were formed during 343 K aging for 57.6 ks in Al–0.57Mg–0.31Si and Al–0.53Mg–0.66Si (mass%) based on transmission electron microscopy (TEM) and 3DAP results.15) Inoue et al.16) investigated the behavior of vacancies during 353 K and 373 K aging in Si-excess Al–Mg–Si alloys using positron annihilation spectroscopy. The results showed that quenched-in vacancies form vacancy-solute complexes and that the vacancies become incorporated in the nanoclusters. However, positron annihilation spectroscopy can only provide information in the neighborhood of vacancies, and has difficulty completely clarifying the nanocluster formation process. As described above, although there are many reports on precipitate formation during 353 K aging for durations from tens to hundreds of ks, the details regarding nanocluster formation in the early stages of 353 K aging within tens of ks from the start of aging are not clear. Therefore, the purpose of this study is to clarify the cluster formation process in the early stages of 353 K aging by X-ray absorption fine structure (XAFS) measurements,8,17) which can help clarify the structure and electronic structure around specific atoms.
The samples used in this study were Al–1.04 mass%Si–0.55 mass%Mg alloys provided by UACJ Corporation. The sample dimensions were 10 × 10 × 1 mm3. A solution heat treatment was carried out for 0.6 ks at 823 K in an electric furnace, and the samples were subsequently quenched in ice water (as-quenched: AQ). Isothermal aging at 353 K was performed in an oil bath for durations ranging from 0.6 to 108 ks immediately after quenching (artificial aging: AA).
The AA hardening behavior was evaluated using micro-Vickers hardness measurements conducted on a Mitutoyo HM-102 tester (load: 1.96 N, holding time: 10 s). The highest and lowest values of seven measurements were discarded, and the remaining five results were averaged.
Soft-X-ray XAFS measurements were carried out at the BL27SU beamline at SPring-8. The X-ray absorption near-edge structure (XANES) regions near the Si-K and Mg-K edges were recorded in fluorescence mode using a silicon drift detector (SDD). High-purity Si and high-purity Mg (99.9%) were used as standard samples for comparison. Figure 1 shows a schematic drawing of the XAFS apparatus.17) A vacuum was maintained from the synchrotron radiation ring to the chamber, because soft X-rays are absorbed by air. In this experiment, the pressure of the sample holding chamber at the most downstream point was approximately 33 Pa. From the results of past XAFS measurements,8,17) it was expected that the results would be easily affected by individual differences between samples, especially in the early stages of aging. In addition, since it takes about 2 hours per sample for XAFS measurements, it is hard to observe the structural changes during 353 K aging in detail because the cluster structure undergoes changes during measurement while the aging takes place. Therefore, we developed an apparatus that can hold the sample at 353 K in a vacuum chamber and cool it rapidly to suppress the progress of clustering, and XAFS measurements were carried out after cooling the sample during the process of aging at 353 K without changing samples. The 353 K aging times for the samples were 0.3, 0.9, 1.8, 3.6, 6.3, 9.9, 15.3, 22.5, 33.3, 48.3, 69.9, and 105.9 ks. However, from AQ to the start of 353 K aging, the samples were left at room temperature for 0.6 ks to load the samples into the XAFS measurement system. For the XAFS measurements, samples left for 0.6 ks at room temperature were referred to as AQ alloys. A micro-ceramic heater was used to maintain the sample temperature at 353 K, and liquid nitrogen was used for rapid cooling. The cooling temperature for the samples was below 155 K, and the heating and cooling rates were adjusted to an average of 1.7 K/s using a temperature controller. Moreover, no overshooting or hunting was caused by the PID control. The measured spectra were normalized so that the value of absorption in the high energy side from the absorption edge, 160 eV to 200 eV, is 1 by using Athena software.18,19)

Schematic drawing of XAFS apparatus at BL27SU in SPring-8.17)
To estimate the structural changes in clusters from the changes in the XANES spectra, we carried out first-principles calculations by density functional theory (DFT), as implemented in Advance/PHASE software and calculated by the pseudopotential method using a plane-wave basis set. The PBE (Perdew–Burke–Ernzerhof) version of the generalized gradient approximation (GGA) was used to describe the exchange-correlation functional. The cluster model was set up in a 4 × 4 × 4 supercell with 256 atoms in a face-centered cubic (FCC) Al matrix. The cluster models consisting of Si atoms, Mg atoms or vacancies were built and optimized. Then XANES calculations for each cluster model were performed and compared with the experimental results.20–23) Figure 2 shows some of the cluster models considered in this study. These models were set up in the center of a supercell with 256 Al atom sites. Figures 2(a) and 2(b) represent the solid solution states of Mg and Si atoms, and Figs. 2(c) and 2(d) represent Mg–Va (Va: vacancy) pairs and Si–Va pairs, Fig. 2(e) represents a Si pyramid12) with a Va adjacent to the first-nearest-neighbor atom of a Si atom, Fig. 2(f) represents a Si pyramid12) without an adjacent Va, Fig. 2(g) represents the bonding between Mg–Va pairs along (100), which is the preliminary structure of the model in Fig. 2(h) model, which represents AlMg L10 ordering12) with Mg atoms ordered along (100), and Figs. 2(i) and 2(j) represent a monolayer GP zone13) and a multilayer GP zone13) ordered along (100). Table 1 shows the names of the models in Fig. 2 and their abbreviations. For optimization of the projector-augmented wave (PAW), we used a wavefunction cutoff energy of 5 Hartree, a maximum force per atom of 5.0 × 10⁻⁴ Hartree, a charge-density cutoff energy of 20 Hartree, and a k-point grid with a 2 × 2 × 2 mesh. For the calculations of XANES spectra after optimizations, a core-hole pseudopotential was introduced in the Si atoms and Mg atoms of interest, and a pseudopotential was introduced in the other atoms by the PAW method. For calculation of the XANES spectra, we used a wavefunction cutoff energy of 8 Hartree, a maximum force per atom of 1.0 × 10⁻⁴ Hartree, a charge density cutoff energy of 72 Hartree, and a k-point grid with a 2 × 2 × 2 mesh.20–23)
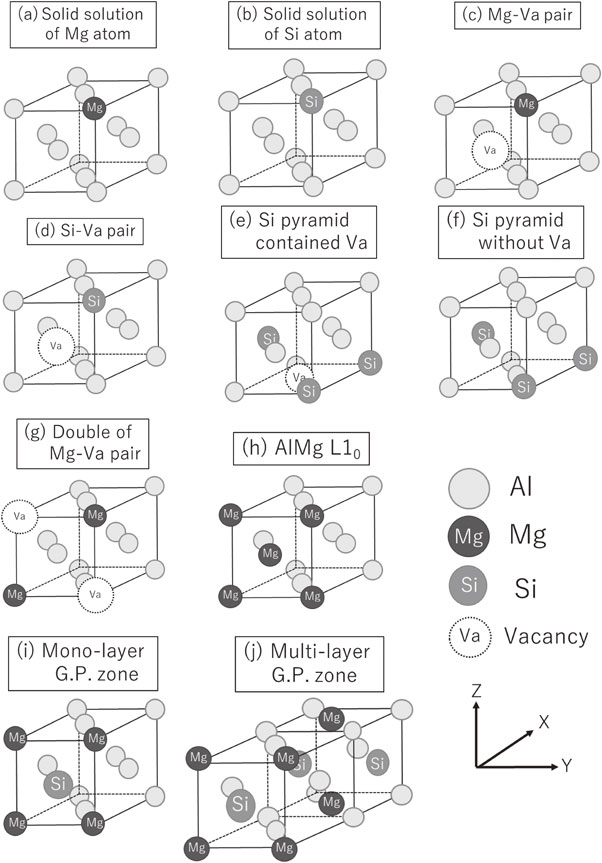
Cluster models for XANES calculation. These models were set up in the center of a supercell with 256 Al atom sites.
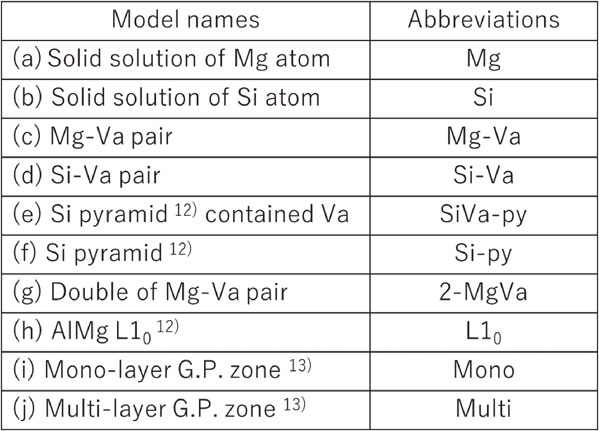
Figure 3 shows the Vickers hardness changes during AA. Immediately after AQ, the hardness increased by ∼25 HV in the first 1.2 ks during AA. A hardness plateau occurred from 1.2 ks to 10.8 ks, and the hardness increased again by ∼12 HV from 10.8 ks to 82.8 ks of AA. Thus, the hardness changes occurred in three stages. We speculated that cluster formation progressed through three stages. Kim et al.24) measured hardness changes during 373 K aging and found a hardness plateau between 0.001 ks and 0.03 ks. However, the cause of the plateau has not been clarified. In the present study, we focused on the period from the start of AA to 21.6 ks when the early part of the third stage of hardness changes occurs, and identified the cluster structure that caused the plateau.

Vickers hardness changes in Al–1.04 mass%Si–0.55 mass% Mg alloy during 353 K aging (AA).
Figure 4(a) shows AA-induced changes in the normalized Mg-K XANES of Al–Mg–Si alloys and high-purity Mg (hereafter, pure Mg). The absorption increased when the incident energy exceeded the edge (1301–1308 eV). There was no significant change in the shape of the spectra as AA progressed; however, after only 0.3 ks of AA, the absorption edge was located at about 4 eV higher energy compared with the absorption edge for pure Mg. Also, the shapes of the spectra of pure Mg and AA were significantly different. Figure 4(b) shows AA-induced changes in the normalized Si-K XANES of Al–Mg–Si alloys and high-purity Si (hereafter, pure Si). The absorption increased when the incident energy exceeded the edge (1836–1843 eV). There was no significant change in the shape of the spectra as AA progressed; however, the shapes of the spectra of pure Si and AA were significantly different.

XANES spectra near (a) Mg-K edge and (b) Si-K edge for Al–Mg–Si alloys and reference samples.
Figures 5(a) and 5(b) show the calculated Mg-K XANES and Si-K XANES spectra, respectively. The calculated spectra agree well with the experimentally recorded spectra in Figs. 4(a) and 4(b), respectively, in the range from ∼15 eV from the absorption edge to the high-energy side. We also observed that the calculated spectra in Fig. 5 vary depending on the cluster model.

Calculated XANES spectra near (a) Mg-K edge and (b) Si-K edge.
To compare the spectral changes in the experimental and calculated spectra for different cluster models, difference spectra were obtained. In addition, it was valued whether the difference spectra shape for the measured and calculated results were consistent, and determined which cluster models were formed majority. Since AQ was considered to be in the solid-solution state, the AQ spectrum was used as the reference spectra in the experimental results, and the spectrum for the Mg model was used as the reference spectra in the Mg-K XANES calculated results, and the difference spectra for the measured and calculated results were obtained, respectively. However, the spectrum for the Si–Va model was used as the reference spectra in the Si-K XANES calculation results. This is because the diffusion coefficient for Si atoms (3.28 × 10⁻²⁶ m2/s) is larger than that for Mg atoms (1.2 × 10⁻²⁶ m2/s) in an Al matrix at 298 K; therefore, we considered that Si atoms are likely to bond with Va to form Si–Va pairs when the sample is left at room temperature for 0.6 ks from immediately after AQ to the start of the XAFS measurements.8)
Figure 6 shows the difference spectra for the measured and calculated results near the Mg-K edge. The shapes of the spectra differ greatly due to the progress of AA and the different models. Figure 6(a) shows the difference spectra for the measured results for AA time durations from 0.3 ks to 0.6 ks and for the calculated results with the Mg–Va model. Both the measured and calculated difference spectra show upwardly convex peaks at ① and ② and a downwardly convex peak at ③; in short, the trends of the difference spectrum shapes were consistent. Therefore, it is expected that Mg–Va pairs are mainly formed from 0.3 ks to 0.6 ks in AA. Figure 6(b) shows the difference spectra for the measured results for AA time durations from 0.6 ks to 3.6 ks and the calculated results for the Mg–Va and 2-MgVa models. With the progress of AA in the measurement difference spectra, and for the formation of 2-MgVa in the calculated spectra, an upwardly convex peak at ①, a downwardly convex peak at ②, an upwardly convex peak at ③, a downwardly convex peak at ④, and then an upwardly convex peak at ⑤ with repeated upward and downwardly convex peaks, are in both cases. In short, the trends of the difference spectrum shapes were consistent between the measured and calculated results. Therefore, it is expected that multiple Mg–Va pairs are formed from 0.6 ks to 3.6 ks in AA and that they are mainly ordered in (100) plane. Figure 6(c) shows difference spectra for the measured results for AA time durations from 3.6 ks to 7.2 ks and the calculated results for the 2-MgVa and L10 models. With the progress of AA in the measurement difference spectra compared to the formation of L10 in the calculated one, in both cases, an upwardly convex peak at ① and a downwardly convex peak at ② with repeating upward and downwardly convex peaks appear. In short, the trends of the difference spectrum shapes between the measured and calculated results were consistent. Therefore, it is expected that L10 ordering is mainly formed by the elimination of Va from 2-MgVa and further merging of Mg atoms from 3.6 ks to 7.2 ks in AA. Figure 6(d) shows the difference spectra for the measured results for AA durations from 7.2 ks to 21.6 ks and the calculated results of the L10, monolayer and multilayer models. In the measured difference spectra, there was almost no change in the spectral shape from 7.2 ks to 15 ks, and then shape changes occurred at 21.6 ks, but the tendency for upwardly convex peaks to be formed at ① and ② and a downwardly convex peak at ③ was consistent. On the other hand, in the calculated difference spectra, the monolayer and multilayer models resulted in the formation of upwardly convex peaks at ① and ② and a downwardly convex peak at ③. In short, the trends of the difference spectrum shapes between the measured and calculated results were consistent. Therefore, it is expected that some of the Mg atoms form L10 ordering bonds with Si atoms and develop into monolayer and multilayer structures from 7.2 ks to 21.6 ks in AA.
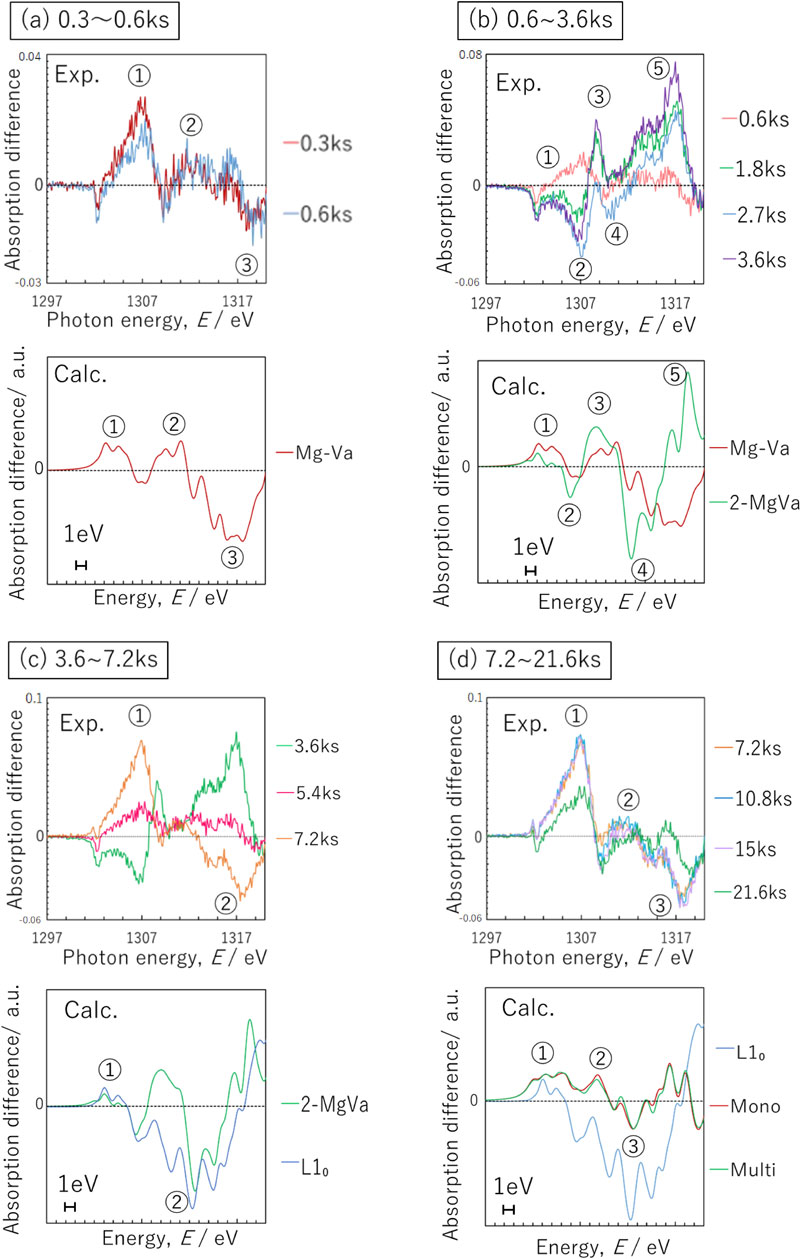
Relationship between XANES and calculated normalized difference absorption edge spectra for Mg-K edge, (a) 0.3∼0.6 ks, (b) 0.6∼3.6 ks, (c) 3.6∼7.2 ks and (d) 7.2∼21.6 ks aging at 353 K. The baseline for the XANES normalized difference absorption edge spectra is the AQ spectrum and that for the calculated one is the Mg spectrum.
Figure 7 shows the difference spectra for the measured and calculated results near the Si-K edge. The shapes of the spectra differ greatly due to the progress of AA and the different models. Figure 7(a) shows the difference spectra between the measured results for AA time durations from 0.3 ks to 2.7 ks and the calculated results for the SiVa-py model. Both the measured and calculated difference spectra showed a downwardly convex peak at ①, an upwardly convex peak at ②, and a downwardly convex peak at ③; in short, the trends of the difference spectrum shapes were consistent. Therefore, it is considered that Si–Va pairs have already formed by 0.3 ks of AA, and then several more Si–Va pairs are formed and SiVa-py consisting of Si atoms and Va is formed from 0.3 ks to 2.7 ks. Figure 7(b) shows a comparison of the difference spectra for the measured results for AA time durations from 2.7 ks to 10.8 ks and the calculated results for the SiVa-py and Si-py models. In the measured difference spectra, as AA progressed, a downwardly convex peak at ①, two upwardly convex peaks at ②, and an upwardly convex peak with low intensity at ③ were formed. On the other hand, focusing on the calculated difference spectra for the Si-py model, a downwardly convex peak at ①, two upwardly convex peaks at ②, and an upwardly convex peak with a lower intensity than ② at ③ were formed. The upwardly convex peak around 1837 eV in the measurement results could not be reproduced in the calculation results, and the shape of this region was not consistent. However, from 1839 eV to the high-energy side, the trends in the shapes of the difference spectra for the measured and calculated results were consistent. Therefore, it is considered that Va is eliminated from SiVa-py and Si-py clusters are mainly formed from 2.7 ks to 10.8 ks. Figure 7(c) shows a comparison between the difference spectra of the measured results for AA time durations from 10.8 ks to 21.6 ks and the calculated results for the monolayer and multilayer models. In the measured difference spectra, upwardly convex peaks were formed at ① and ②, then upwardly and downwardly convex peaks were formed repeatedly, and a downwardly convex peak with the highest intensity was formed at ③. On the other hand, in the calculated difference spectra, upwardly convex peaks with low intensity were formed at ① and ②, then upwardly and downwardly convex peaks were formed repeatedly, and a downwardly convex peak with the highest intensity was formed at ③. The upwardly convex peak around 1836 eV in the measurement results could not be reproduced in the calculation results, and the shape of this region was not consistent. However, from 1839 eV to the high-energy side, the trends in the shapes of the difference spectra for the measured and calculated results were consistent. Therefore, it is considered that some of the Si atoms form Si-py bond with Mg atoms and develop into monolayer and multilayer structures from 10.8 ks to 21.6 ks.
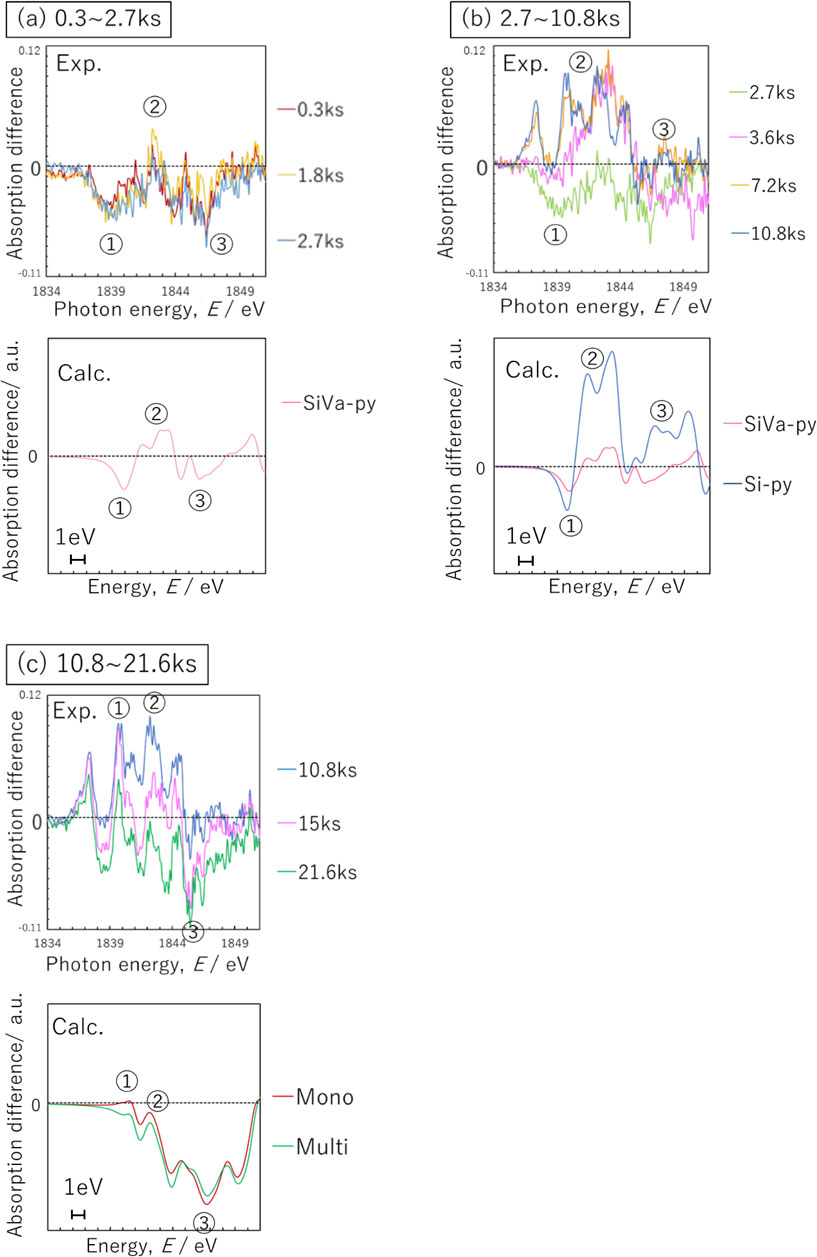
Relationship between XANES and calculated normalized difference absorption edge spectra for Si-K edge, (a) 0.3∼2.7 ks, (b) 2.7∼10.8 ks and (c) 10.8∼21.6 ks aging at 353 K. The baseline for the XANES normalized difference absorption edge spectra is the AQ spectrum and that for the calculated one is the Si–Va spectrum.
In addition to the cluster model shown in Fig. 2, difference spectra were obtained for other cluster models, such as the clusters in which Si–Va and Mg–Va pairs are combined, Si–Mg–Va cluster, eye cluster,12) and initial Si3Mg2 structure,25) but the shapes of the difference spectra did not match the measured results.
There are three reasons why the shapes of the difference spectra for the measured and calculated results are not perfectly consistent. The first is the way the baseline spectrum was selected when calculating the difference spectra for the calculation results. In this calculation, the Mg model and Si–Va model were used as the baseline spectra. However, it is impossible for all Mg atoms to be in the solid solution and all Si atoms to be bound to Va to form Si–Va pairs in the Al matrix aged for 0.6 ks at room temperature. When the Mg or Si–Va model is selected as the baseline spectrum for the calculation results, difference spectra for the calculation results are obtained assuming that all Mg atoms are in the solid solution and all Si atoms form Si–Va pairs in the Al matrix. This is considered to be the main reason for the difference in the shapes of difference spectra between the measured and calculated results. The second reason is the way the calculation models are set up for XANES calculations. The XANES calculations in this study represent the results when all Mg and Si atoms in the Al matrix form the model structure. However, in an actual Al matrix, while Mg and Si atoms that form clusters exist, various mixed structures are formed, such as Mg and Si atoms that are not involved in cluster formation at all, and Mg and Si atoms that remain bound with Va. The third reason is the misalignment of the energy (horizontal axis) in the XANES calculation results. The edge of the XANES calculation represents the excitation energy from the inner orbital to the Fermi energy. However, since the absolute value of the energy cannot be calculated under these conditions, it is necessary to manually shift the energy of the horizontal axis when comparing XANES shapes between the measured and calculated results. This may be one of the reasons for differences in the shapes of difference spectra for the measured and calculated results. For these reasons, although it is possible to qualitatively evaluate the process of cluster formation by XANES calculations, it is impossible for the measured and calculated results to be perfectly consistent.
4.2 Relationship between cluster formation process and hardness changeFigure 8 shows a schematic diagram of major sequence of the cluster formation process during AA, based on the results of XAFS measurements and XANES calculations. Focusing on Mg atoms, it is clear that Mg–Va pairs are formed from 0.3 ks to 0.6 ks of AA; multiple Mg–Va pairs are formed and are mainly ordered along (100) from 0.6 ks to 3.6 ks of AA. L10 clusters are mainly formed by the elimination of Va from 2-MgVa and further merging of Mg atoms from 3.6 ks to 7.2 ks of AA, and some of the Mg atoms form L10 bonds with Si atoms and develop into monolayer and multilayer clusters from 7.2 ks to 21.6 ks in AA. On the other hand, focusing on Si atoms, it is clear that Si–Va pairs are already formed at 0.3 ks in AA, and then several more Si–Va pairs are formed and SiVa-py consisting of Si atoms and Va are formed from 0.3 ks to 2.7 ks. Va are eliminated from SiVa-py, then Si-py consisting of Si atoms are mainly formed from 2.7 ks to 10.8 ks, and some of the Si atoms forming Si-py bond with Mg atoms and develop into monolayer and multilayer structures from 10.8 ks to 21.6 ks.

Relationship between 353 K aging time and major sequence of cluster formation.
These cluster formation processes were compared with the three hardness changes stages shown in Fig. 3. As a result, it was considered that the increase in hardness from 0.3 ks to 1.2 ks in AA was attributed to the formation of Mg–Va pairs and Si–Va pairs, the plateau in hardness from 1.2 ks to 10.8 ks was attributed to the formation of 2-MgVa, L10, SiVa-py and Si-py, in which Mg–Va pairs and Si–Va pairs are individually united, and the increase in hardness after 10.8 ks in AA was attributed to the development of monolayer and multilayer structures, in which Mg and Si atoms are bonded. However, the reasons for the increase in hardness from 0.3 ks to 1.2 ks and the plateau in hardness from 1.2 ks to 10.8 ks were not clear.
Marioara et al.12) reported the β′′ eye, which is a structure comprising the β′′ phase formed by aging at 363 K for 86.4 ks; however, there is no report on precipitates formed before an aging time of 86.4 ks. Matsuda et al.26) and Hasting et al.27) reported the detailed structure of the β′′ eye, but this was reported in the course of structural investigations on the β′′ phase formed during aging at about 450 K. Therefore, the cluster structure formed during aging at 353 K was not clarified. On the other hand, Matsuda et al.13) inferred the GP zone model and reported the existence of a monolayer GP zone and a multilayer GP zone using high-resolution TEM images and energy calculations for Al–1.6 mass%Mg2Si alloys aged at 343 K for 60 ks.3,4) However, the formation process has remained unexplained. Also, Marioara et al.12) reported the formation of Mg L10 and Si pyramid structures during aging at room temperature for 1∼3 months. In this study, Mg L10 and Si pyramid structures were formed during aging at 353 K from about 3 ks to 10 ks. This occurred because the diffusion coefficients for Si atoms in an Al matrix are 3.28 × 10⁻²⁶ m2/s at 298 K and 5.36 × 10⁻²³ m2/s at 353 K, while those for Mg atoms in an Al matrix are 1.2 × 10⁻²⁶ m2/s at 298 K and 2.15 × 10⁻²³ m2/s at 353 K; in short, the diffusion coefficients for both Si and Mg atoms increase significantly with increasing aging temperature from 298 K to 353 K, and cluster formation is promoted compared to aging at room temperature. Inoue et al.16) showed that the nanocluster formation processes during aging at 323 K and 373 K are different, and the higher the aging temperature, the more the formation of Si-rich nanoclusters was suppressed. These results are not inconsistent with the result in the present study that Mg L10, which is a Mg-rich cluster, is formed in addition to Si pyramid clusters during aging at 353 K. This study clarified the behavior of Mg atoms and Si atoms individually during aging at 353 K, and qualitatively explained the cluster formation process in the early stages of aging.
We evaluated the cluster formation process in the early stages of aging of Al–1.04Si–0.55Mg (mass%) alloys at 353 K from 0.3 ks to 21.6 ks (AA) by conducting XAFS measurements and first-principles calculations.
Focusing on Mg atoms, it was clear that Mg–Va pairs were formed from 0.3 ks to 0.6 ks of AA; multiple Mg–Va pairs were formed and were mainly ordered along (100) from 0.6 ks to 3.6 ks of AA; L10 structures were mainly formed by the elimination of Va from 2-MgVa and merging further Mg atoms from 3.6 ks to 7.2 ks of AA; and some of the Mg atoms forming L10 structures bonded with Si atoms and developed into monolayer and multilayer structures from 7.2 ks to 21.6 ks of AA.
Focusing on Si atoms, it was clear that Si–Va pairs had already formed by 0.3 ks of AA, and then several more Si–Va pairs were formed and SiVa-py consisting of Si atoms and Va were formed from 0.3 ks to 2.7 ks; Va were eliminated from SiVa-py and Si-py consisting of Si atoms were mainly formed from 2.7 ks to 10.8 ks; and some of the Si atoms forming Si-py bonded with Mg atoms and developed into monolayer and multilayer structures from 10.8 ks to 21.6 ks.
As described above, the behavior of Mg atoms and Si atoms individually during aging at 353 K was clarified, and the cluster formation process in the early stage of aging was qualitatively explained.
Part of this research was supported by the 2020 Special Scholarship Research Fund of the Light Metal Educational Foundation. Samples were provided by UACJ Corporation. The synchrotron radiation experiment was carried out at BL27SU in SPring-8 with JASRI certification. (Issue number 2021A1585) The authors are very thankful for them.