Special Issue on Aluminium and Its Alloys for Zero Carbon Society, ICAA 18
Modelling Age Hardening of Aluminium Alloys with Consideration of GP Zones or Clusters
2023 年 64 巻 2 号 p. 467-472
詳細
2023 年 64 巻 2 号 p. 467-472
The work reported here follows the theme of our previous research presented at the ICAA16 and ICAA17 conferences, where material models have been developed to predict the microstructure evolution and precipitation hardening of aluminium alloys during cooling and ageing. The models have two important features: one is the consideration of quenched-in vacancies and their effect on precipitation kinetics, which was discussed in past conferences; the other is the formation of GP zones or clusters and their transition to other hardening phases during ageing, which is the focus of this paper. GP zones or clusters are known to serve as precursor phases for various hardening phases. Depending on the ageing temperature being above or below the solvus temperature of the precursor phase, precipitates can either form on their own from the matrix (heterogeneous or HET type) or form on existing GP zones or clusters (homogeneous or HOM type). In the latter case, GP zones or clusters are allowed to form first from the matrix, which will later transform to their metastable counterparts. Both HET and HOM types of precipitates are considered in the current strengthening model for predicting age hardening curves for aluminium alloys. The age hardening model has been validated over a wide range of commercial aluminium alloys and demonstrated good agreement with experimental data in the form of age hardening curve and T5/T6 peak position and strength.

Calculated vs. experimental peak yield strength of commercial alloys.
Heat-treatable aluminium alloys rely on highly dispersed precipitates formed during ageing for strength. Such precipitation process is rather complex, typically involving the formation of precursor phases such as GP zones or clusters, which later transform to more stable hardening phases. Before using the terms of GP zones and clusters, they have to be clearly defined to avoid ambiguities.
The term ‘GP zones’, or Guinier-Preston zones, was historically referred to aggregates of Cu atoms that were first independently detected in Al–Cu alloys (2xxx series) using X-Ray scattering techniques by Guinier1) and Preston2) in 1938. They postulated that such zones had a structure coherent with that of the matrix. This was proved decades later by transmission electron microscope (TEM), revealing GP zones as one atomic layer thick aggregates rich in Cu.3) The term ‘GP zones’ was later extended to also describe pre-precipitation phases in other systems such as 6xxx and 7xxx series alloys,4–7) where GP zones are usually spherical.8,9)
The term ‘clusters’ was used historically to describe the phenomenon responsible for changes in electrical resistivity measured in a number of alloys during ageing.10,11) It was argued that this phenomenon was due to the clustering of solute atoms and quenched-in vacancies. The term ‘clusters’ is usually used to describe regions of the matrix richer in solute than the nominal composition which form aggregates that contain of the order of 100 atoms or less.12) Until the development and use of atom probe tomography (APT), these aggregates were usually referred to as GP zones when they were large enough to be detected using X-Ray scattering techniques.10,12,13) GP zones were found to have the same effect on resistivity as clusters, but due to limitations in resolution they were only detected at later ageing times.14,15) With the use of APT, the distinction between clusters and GP zones blurred as it was possible to resolve smaller groups of solutes.6,16)
Following the above definitions of “clusters” and “GP zones”, the decomposition of supersaturated solid solution (SSSS) observed in aluminium alloys such as 2xxx, 6xxx and 7xxx17–19) often follows a sequence of Ref. 20):
| \begin{align} \mathrm{SSSS}&\to \text{Clusters}\to \text{GP zones}\to \text{Metastable precipitates}\\ &\to \text{Equilibrium precipitates} \end{align} | (1) |
As can be seen that there are four stages of precipitation in terms of microstructural evolution during ageing, which does not correspond well with the observed age hardening curves. Figure 1 shows two types of age hardening curves, both of which contain one strength peak, but Type 2 curve features a strength increasing to a plateau before reaching the final peak. It is now generally accepted that it is the metastable phases that make significant contribution towards the peak strength in both curves, whereas precursor phases are responsible for the hardening plateau prior to peak in the Type 2 curve. The strength drop after peak in both curves is due to overaging, or the coarsening of metastable precipitates. Transition from metastable to equilibrium precipitates takes place after the peak strength is reached as well.

Typical age hardening curves.
As can be seen, each precipitation stage in the precipitation sequence described above does not necessarily correspond to the stages observed in the age hardening curve, and more than two phases can coexist at a given stage of the ageing process. Therefore, in the current context of age hardening curve modelling, the distinction between “clusters” and “GP zones” is not essential as both contribute to the strength plateau in the Type 2 curve as precursor phases. The non-existence of such a plateau in the Type 1 curve indicates that precursor phases may not form in certain ageing conditions and/or alloy systems, which is expected when ageing temperature is above the solvus temperature of clusters or GP zones. The transition from metastable to equilibrium phases is not deemed essential in the current model, as it takes place during overaging and the associated strength drop can be described by the coarsening of metastable precipitates. As such, the precipitation sequence in the microstructural model within the current age hardening modelling becomes:
| \begin{align} \mathrm{SSSS}&\to \text{Precursor phases (Clusters and/or GP zones)}\\ &\to \text{Metastable precipitates} \end{align} | (2) |
The stages of GP zones or clusters described in Sequence-1 can be viewed as being related to the size of aggregates observed at different stages of ageing, and they are treated as one precursor stage in the current approach (Sequence-2). However, these two terms are kept in this context to represent aggregates formed via different mechanisms in different alloy systems. The GP-zones observed by Guinier and Preston in Al–Cu systems (2xxx series) are considered to form via spinodal decomposition of the supersaturated solid solution. Such spinodal decomposition is also possible in Al–Mg–Zn systems (7xxx series) but not in Al–Mg–Si systems (6xxx series). As such, the term “GP zones” in this work is used to describe the precursor phase in 2xxx and 7xxx series alloys where high levels of Cu, Mg and Zn are present, whereas the term “clusters” is used to represent the precursor phases in 6xxx series. In such context, the precipitation sequence in the current strength modelling can be visualised in Fig. 2, depending on whether the ageing temperature, Tage, is below or above the solvus temperature of clusters or GP zones, Tpcr. To distinguish the metastable phases formed via these two means, they are labelled as homogeneous (HOM) or heterogeneous (HET) types, respectively. It should be noted that “homogeneous” and “heterogeneous” are simply used here as labels to distinguish two forms of precipitates, rather than reflecting the nature of the nucleation process involved. The age hardening curve is of Type 1 when Tage is above Tpcr, and Type 2 otherwise.

Precipitation sequence considered in the current material model.
This study is a continuation of our previous research presented at the ICAA16 and ICAA17 conferences,21,22) where material models have been developed to predict the evolution of microstructure and strength/hardness of heat treatable aluminium alloys during cooling and ageing. The models have two important features: one is the consideration of quenched-in vacancies and their effect on precipitation kinetics; the other is the consideration of GP zones and their transition to other hardening phases during ageing of 2xxx and 7xxx series alloys. However, the possible involvement of clusters in 6xxx series alloys has not been dealt with in previous models, which is the focus of this paper. This paper first introduces a thermodynamic description of the clusters. An approach similar to that of the dealing of GP zones is then applied to the clusters, as a result of which age hardening curve can now be calculated for 6xxx alloys. The model performance has been checked against age hardening curves of a wide range of heat-treatable aluminium alloys.
The formation of GP zones and its transition to metastable phases have been reported in ICAA16.21) A further coupling of precipitation kinetics and strengthening models enabled the calculation of age hardening curves and quench sensitivity of Al-alloys, which has been reported in ICAA17.22) The main difference between the dealing of clusters and that of GP zones lies in its thermodynamic description, which is reported below. Other aspects, such as its formation kinetics, transition to metastable phases and precipitation hardening, can follow similar principles and procedures to that of GP zones, and therefore is not reported here.
2.1 Thermodynamics – The CALPHAD approachThe use of thermodynamic calculations via the CALculation of PHAse Diagram (CALPHAD) method has demonstrated that high quality calculations can be made for complex alloy systems.23) The approach has been extended to calculate metastable phase equilibrium including GP zones.21,24)
As clusters are formed through short range ordering of predominantly Mg and Si atoms, it is not possible to model them as a distinct thermodynamic entity using standard models for phases. However, to enable their effect on metastable phase formation and strength, they are considered as a precursor phase to the subsequent distinct Mg/Si metastable phases B′, BETA′, BETA′′ and Q′, in which case their behaviour is approximated by modelling them as a distinct thermodynamic phase with a composition equivalent to that of BETA′ and metastable with respect to it and other Mg/Si metastable phases.
Figure 3 shows a plot of metastable phases as a function of temperature in alloy 6061 (Al–0.2Cr–0.27Cu–0.7Fe–1.0Mg–0.15Mn–0.6Si–0.25Zn in mass%) whereas stable phases are not included in the calculation. The dominant metastable phases can be of various types depending on the ageing temperature, and Q′ is calculated to be the dominant one at the T6 temperature 160°C according to Fig. 3. The clusters are less stable with respect to metastable phases, which is why they are not calculated to appear in Fig. 3. However, they are considered to be of faster formation kinetics and may act as a precursor phase for metastable phases. Figure 4 shows the temperature range where clusters may appear via a metastable calculation including Al and clusters only. As discussed in Ref. 21), it is possible that some precipitates may form either directly from the solid solution matrix or on the GP zones in 2xxx or 7xxx systems. In such cases, the metastable precipitates are treated as two sub-types, termed as heterogeneous or homogeneous in the model, respectively. This may also be possible in 6xxx systems, although the T6 treatment temperatures of these alloys are usually below the calculated solvus of the clusters.
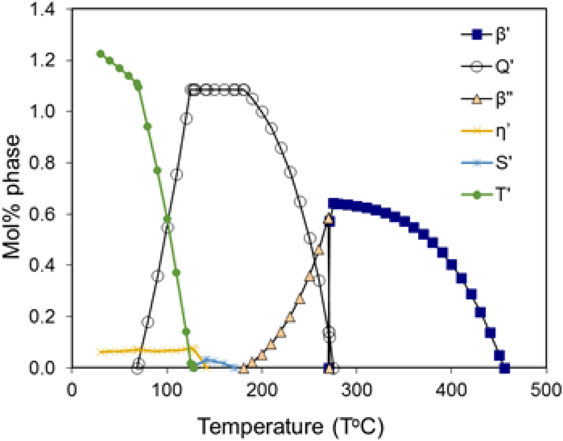
Calculated phase fraction vs. temperature plot for the metastable phases in alloy 6061.

Calculated fraction of clusters vs. temperature plot in alloy 6061.
The thermodynamic description of clusters enables its formation kinetics to be modelled similarly to that of GP zones and metastable phases. The kinetic treatment is based on a modified Johnson-Mehl-Avrami (JMA) model21,25) where critical input such as driving forces, compositions of the precipitating phases are obtained from thermodynamic calculations. The precipitation hardening models have been reported in earlier publications.22,26,27)
In terms of kinetics, Al-alloys potentially present a special case. Solution treatment temperatures are close to melting temperatures and consequently there are large numbers of equilibrium vacancies. On quenching these may be retained leading to considerably enhanced diffusion processes at precipitation temperatures. Precipitation is a diffusion-controlled process and the diffusion is made complicated by these so-called quenched-in vacancies. In other words, the vacancies form during solution treatment, become “excess” when temperature goes down, and annihilate during the following cooling and ageing treatments, making diffusion now a function of both temperature and time. In our previous work,21) the formation and annihilation of quenched-in vacancies and their effect on diffusion have been investigated.
The diffusion affected by quenched-in vacancies is considered in the kinetic models to realise the calculation of isothermal transformations for aluminium alloys. Example calculations of GP zones have been shown in Ref. 21), and the example below is the formation of clusters and its transition to metastable hardening phases, Fig. 5(a), where alloy 6061 is aged at 160°C. The dotted green line in Fig. 5(a) represents the start of isothermal ageing. As can be seen some stable Mg2Si phases have formed during cooling down, which reduces solutes in the matrix before ageing. It should be noted that such isothermal kinetic calculation has not considered the interactions, i.e., the competition for solutes, between the non-cluster metastable phases during isothermal holding. For instance, the fast formation of Q_PRIME_HOM phase removes lots of solutes from the matrix. Such change in matrix composition would result in a change in the driving force of slow-forming phases, rendering different formation kinetics from what’s shown here. In reality, the formation of slow phases may be severely delayed and/or at much reduced amounts.

Calculated (a) isothermal kinetics and (b) age hardening curve for alloy 6061 at cooling rate 1000°C/s and ageing temperature 160°C.
Trying to explicitly model the formation of multiple phases in such cases is extremely convoluted and possibly outside the scope of current kinetic models for application to all types of aluminium alloys. As such, we have followed the Shercliff and Ashby concept28) that these phases are formed simultaneously during heat treatment and at a rate controlled by the dominant hardening phase(s). In the case of alloy 6061 ageing at 160°C, the dominant phase is assumed to be Q_PRIME_HOM according to Fig. 5(a). In reality, the hardening may be due to a mixture of precipitates of various types, each of its own stability and kinetics. But, in the current modelling framework, all the possible hardening phases are assumed to follow the precipitation kinetics of Q′. This simplified approach gives the calculated age hardening curve shown in Fig. 5(b). As can be seen, the main characteristics of the age hardening curve, in terms of the time to reach strength peak (peak time) and the strength value at the peak, both agree well with the reported T6 ageing time (18 hours at 160°C) and peak strength of 275 MPa.29,30) What are also plotted in Fig. 5(b) are the experimental data of alloy 6061 during ageing at 163°C quoting from the work of Shercliff and Ashby.28) It should be noted that the experimental as-quenched hardness is substantially higher than what would be expected for an unhardened, quenched state (close to the O-condition). This implies some hardening reactions already took place prior to ageing, resulting in no strength increase in the early stages of the experimental age hardening curve. The early strength plateau in the calculated curve in Fig. 5(b) is due to the formation of clusters. The final peak strength is due to the formation of Q_PRIME_HOM according to Fig. 5(a), which, in reality, may represent the contribution from a mixture of precipitates.
One direct advantage of considering GP zones or clusters is the ability to deal with natural ageing, where T4 strength, i.e., the strength plateau in the Type 2 age hardening curve in Fig. 1, is due to the formation of such precursor phases. Figure 6(a) shows the calculated natural ageing curves for alloys 2024, 6061 and 7075, in comparison against experimental data from Refs. 29), 30). For both 2024 and 7075 the calculated age hardening curves show an initial rapid increase in strength consistent with observation, which is associated with the formation of GP zones. For 2024, secondary hardening only occurs after the experimental measurements stopped and is fully consistent with observed behaviour. For 7075, the experimental age hardening curve does not show a clear two-peak feature, but the data in the early stages between 0.1 and 10 hours do show a reasonable agreement with the calculated first peak. The experimental data do not reach a strength peak even after 400,000 hours, which is probably due to the maximum ageing time being too short. For 6061, the calculated age hardening curve shows a slow increase in strength up to 100 hours, which follows the experimental data very well. This corresponds to the formation of clusters during early stages of natural ageing,30–32) which may provide both a hardening effect and delay the onset of formation of the metastable MgxSiy phases. No secondary hardening peak is observed in the experimental curve, which is again presumably due to the holding time not being long enough. The cooling rate used in the above calculations is assumed to be 300°C/s. The alloy compositions used in the calculation take their average values with an assumed grain size of 50 µm. These are the default parameters used in the calculations of this work, unless stated otherwise.

The two-peak feature can be better demonstrated in the age hardening curves at higher temperatures, Fig. 6(b), with experimental data taken from Refs. 34)–36). The agreement between the experimental and calculated age hardening curves of the Al–4 mass%Cu alloy at 150°C is reasonable, although one may argue that the experimental curve may potentially contain more than two peaks.34) The calculated age hardening curve of alloy 7075 at 121°C clearly shows a good agreement with the experimental curve in terms of peak positions. It should be noted that the reported T6 hardness is 150 HB (about 150 HV) for 7075 in Ref. 30), which is about the same as the calculated peak but much lower than the measured 195 HB in Ref. 35). As such, the experimental data have been scaled down to match the calculated peak hardness. The age hardening curve of 6061 was at 45°C, which can still be classified as natural ageing. Although it does not show a clear second peak, it does show a clear hardness increase after the initial plateau, implying a possible transition from clusters to other metastable phases.
Zhang et al.37) studied the age hardening behaviour of alloy 356 at different quench rates followed by ageing at 170°C. The cooling rates were estimated as 0.5, 20, 110 and 250°C/s, respectively. A comparison between calculations and experimental data is given in Fig. 7, showing that strength loss becomes noticeable at cooling rate 20°C/s, and is rather significant when cooling rate is 0.5°C/s. It should be noted that the consideration of clusters formation renders much better agreement with experimental data in the early stages of ageing (<1 hour) than the previous model where it was not considered.22)

Age hardening curves of alloy Al-356 at different quench rates, with experimental data from Zhang et al.33)
It is important to check the model performance in a much wider context, in addition to what’s shown in Figs. 6 and 7. An age hardening curve is characterised by two important features, one is the time to reach the (final) strength peak, which reflects the hardening kinetics, and the other is the peak strength itself, which reflects the hardening potential. The model performance is checked below according to these two criteria for a wide range of commercial heat treatable alloys.
As T5/T6 treatments are usually chosen to achieve the maximum strength/hardness without significant overaging, it is important to put the calculated time to reach peak strength (peak time in short, tp_cal) in the context of standard T5/T6 heat treatment time (tp_exp). On one hand, tp_cal should be less than tp_exp, otherwise the alloy would have been judged to be underaged according to calculation – which is not right. On the other hand, tp_cal should not be too far away from tp_exp, otherwise the alloy would have been judged to be severely overaged according to calculation – which is not right either. Figure 8 shows a comparison of time to reach 99% calculated peak strength vs. heat treatment times of a wide range of commercial alloys. As can be seen most of the calculated peak times, tp_cal, fall in the range of tp_exp/2 to tp_cal, which appears very reasonable.

Calculated peak time vs. heat treatment time of commercial alloys.
To check the model performance on the prediction of hardening potential, the calculated yield or 0.2% proof strength (YS) and tensile strength (TS) have been compared against experimental YS/TS data for a wide range of commercial alloys,29,30) Figs. 9 and 10. The dotted lines in the plots show the region of ±50 MPa, where most of the data points fall into, and demonstrated the very good agreement in both cases. The only alloy where significant deviations are observed is 2618. This is because it contains a large fraction (about 5%) of hard intermetallic phases at the solution treatment temperature. These phases are known to contribute a lot to the strength of the alloy,38) but not yet considered in the current strength modelling, resulting in the underestimated calculation values.

Calculated vs. experimental peak yield strength (YS) of commercial alloys.

Calculated vs. experimental peak tensile strength (TS) of commercial alloys.
The recent model development to deal with the formation GP zones or clusters enables the calculation of age hardening curves for most of the heat treatable aluminium alloys in either T4 or T5/T6 conditions. Two types of age hardening curves can now be modelled depending on whether precursor phases exist or not. The integrated kinetics-strength model has been validated against experimental data over a wide range of commercial alloys in the form of age hardening curves, characterised by the time to reach strength peak and the magnitude of peak strength. It proves to be a very useful tool to study the heat treatment of Al-alloys as well as their quench sensitivity.