Abstract
High-strength dilute Mg–Y–Zn alloys with cluster-arranged layer/nanoplate (CAL/CANaP) precipitates were developed via combined processes of low-cooling-rate solidification and extrusion techniques. The effects of CANaP morphology and deformation kink bands installation on the tensile properties of the extruded Mg–Y–Zn alloys were investigated. A slow-cooling solidification process with a cooling rate range of 0.1–0.01 K·s−1 produces a CAL-aggregated region in the α-Mg matrix. The CAL-aggregated region comprises long-period stacking ordered (LPSO) nanoplates with an intergrowth structure and the solo-CAL precipitates. The area fraction of the CAL-aggregated region increased with decreasing cooling rate. The microstructure of the extruded Mg99.2Y0.6Zn0.2 alloys prepared from low cooling rate-solidified ingots consisted of three characteristic regions: (i) dynamically recrystallized (DRXed) fine α-Mg grains, (ii) worked coarse α-Mg grains with a CAL-aggregated region, and (iii) worked blocky LPSO grains. The strength and ductility of the extruded Mg–Y–Zn alloys may be controlled by the volume fractions of the worked and DRXed grains, respectively. It is desirable to control the CANaP thickness and spacing to ∼1 µm and ∼0.8 µm or more, respectively, to promote DRX. Conversely, it is necessary to control the CANaP thickness and spacing to ∼1 µm and ∼0.8 µm or less, respectively, to form the worked grains in which kink bands are introduced.

1. Introduction
Mg alloys have attracted significant attention in industrial fields where weight reduction is required, such as automobiles, railroads, and aerospace, because of their excellent specific strength among lightweight structural metallic materials.1,2) However, Mg alloys find limited use because they exhibit poor strength. Under this situation mentioned above, novel high-strength Mg alloys containing a long-period stacking ordered (LPSO) phase have been developed over the last two decades.3–14) Among them, Mg97Y2Zn1 (at%) alloys with a reasonable LPSO phase volume fraction of ∼25% have been developed as wrought materials, such as extrusions and rolled sheets.7–9) The LPSO phase in the Mg–Y–Zn system, which acts as an alloy strengthening component, possesses unique L12-type Y8Zn6 cluster-arranged layers (CALs) along the basal planes with ABCA stacking in the hcp-Mg matrix.10,11) By periodically introducing CALs into the original hcp-Mg crystal, long-period stacking derivatives can be formed such as 10H, 18R, 14H, and 24R (Ramsdell notation). The LPSO phase limits the activation of the slip system to only the basal and prismatic ⟨a⟩ slips and suppresses deformation twinning.12–15) The restriction of slip systems and twinning in the LPSO phase activates the deformation kinks as an accommodative plastic deformation mechanism.16–20) Strong crystal plasticity anisotropy leads to the development of a strong fiber texture in which the $\langle 10\bar{1}0\rangle $ direction is parallel to the extrusion direction (ED).21) In addition, dynamic recrystallization hardly occurs in the LPSO phase and the α-Mg matrix, including a high density of CALs during thermo-mechanical treatment. Therefore, a multimodal microstructure easily forms in extruded α-Mg/LPSO two-phase Mg97Y2Zn1 alloys. The microstructure of the extruded Mg–Y–Zn alloys can be classified into three regions; that is, (i) fine dynamically recrystallized (DRXed) α-Mg grains with random crystallographic orientations, (ii) coarse worked α-Mg grains with a strong fiber texture of $\langle 10\bar{1}0\rangle $//ED, and (iii) fiber-textured LPSO phase grains.9,22) The DRXed α-Mg grains contribute to improve the ductility, whereas the worked α-Mg grains and the LPSO grains contribute to strengthen the alloy. Furthermore, Hagihara et al. introduced a deformation kink band in the LPSO grains that effectively enhanced the yield stress and work-hardening rate of extruded Mg97Y2Zn1 alloys by hindering the motion of basal dislocations (kink band strengthening).23,24) Recently, the mechanical properties and microstructure of the matrix phase (Mg99.2Y0.6Zn0.28,25)) in Mg/LPSO two-phase Mg–Y–Zn alloys were investigated. The formation of thin stacking-fault-like defects has characterized the dilute Mg99.2Y0.6Zn0.2 alloys with solute enrichment, named “CALs” and/or “LPSO-nanoplate”. Hagihara demonstrated that in the Mg99.2Y0.6Zn0.2 single crystal with profuse LPSO-nanoplates, kink-band formation is induced in the same manner as in the LPSO phase during deformation, resulting in high strength and reasonable ductility.26,27) These results suggest that novel high-strength and ductile dilute Mg–Y–Zn alloys can be developed by appropriately controlling CALs/LPSO-nanoplates formation. There are two main ways to form the CALs/LPSO-nanoplates: (i) precipitation from a super-saturated α-Mg matrix by annealing28) and (ii) crystallization from molten alloy during casting.5,29) Therefore, in this study, a low-cooling-rate solidification process was used to control the formation of CALs/LPSO nanoplates in the Mg99.2Y0.6Zn0.2 alloy. The influence of the cooling rate on the dispersion and morphology of the CALs/LPSO-nanoplates was investigated. High-strength dilute Mg99.2Y0.6Zn0.2 alloys with multimodal microstructure were prepared by a combination of low-cooling-rate solidification and extrusion techniques.
2. Experimental Procedures
Three types of Mg–Y–Zn alloys (Mg99.2Y0.6Zn0.2 (at%), Mg98.4Y1.2Zn0.4, and Mg97.6Y1.8Zn0.6) were prepared by high-frequency induction melting in an Ar atmosphere. The molten alloys were kept at 1023 K, and then cast in a steel mold with a hole (30 mm in diameter and 100 mm in height) or then solidified in a carbon crucible with a hole (70 mm in diameter and 80 mm in height) at various cooling rates. The cooling rate of gravity casting is estimated to be ∼10 K·s−1.9) Cooling rates during the temperature-programmed cooling were controlled at ∼0.15 K·s−1, ∼0.067 K·s−1, ∼0.034 K·s−1, and ∼0.016 K·s−1. The cooling rates, Rc (K·s−1), at each solidification were estimated using the following equation:
| \begin{equation}
R_{c} = \frac{(T_{l} - T_{s})}{t}
\end{equation}
| (1) |
where
Tl is the liquidus temperature,
Ts is the solidus temperature, and
t is the solidification time in seconds.
The gravity-cast alloy was solution-treated at 793 K for 5 h, and aged at 573 K for 5 h to precipitate the LPSO phase/CALs. These ingots were machined into round billets with diameters of 30 mm. The billets were extruded with an extrusion ratio (R) of 10, extrusion temperature (Te) of 573 K, and extrusion ram speed (Vr) of 2.5 mm·s−1.
Tensile tests were performed at room temperature using an Instron testing machine (Instron Model 5500) at an initial strain rate of 5 × 10⁻⁴ s−1. The gauge section of the tensile specimen had a diameter and length of 2.5 and 15 mm, respectively. The tensile axis was parallel to the extrusion direction. The 0.2% proof strength was used as the yield strength.
The microstructures of the specimens were observed using confocally optical microscopy (OM; OPTILICS HYBRID), scanning electron microscopy (SEM; JEOL JSM-7001F) and transmission electron microscopy (TEM; JEOL JEM-2100F). For the OM observation of the microstructure, the specimens were mechanically polished and etched with a mixture of 4.2 g picric acid, 10 ml acetic acid, 80 ml ethyl alcohol, and 10 ml water. For SEM observation, the specimens were polished using paper lapping and ion-milling (JEOL Cross Section Polisher SM-09010). The TEM specimens were thinned via mechanical polishing using ion-milling (GATAN PIPS M-691). Stereographic projections were made by electron back-scatter diffraction pattern analysis (EBSD) with orientation imaging microscopy (OIM; TSL Solutions K.K.).
3. Results
3.1 Microstructure of as-solidified Mg99.2Y0.6Zn0.2 alloys
Figures 1(a)–(e) shows the optical micrographs of the Mg99.2Y0.6Zn0.2 alloys that were solidified at various cooling rates. The gravity-cast (GC) alloy solidified at ∼10 K·s−1 (Fig. 1(a)) and had strongly etched and unetched regions. The strongly etched region corresponds to the LPSO phase. The low-cooling-rate solidified alloys (Figs. 2(b)–(e)) had strongly etched region and gently etched region. The strongly and gently etched regions correspond to the blocky LPSO phase and the CAL-aggregated region, respectively. The unetched region is an α-Mg matrix with an extremely low density of the CALs. The area fractions of blocky LPSO phase and CAL-aggregated regions increased with decreasing cooling rates. Figure 1(f) shows an optical micrograph of the GC alloy that was solution-treated at 793 K for 5 h and then annealed at 573 K for 5 h. Heat treatment uniformly precipitated the CALs. Figure 2 shows SEM images of the Mg99.2Y0.6Zn0.2 alloys taken from the direction perpendicular to the c-axis. The stereographic projections showed that the basal plane of the specimen was almost parallel to the observation direction. The bright contrasts correspond to the LPSO phase and CALs. In the GC alloy (Fig. 2(a)), a small amount of the LPSO phase was observed; however, the CAL-aggregated region was hardly observed. The alloys solidified at low cooling rates of ∼0.15 K·s−1, ∼0.067 K·s−1, ∼0.034 K·s−1, and ∼0.016 K·s−1 had a CAL-aggregated region around the blocky LPSO phase, and the density of CALs increased with decreasing cooling rates, as shown in Fig. 2(b)–(e). In the annealed GC alloy (Fig. 2(f)), a blocky LPSO phase was hardly observed, and profuse CAL precipitates were precipitated instead.

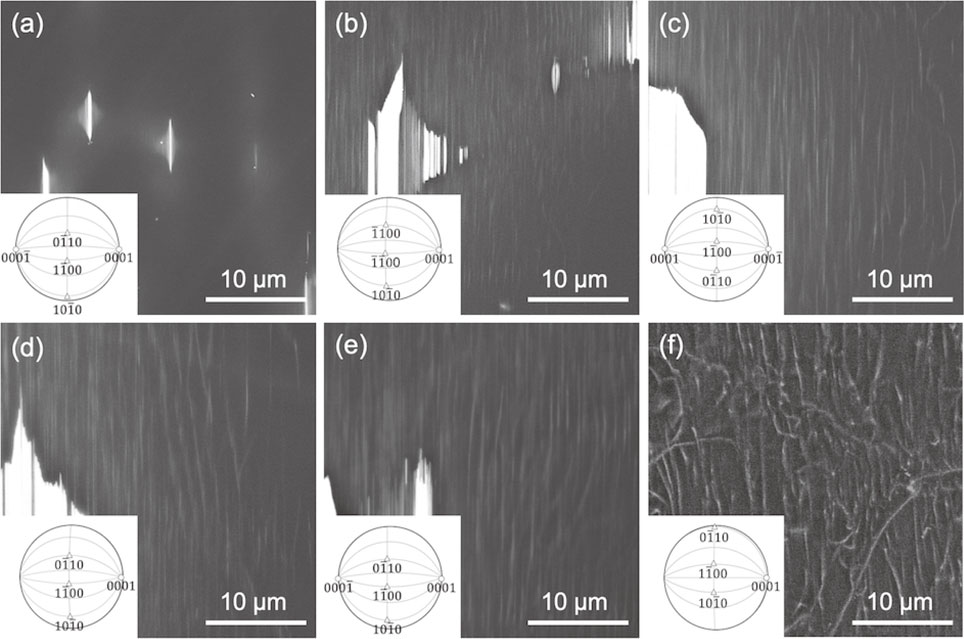
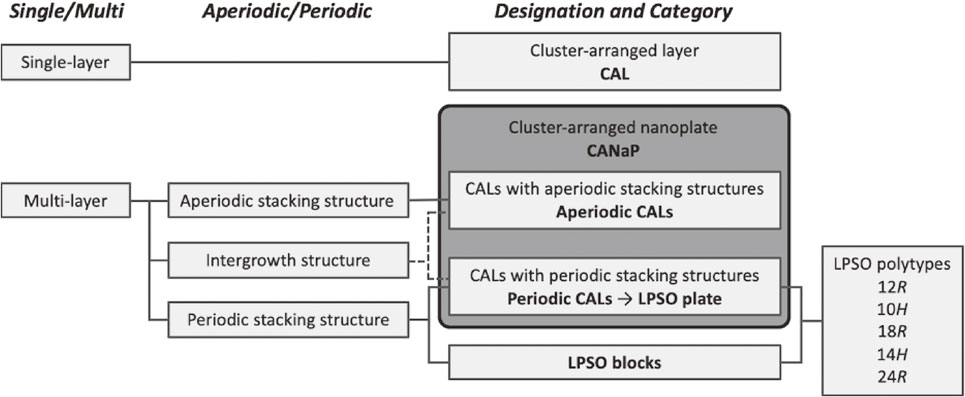
Figure 3 shows the TEM images of the low-cooling-rate-solidified Mg99.2Y0.6Zn0.2 alloys at 0.067 K·s−1 and 0.016 K·s−1, taken from the direction perpendicular to the c-axis. All the low-cooling-rate-solidified alloys observed in this study showed four characteristic morphologies of CAL precipitates and LPSO phase: (i) Blocky LPSO phase with 18R or 14H, (ii) thin LPSO plates with 18R/14H intergrowth structures, (iii) CALs with aperiodic stacking structures, and (iv) CAL single-layer. To quantitatively analyze the CALs/LPSO-nanoplates morphology, the cumulative distributions of the CAL/LPSO thickness for the three specimens solidified at 10 K·s−1, 0.067 K·s−1, and 0.016 K·s−1 were derived from TEM observation, as shown in Fig. 4. The CAL/LPSO thickness takes discrete values, especially when thin, because solo CAL consists of four solute-enriched layers along the c-axis of the hcp structure; its unit thickness is estimated to be 1.04 nm. By the number of Mg-layer sandwiched between the minimal CAL clusters consists of four solute-enriched layers, the type of unit cell in LPSO varies; i.e. 12R, 10H, 18R, 14H, 24R in case of the number of Mg-layer is 0, 1, 2, 3, 4, respectively. The estimated CAL/LPSO thicknesses for each type of LPSO structures are summarized in Table 1. For the GC alloy, the monolayer percentage of CAL was ∼30% and the multi-layered CALs mainly possessed the 18R structure. In contrast, the low-cooling-rate-solidified alloys showed higher monolayer percentages of CAL, reaching more than 40%. Furthermore, the multi-layered CALs in low-cooling-rate-solidified alloys develop into intergrowth structures of 18R and 14H. In the previous study,26) “LPSO nanoplate” was defined as aggregated some four-layer Zn/Y segregated stacking faults between which several random numbers of Mg-layer were sandwiched. In this study, the CALs with aperiodic staking is designated as “aperiodic” cluster-arranged nanoplate (CANaP), and intergrowth structures with periodic arrangement, i.e. periodic CANaP, is defined as LPSO plate. “LPSO nanoplate” is a collective term for CAL and CANaP. Figure 5 summarizes designations and size categories of CAL, CANaP, LPSO plate, and LPSO blocks.
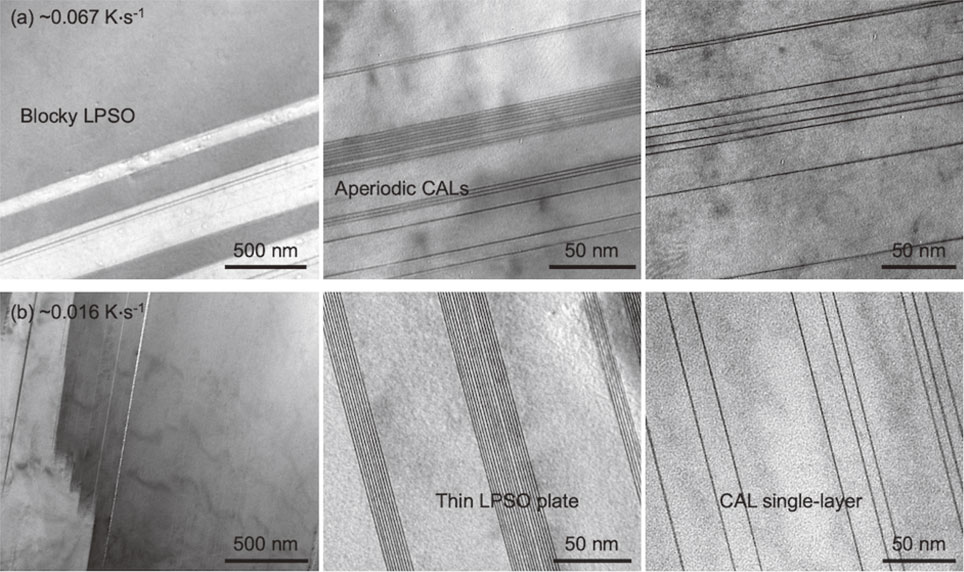

Table 1 Estimated CAL/LPSO thickness in each type of LPSO polytype.
In order to understand the morphology of the CAL/LPSO nanoplates, it is important to investigate mesoscopically not only the thickness but also the spacing between them. Therefore, the CANaP thickness and spacing were derived from SEM observations. Figure 6 shows the schematic diagrams that explain the definitions of the CANaP thickness, tCANP, and the CANaP spacing, DCANP, parallel to the basal plane in this study. The yellow and green lines indicate the tCANP and DCANP, respectively. To measure tCANP and DCANP, SEM images were obtained at x4000 magnification with 43 pixel/µm. Therefore, minimum resolution of the SEM-derived tCANP and DCANP was estimated to be ∼23 nm. To discuss the CANaP thickness and spacing below ∼23 nm, TEM-derived tCANP should be used as shown in Figs. 3 and 4. The area fraction of the CAL-aggregated region, ACAL, derived from OM, and the DCANP measured from SEM are shown as functions of the cooling rate in Fig. 7. Data for heat-treated GC alloys (HT-GC) were also plotted. Here, the CAL-aggregated region refers to the α-Mg portion in which the CALs were densely precipitated and preferentially corroded and blackened under the optimized etching conditions in the OM. The area fraction was determined by binarizing the OM images into the etched and unetched portions. Both the OM-derived ACAL and SEM-derived DCANP increased with decreasing cooling rates.

The microstructure and tensile properties of extruded Mg99.2Y0.6Zn0.2 alloys are greatly affected by the cooling rate during the solidification of the master ingot. Figure 8 shows optical micrographs of extruded Mg99.2Y0.6Zn0.2 alloys taken from transverse sections. In the extruded alloys prepared from low-cooling-rate-solidified ingots (Fig. 8(b)–(e)), three characteristic regions were observed: (i) DRXed fine α-Mg grains, (ii) worked coarse α-Mg grains, and (iii) worked blocky LPSO grains. Rotational kink bands are often observed in worked α-Mg and LPSO grains. The extruded alloy prepared from the GC ingot (Fig. 8(a)) also comprises DRXed and worked α-Mg grains. The area fraction of the worked α-Mg grains is much lower than that in the extruded alloys prepared from low-cooling-rate-consolidated ingots. The extruded alloy prepared from the HT-GC ingot (Fig. 8(f)) mainly consisted of worked α-Mg grains. Figure 9(a) shows the changes in the area fractions of the two types of matrices (the DRXed grains and the worked grains) and the DRXed grain size as a function of the cooling rate. After extrusion, the area fraction of worked grains increased with a reduction in the cooling rate, whereas the area fraction of the DRXed grains decreased. However, when the cooling rate was excessively low, the area fractions of the worked and DRXed grains decreased and increased, respectively. Recently, some researchers have reported that the kink-band strengthening effect can be simply expressed by the number of kink boundaries.30,31) Therefore, the kink boundary dispersion was estimated in this study, and its relationship with mechanical properties was discussed. Unlike a deformation twin with a fixed rotation angle, the rotation angle of a deformation kink can vary arbitrarily. Therefore, in this study, for convenience, we counted the number of kink boundaries with a rotation angle of >5°. The kink boundary dispersion DKB [µm−1] is defined by the following equation:
| \begin{equation}
D_{\text{KB}} = \Sigma N/\Sigma L
\end{equation}
| (2) |
where
N is the number of intersections between the kink boundary and lattice lines, and
L [µm] is the total length of the lattice lines.
Figure 9(b) shows the change in the kink boundary dispersion in the worked grains as a function of the cooling rate during solidification. The kink boundary dispersion in the worked grains tends to increases by reducing the cooling rate, but an excessive slowdown decreases in kink boundary dispersion. When the cooling rate was excessively low, the area fractions of the worked and DRXed grains decreased and increased, respectively. In this study, the highest value of kink boundary dispersion reached 0.11 µm
−1 at the cooling rate of 0.067 k·s
−1.


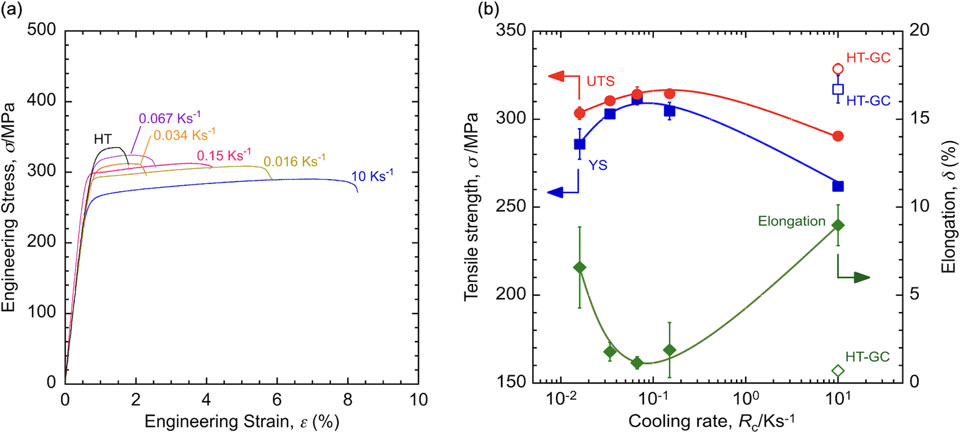
Figure 10 shows the typical tensile stress-strain curves of the extruded Mg99.2Y0.6Zn0.2 alloys and the changes in the tensile properties as a function of the cooling rate. The yield strength and ultimate tensile strength improved with decreasing cooling rate but deteriorated when the cooling rate was lower than 0.067 K·s−1. Ductility shows an opposite trend to that of strength. The yield strength of the extruded alloys prepared from an ingot at a cooling rate of 0.067 K·s−1 was ∼310 MPa. Some microstructural factors control the cooling rate dependency on the mechanical properties of extruded alloy. The relationship between the tensile properties and area fraction of the worked α-Mg grains region of extruded Mg99.2Y0.6Zn0.2 alloys was investigated, as shown in Fig. 11(a). The yield strength increased as the area fraction of the worked α-Mg grains increased but showed a constant value when the area fraction exceeded 80%. Elongation decreased steeply with increasing area fraction of worked α-Mg grains, and showed a very low value of 3% or less when the fraction exceeded 60%. The relationship between the tensile properties and the kink boundary dispersion in the worked α-Mg grains was also investigated, as shown in Fig. 11(b). The yield strength and ultimate tensile strength gradually increased with increasing the kink boundary dispersion, whereas the elongation decreased.
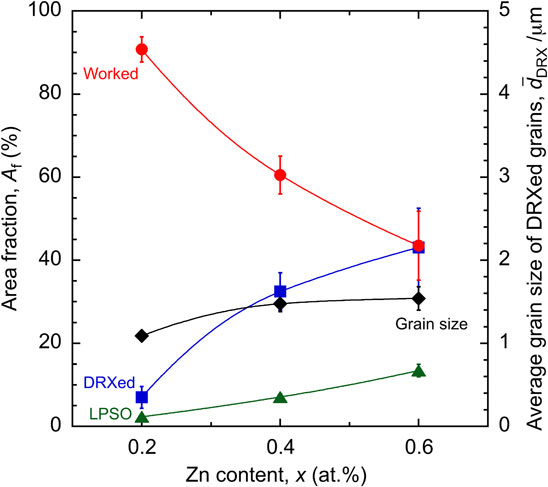
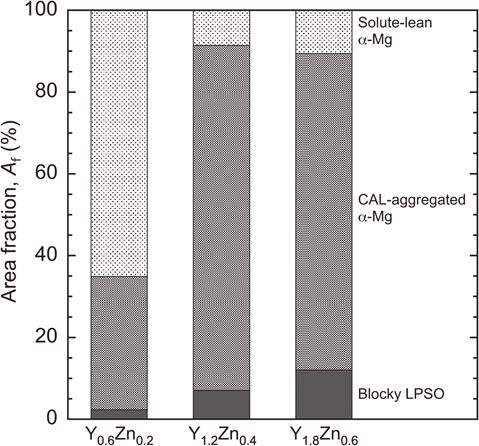
In the previous section, it was found that even a dilute alloy exhibited a yield strength exceeding 310 MPa owing to the extrusion of an ingot solidified at an appropriate cooling rate. However, their ductility is extremely low. This is due to the high volume fraction of worked grains in the extruded alloys. Increasing LPSO phase’s volume fraction promotes dynamic recrystallization (DRX) owing to the particle-stimulated nucleation (PSN) effect.9,21,32,33) Therefore, this study applied a combination of slow-cooling solidification and extrusion techniques to high-alloyed Mg98.4Y1.2Zn0.4 and Mg97.6Y1.8Zn0.6 compositions with a higher volume fraction of the LPSO phase. Figure 12 shows the optical micrographs of the as-solidified and extruded Mg99.2Y0.6Zn0.2, Mg98.4Y1.2Zn0.4, and Mg97.6Y1.8Zn0.6 alloys. The cooling rate was 0.067 K·s−1. The extrusion temperature and extrusion ratio were 573 K and R10, respectively. Micrographs of the extruded alloys were obtained from the transverse section. In the optical micrographs of the as-solidified states in Fig. 12(a1), (b1), (c1), it was observed that CALs were formed over the entire microstructure with increasing amounts of additive elements at low cooling rates. In the optical micrographs of the extruded alloys in Fig. 12(a2), (a3), (b2), (b3), (c2), (c3), three characteristic regions can be observed: the DRXed grains, the worked grains, and the blocky LPSO grains. The DRX tends to occur at the interface between coarse LPSO grains and solute-lean α-Mg grains. Some previous studies have reported that continuous DRX occurs at the kink bands or boundaries during compression testing of kink band-installed Mg–Gd–Y–Zn–Zr and Mg–Y–Gd–Zn–Mn alloys,34,35) but the continuous DRX along kink boundaries was hardly observed in this study. The changes in the area fractions of the LPSO phase, CALs-aggregated α-Mg region, and solute-lean α-Mg region of Mg100−4xY3xZnx (x = 0.2, 0.4, 0.6 at%) alloys solidified at a cooling rate of 0.067 K·s−1 are summarized in Fig. 13. The area fraction of the blocky LPSO region increased monotonously with increasing additive element content. Conversely, the area fraction of the CAL-aggregated α-Mg region increased steeply by adding 0.6 at%Y and 0.2 at%Zn.

Variations in the area fractions of the blocky LPSO and CAL-aggregated α-Mg regions in the as-solidified state affect the formation of a multimodal microstructure in extruded alloys. Figure 14 shows the changes in the area fractions of the two matrices (the worked and the DRXed grains) of the extruded Mg100−4xY3xZnx (x = 0.2, 0.4, 0.6 at%) alloys as a function of solute content. The area fraction of the LPSO phase and the grain sizes of the DRXed grains are plotted. As the solute concentration increased, the area fraction of the DRXed grains increased. Figure 15 shows the compositional dependence of the tensile properties of the extruded Mg100−4xY3xZnx alloys. As the amounts of additive elements increased, the ultimate tensile strength and the ductility improved, although no significant change in the yield strength was observed. This means that the work-hardening ability appeared because of the development of relatively large DRXed grains.
4. Discussion
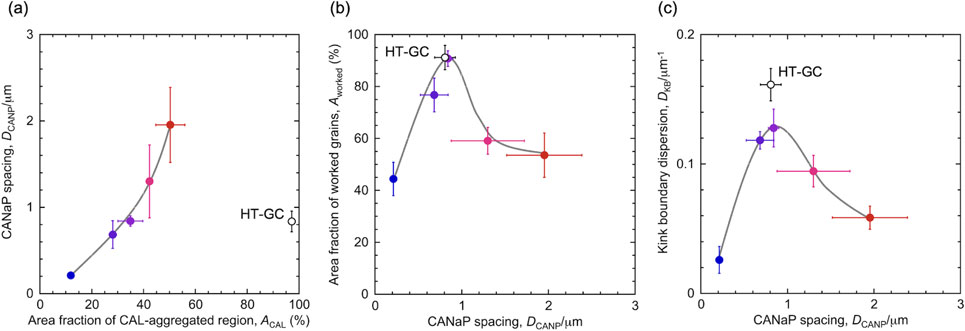
It was known that the extruded Mg–Y–Zn alloys with LPSO/CALs possessed a multimodal microstructure. The DRXed grains maintain reasonable ductility, whereas the worked grains strengthen the alloy. Figure 11 also suggests that the area fraction of the worked α-Mg grains region and the kink boundary dispersion play an essential role in improving the strength. These two factors might be regulated by the CANaP spacing and area fraction of CAL-aggregated region. Figure 16(a) shows relationship between the ACAL and the DCANP in the as-solidified Mg99.2Y0.6Zn0.2 alloys. Because the solute concentration was constant, the DCANP increased with the ACAL. Figure 16(b), (c) shows the changes in the area fraction of worked α-Mg grains and kink boundary dispersion in worked α-Mg grains as a function of CANaP spacing in extruded Mg99.2Y0.6Zn0.2 alloys. The area fraction of the worked α-Mg grains was a convex curve with respect to the change in the CANaP spacing. This indicates that there is an optimum CANaP spacing for the CAL-stimulated texture development. Hot-extrusion results in the development of bimodally-grained microstructure. Precipitation of the LPSO phase and profuse CALs in the α-Mg matrix, which prevents ⟨c⟩ component slip, promotes the development of the $\langle 10\bar{1}0\rangle $//ED fiber texture in the α-Mg phase possessing CALs/LPSO nanoplates.21) Conversely, if the CANaP spacing becomes too large, the effect of suppressing ⟨c⟩ component slip and twinning diminishes, and the area fraction of worked α-Mg grains should decrease because of the promotion of dynamic recrystallization. The variation in kink boundary dispersion also showed a convex curve with respect to the change in CANaP spacing. The kink boundary dispersion was expected to increase as the CANaP spacing decreased. However, the extruded GC Mg99.2Y0.6Zn0.2 alloy showed a low kink boundary dispersion despite having the lowest CANaP spacing. This is because DRX and deformation twinning readily occur in another predominant solute-lean α-Mg region surrounding the CAL-aggregated region. Conversely, a significant expansion of the CANaP spacing weakens the inhibitory effect of the ⟨c⟩ component slip and twinning, decreasing the kink boundary dispersion. This result suggests that to introduce kink deformation bands efficiently, it is necessary to reduce the CANaP spacing to ∼0.8 µm.
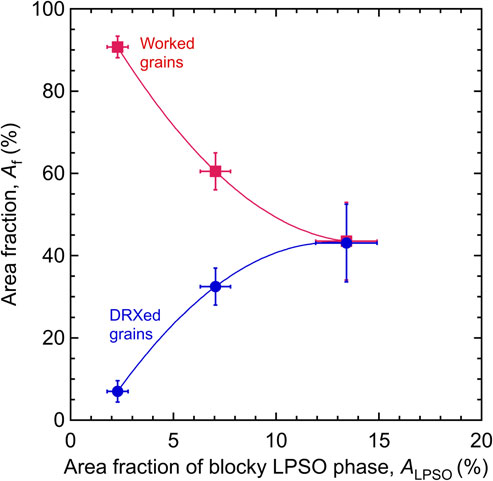
The blocky LPSO phase promotes DRX of the adjacent α-Mg matrix via the PSN during plastic working,9,21,32,33) as shown in Fig. 12(b2), (b3), (c2), and (c3). Figure 17 shows the relationship between the area fractions of the blocky LPSO phase and the DRXed grain region of the extruded Mg100−4xY3xZnx alloys. The area fraction of the DRXed grain region increased with increasing blocky LPSO phase, resulting in an improvement in the ductility of the extruded alloys. PSN has been observed in many alloy systems and is usually only found in particles with diameters greater than ∼1 µm.32,33) It is preferable to control the CANaP thickness to 1 µm or more and the CANaP spacing to 0.8 µm or more to promote DRX in Mg–Y–Zn alloys. By contrast, it is necessary to control the CANaP thickness to 1 µm or less and the CANaP spacing to 0.8 µm or less to form the worked grains in which kink bands are introduced. Both the CANaP thickness and spacing strongly affected the multimodal microstructure evolution.
5. Conclusions
This study attempted to develop high-strength dilute Mg–Y–Zn alloys with CALs via the combined processes of low-cooling-rate solidification and extrusion techniques. It investigated the effects of CAL/LPSO morphology and kink bands installation on the tensile properties of extruded Mg–Y–Zn alloys. The results are summarized as follows.
-
(1)
A slow cooling solidification process with a cooling rate range of 0.1–0.01 K·s−1 produced a CAL-aggregated region in the α-Mg matrix. The CAL-aggregated region was comprised of the LPSO nanoplates with an intergrowth structure and the solo-CAL precipitates. The area fraction of the CAL-aggregated region increased with decreasing cooling rate.
-
(2)
The microstructure of the extruded Mg99.2Y0.6Zn0.2 alloys prepared from low-cooling-rate-solidified ingots consisted of three characteristic regions: (i) DRXed fine α-Mg grains, (ii) worked coarse α-Mg grains with a CAL-aggregated region, and (iii) worked blocky LPSO grains. The area fraction of the worked grains after extrusion tended to increase with a reduction in the cooling rate. However, when the cooling rate was excessively low, the area fractions of the worked grains decreased. The kink boundary dispersion in the worked grains tended to increase with decreasing cooling rate, but an excessive slowdown decreased the kink boundary dispersion.
-
(3)
The yield strength and ultimate tensile strength of the extruded Mg99.2Y0.6Zn0.2 alloys tended to increase with decreasing cooling rate but deteriorate when the cooling rate was slower than 0.067 K·s−1. The yield strength of the extruded alloys prepared from an ingot with a cooling rate of 0.067 K·s−1 reached 310 MPa. The yield strength gradually increased with the increasing area fraction of the worked grains and kink boundary dispersion in the worked grains.
-
(4)
The strength and ductility of the extruded Mg–Y–Zn alloys may be controlled by the volume fractions of the worked α-Mg and DRXed α-Mg grains, respectively. It is desirable to control the CANaP thickness to 1 µm or more and the CANaP spacing to 0.8 µm or more to promote DRX. Conversely, it is necessary to control the CANaP thickness to 1 µm or less and the CANaP spacing to 0.8 µm or less in order to form the worked grains in which kink bands are introduced.
Acknowledgements
This work was supported by the JSPS KAKENHI for Scientific Research on Innovative Areas “MFS Materials Science” (Grant No. JP18H05476 and JP18H05478) and for Scientific Research B (JP21H01673), and partly supported by the JST CREST for Research Area “Nanomechanics” (JPMJCR2094).
REFERENCES
- 1) A.A. Luo: JOM 54 (2002) 42–48. doi:10.1007/BF02701073
- 2) J. Song, J. Chen, X. Xiong, X. Peng, D. Chen and F. Pan: J. Magnes. Alloy. 10 (2022) 863–898. doi:10.1016/j.jma.2022.04.001
- 3) Y. Kawamura, K. Hayashi, A. Inoue and T. Masumoto: Mater. Trans. 42 (2001) 1172–1176. doi:10.2320/matertrans.42.1172
- 4) M. Yamasaki, T. Anan, S. Yoshimoto and Y. Kawamura: Scr. Mater. 53 (2005) 799–803. doi:10.1016/j.scriptamat.2005.06.006
- 5) Y. Kawamura and M. Yamasaki: Mater. Trans. 48 (2007) 2986–2992. doi:10.2320/matertrans.MER2007142
- 6) M. Yamasaki, M. Sasaki, M. Nishijima, K. Hiraga and Y. Kawamura: Acta Mater. 55 (2007) 6798–6805. doi:10.1016/j.actamat.2007.08.033
- 7) S. Yoshimoto, M. Yamasaki and Y. Kawamura: Mater. Trans. 47 (2006) 959–965. doi:10.2320/matertrans.47.959
- 8) K. Hagihara, A. Kinoshita, Y. Sugino, M. Yamasaki, Y. Kawamura, H.Y. Yasuda and Y. Umakoshi: Acta Mater. 58 (2010) 6282–6293. doi:10.1016/j.actamat.2010.07.050
- 9) M. Yamasaki, K. Hashimoto, K. Hagihara and Y. Kawamura: Acta Mater. 59 (2011) 3646–3658. doi:10.1016/j.actamat.2011.02.038
- 10) E. Abe, A. Ono, T. Itoi, M. Yamasaki and Y. Kawamura: Philos. Mag. Lett. 91 (2011) 690–696. doi:10.1080/09500839.2011.609149
- 11) D. Egusa and E. Abe: Acta Mater. 60 (2012) 166–178. doi:10.1016/j.actamat.2011.09.030
- 12) K. Hagihara, N. Yokotani and Y. Umakoshi: Intermetallics 18 (2010) 267–276. doi:10.1016/j.intermet.2009.07.014
- 13) K. Hagihara, Y. Sugino, Y. Fukusumi, Y. Umakoshi and T. Nakano: Mater. Trans. 52 (2011) 1096–1103. doi:10.2320/matertrans.MC201007
- 14) M. Matsuda, S. Ii, Y. Kawamura, Y. Ikuhara and M. Nishida: Mater. Sci. Eng. A 386 (2004) 447–452. doi:10.1016/S0921-5093(04)01017-2
- 15) X.H. Shao, Z.Q. Yang and Z.L. Ma: Philos. Mag. Lett. 94 (2014) 150–156. doi:10.1080/09500839.2014.885123
- 16) X.H. Shao, Z.Q. Yang and X.L. Ma: Acta Mater. 58 (2010) 4760–4771. doi:10.1016/j.actamat.2010.05.012
- 17) M. Yamasaki, K. Hagihara, S.-I. Inoue, J.P. Hadorn and Y. Kawamura: Acta Mater. 61 (2013) 2065–2076. doi:10.1016/j.actamat.2012.12.026
- 18) T. Matsumoto, M. Yamasaki, K. Hagihara and Y. Kawamura: Acta Mater. 151 (2018) 112–124. doi:10.1016/j.actamat.2018.03.034
- 19) S. Yamasaki, T. Tokuzumi, W. Li, M. Mitsuhara, K. Hagihara, T. Fujii and H. Nakashima: Acta Mater. 195 (2020) 25–34. doi:10.1016/j.actamat.2020.04.051
- 20) M. Yamasaki, T. Mayama, T. Matsumoto, K. Hagihara, D. Drozdenko and Y. Kawamura: Mater. Sci. Eng. A 819 (2021) 141466. doi:10.1016/j.msea.2021.141466
- 21) Y. Jono, M. Yamasaki and Y. Kawamura: Mater. Trans. 54 (2013) 703–712. doi:10.2320/matertrans.MI201218
- 22) M. Yamasaki, Z. Shi, A. Atrens, A. Furukawa and Y. Kawamura: Corros. Sci. 200 (2022) 110237. doi:10.1016/j.corsci.2022.110237
- 23) K. Hagihara, Z. Li, M. Yamasaki, Y. Kawamura and T. Nakano: Acta Mater. 163 (2019) 226–239. doi:10.1016/j.actamat.2018.10.016
- 24) K. Hagihara, M. Yamasaki, Y. Kawamura and T. Nakano: Mater. Sci. Eng. A 763 (2019) 138163. doi:10.1016/j.msea.2019.138163
- 25) K. Shiraishi, T. Mayama, M. Yamasaki and Y. Kawamura: Mater. Sci. Eng. A 790 (2020) 139679. doi:10.1016/j.msea.2020.139679
- 26) K. Hagihara, R. Ueyama, M. Yamasaki, Y. Kawamura and T. Nakano: Acta Mater. 209 (2021) 116797. doi:10.1016/j.actamat.2021.116797
- 27) K. Hagihara, R. Ueyama, T. Tokunaga, M. Yamasaki, Y. Kawamura and T. Nakano: Mater. Res. Lett. 9 (2021) 467–474. doi:10.1080/21663831.2021.1974593
- 28) J. Lee, K. Sato, T.J. Konno and K. Hiraga: Mater. Trans. 50 (2009) 222–225. doi:10.2320/matertrans.MRP2008335
- 29) J. Gröbner, A. Kozlov, X.Y. Fang, J. Geng, J.F. Nie and R. Schmid-Fetzer: Acta Mater. 60 (2012) 5948–5962. doi:10.1016/j.actamat.2012.05.035
- 30) Y. Nakasuji, H. Somekawa, M. Yuasa, H. Miyamoto, M. Yamasaki and Y. Kawamura: Mater. Lett. 292 (2021) 129625. doi:10.1016/j.matlet.2021.129625
- 31) H. Somekawa, D. Ando, K. Hagihara, M. Yamasaki and Y. Kawamura: Mater. Charact. 179 (2021) 111348. doi:10.1016/j.matchar.2021.111348
- 32) F.J. Humphreys: Acta Metall. 25 (1977) 1323–1344. doi:10.1016/0001-6160(77)90109-2
- 33) F.J. Humphreys and M. Hatherly: Recrystallization and Related Annealing Phenomena, 2nd ed., (Elsevier Ltd., Oxford, 2004) pp. 293–304.
- 34) W. Liu, Y. Ma, Y. Zhang, X. Fan, C. Xu and J. Zhang: Mater. Sci. Eng. A 690 (2017) 132–136. doi:10.1016/j.msea.2017.02.088
- 35) X. Zhou, C. Liu, Y. Gao, S. Jiang and Z. Chen: J. Alloy. Compd. 749 (2018) 878–886. doi:10.1016/j.jallcom.2018.03.359