Abstract
Severe plastic deformations (SPD) under high pressure, mostly by high-pressure torsion, are employed for producing nanostructured materials and stable or metastable high-pressure phases. However, they were studied postmortem after pressure release. Here, we review recent in situ experimental and theoretical studies of coupled SPD, strain-induced phase transformations (PTs), and microstructure evolution under high pressure obtained under compression in diamond anvil cell or compression and torsion in rotational diamond anvil cell. The utilization of x-ray diffraction with synchrotron radiation allows one to determine the radial distribution of volume fraction of phases, pressure, dislocation density, and crystallite size in each phase and find the main laws of their evolution and interaction. Coupling with the finite element simulations of the sample behavior allows the determination of fields of all components of the stress and plastic strain tensors and volume fraction of high-pressure phase and provides a better understanding of ways to control occurring processes. Atomistic, nanoscale and scale-free phase-field simulations allow elucidation of the main physical mechanisms of the plastic strain-induced drastic reduction in phase transformation pressure (by one to two orders of magnitude), the appearance of new phases, and strain-controlled PT kinetics in comparison with hydrostatic loading. Combining in situ experiments with multiscale theory potentially leads to the formulation of methods to control strain-induced PT and microstructure evolution and designing economic synthetic paths for the defect-induced synthesis of desired high-pressure phases, nanostructures, and nanocomposites.
1. Introduction
In this review, we discuss some recent in situ experimental and theoretical results in SPD, plastic strain-induced PTs, and microstructure evolution under high pressure obtained under compression in diamond anvil cell (DAC) or compression and torsion in rotational DAC (RDAC), see Fig. 1. To avoid repetition with our previous review,1) we assume that its content is known to the readers. Other relevant recent reviews include.2–9)
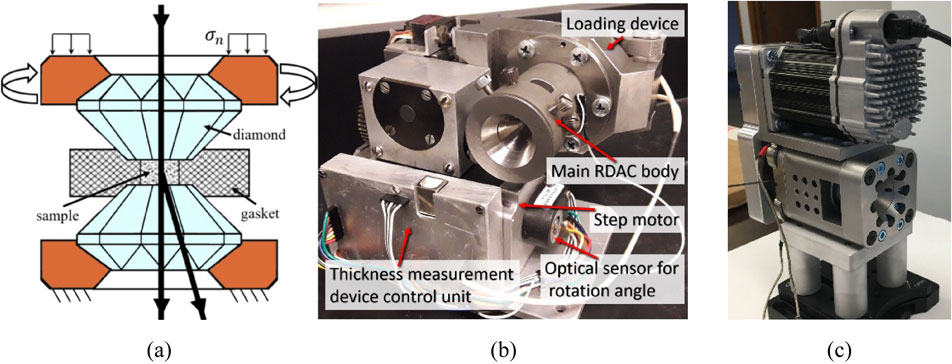
Processes in RDAC are very similar to those occurring during high-pressure torsion (HPT) with metallic or ceramic anvils, which is used to produce SPD leading to nanostructured materials.2,3,6–9) The main advantage of RDAC for basic research is that all processes can be studied in situ under pressure utilizing x-ray diffraction with synchrotron radiation in parallel geometry (Fig. 1(a)) by scanning along the diameter with a step of ∼10 microns with the spot size of ∼10 microns,12–16) thus generating big data for stress-strain, PT, and microstructural analysis. Also, maximum pressure can be much higher with diamond anvils. In parallel geometry (also called axial diffraction), the incipient beam is parallel to the loading direction and passes through diamond, which allows one to find radial distribution of the x-ray patterns and parameters that can be extracted from them. The importance of in situ study with synchrotron radiation in comparison with studies on a retrieved sample is not only that much more data can be measured under pressure in a much shorter time. Some high-pressure phases disappear during unloading after SPD, e.g., ε-iron,17) high-density amorphous phase of SiC,18) and hexagonal diamond.19) Additional plastic deformation may occur during unloading after compression or high-pressure torsion, which may also cause strain-induced direct or reverse PT.20,21) Also, several PTs may occur during the loading and others during unloading, e.g., Si-I → Si-II → Si-XI → Si-V during loading and Si-V → Si XII & III during unloading,16,22) and the final product does not characterize any PT and processes during the loading. Since a material becomes brittle after SPD and internal tensile stresses are present in some regions, damage may also occur during unloading. In addition, during the cutting off a sample for mechanical or XRD studies, direct or reverse PT may also occur, particularly for Zr.23) Preparation of SEM/TEM samples leads to additional changes in material, including changes in the dislocation density and grain size. Lastly, pressure is estimated as force divided by total area, while with DAC/RDAC, the radial pressure distribution is measured;12,14) it is very heterogeneous, and maximum pressure can be three and more times higher than the averaged one.
Several attempts of in situ X-ray diffraction during HPT with metallic anvils use diffraction with the beam orthogonal to the compression direction,24,25) called perpendicular geometry. However, x-ray patterns in this case are averaged over very heterogeneous fields, including nondeformed material, and just one value is measured for the prescribed load and rotation angle. Thus, it is much less informative than the axial diffraction measurements. Still, an important result in Ref. 25) was that during pressure release after SPD of Ni at 8 GPa, the crystallite size was increased by more than a factor of 2, and dislocation density was decreased by about a factor of 3, confirming the importance of in situ studies under pressure. Even the application of hydrostatic pressure can significantly increase the dislocation density and reduce the crystallite size, e.g., by a factor of 2 for Zr.26)
2. Pressure-, Stress-, and Plastic Strain-Induced PTs under High Pressure
Historically, PTs are characterized by pressure-temperature equilibrium phase diagrams for any material system, which define a region of stability of different phases. Each phase boundary is defined theoretically from the equality of Gibbs energies of phases. In experiments, PT to a high (low)-pressure phase starts above (below) the equilibrium pressure, producing pressure hysteresis, within which metastable phases may exist. If a high-pressure phase can be retained as a metastable phase at ambient pressure, it could potentially be used in engineering applications. It is well known that nonhydrostatic stresses and plastic strain reduce the PT pressure and pressure hysteresis,1,3,4,6,8,27–29) giving a chance to better localize the phase equilibrium pressure. Thus, during HPT, both direct and reverse B1-B2 PT in KCl,27) and α-ω PTs in Zr and Ti27,30) occur at the same pressure, which was interpreted as the phase equilibrium pressure. However, problems appeared when plastic shear reduced the PT pressure below the known phase equilibrium pressure, e.g., for semiconductor-metal PTs in Si, Ge, InTe, and InSb.27) This means plastic shear reduces the phase equilibrium pressure, which was realized as a pressure-temperature-shear diagram for Si and Ge.27) In addition to the above phenomena, plastic shear leads to new phases not obtained under hydrostatic conditions, arresting high-pressure phases at normal conditions and plastic strain-controlled kinetics.1,3,4,8,18,19,27–29) However, no theoretical explanation existed for any of the above phenomena.
The first theoretical treatment, at three scales, was suggested in Refs. 28, 29). What may be more important the classification of high-pressure PTs was suggested. Thus, under hydrostatic and quasi-hydrostatic loadings below the yield strength, PTs are classified as pressure- and stress-induced. They initiate at crystal defects that pre-exist in a material, e.g., dislocations or grain boundaries, which produce a concentration of all stress tensor components and represent sites for heterogeneous nucleation of a high-pressure phase. A review of the theoretical background and characterization of the pressure-induced and stress-induced PTs is presented in Refs. 4, 5). One of the assumptions was that hydrostatic pressure and stresses below the yield strength do not increase the number of defects. That is why one must increase pressure or stresses in the course of the PT to cause nucleation at defects with lower stress concentrations. However, it was found recently that even hydrostatic pressure can significantly increase the dislocation density and reduce the crystallite size, e.g., by a factor of 2 for Zr26) before α → ω PT; dislocation density reduces, and the crystallite size increases in the low-pressure phase during the PT. Still, these changes are much smaller than during SPD and do not change the concept.
PTs during plastic deformation under high pressure have been coined strain-induced PTs.28,29) They occur by nucleation and limited growth at defects produced during plastic deformation. The largest concentration of all stress components is produced at the tip of the dislocation pileups against grain boundary or other obstacles, which is proportional to the number of dislocations in a pileup; a corresponding analytical model was developed in Refs. 28, 29). Since the number of dislocations can be huge, from 10 to 100, local stresses may also be very large; they can grow during plastic straining at relatively low applied pressure, thus driving PTs. An important feature is that the deviatoric stresses in a nanosized defect-free region near the tip of a pileup are not limited by the engineering yield strength in shear (∼1 GPa), but by the theoretical shear strength, which is one to two orders of magnitude larger. Local stress tensor of such magnitude can meet the PT (i.e., crystal lattice instability) criterion for the perfect crystal (determined, e.g., for Si-I → Si-II PT by atomistic simulations in Refs. 31–34)) and cause barrierless nucleation at an external pressure that is not only drastically smaller than for hydrostatic conditions but also well lower than the phase-equilibrium pressure. Also, such highly-deviatoric stress states at the level of the ideal strength cannot be realized in bulk and may lead to PTs that could not be obtained without plastic flow. It was concluded in Refs. 28, 29) that strain-induced PTs require completely different theoretical thermodynamic and kinetic consideration and experimental characterization than the pressure- and stress-induced PTs.
3. In situ X-ray Studies with Synchrotron Radiation of Strain-Induced Phase Transformations and Microstructure Evolution in DAC and RDAC in Parallel Geometry
The utilization of x-ray diffraction with synchrotron radiation allows one to measure x-ray patterns in local points of a sample within a short time utilizing multiple governmental facilities. Our experiments12–16) were performed at 16-BM-D and 16-ID-B beamlines at HPCAT sector 16 at Advanced Photon Source at Argonne National Laboratory, Argonne, IL, USA. In parallel geometry, measurements have been performed along one or two orthogonal diameters with steps of 10 microns with a beam size of 6 µm × 5 µm. The 2D x-ray diffraction images were converted to unrolled 1D patterns using FIT2D software35,36) and then analyzed using Rietveld refinement37,38) with GSAS II39) and MAUD software40) to obtain the crystal lattice parameters of each phase, volume fractions of high-pressure phases, textures, microstrain, dislocation density, and crystallite size in each phase. The sample thickness profile is measured with x-ray intensity absorption using the linear attenuation equation with the pressure-dependent density,13) similar to Refs. 41, 42). Pressure distribution in each phase is determined by calculating crystal cell volume and utilizing the equation of state. This was done routinely for single-phase material;41,42) we also did it during PTs for two-phase12–15) and up to four-phase materials.16) While x-ray method determines pressure averaged over the sample thickness directly in material (in contrast to the method based on measuring the shift of the R1 ruby fluorescence line utilizing ruby particles spread over the contact surface and the known pressure dependence of the R1 line10,11,27,43)), it has some problems. (i) Use of the equation of state obtained under hydrostatic loading for strongly non-hydrostatic stress state and (ii) for the axial x-ray diffraction in the DAC/RDAC (Fig. 1), crystallographic planes that are almost parallel to the beam contribute to the measured x-ray patterns only.12) The combined experimental/analytical/FEM approach in Ref. 15) suggests a way, while quite sophisticated, to resolve this problem. It solves an inverse problem and allows a determination of fields of all stress and plastic strain tensor components in the sample, friction shear stress at the sample-anvil boundary, and stresses in the anvils. Friction rules for single-phase regions and for α + ω Zr mixture were found. Approach in Ref. 15) is more advanced than that suggested previously in Ref. 44) in the sense that it does not utilize the equation of state under hydrostatic conditions. Such combined experimental/analytical/FEM or experimental/FEM approaches are the only ways to determine all the fields in the sample, including future works on strain-induced PTs, and represent the most promising direction for this goal. Independently,45) the distributions of all stress tensor components were measured in a diamond cullet near the boundary with a sample utilizing a nanoscale sensing platform integrating nitrogen-vacancy color centers. To increase accuracy and determine stress field and equivalent stress (for comparison with the theoretical strength criterion under complex loading) in the entire anvil, FEM simulations and solution of the inverse problem have also been involved.
We would like to mention that normal stress distribution at the sample-diamond boundary, especially at very high pressure, was evaluated using Raman spectra of the diamond for compression of materials in DAC46–49) and torsion in RDAC.50) However, the effect of other components of the stress tensor on the Raman signal is unknown. Averaged pressure in Ref. 51) during HPT with metallic anvils was estimated by detecting PT from Bi I to Bi II at 2.5 GPa and from Bi II to Bi III at 2.7 GPa. FEM simulations were also performed and compared with measurements.
The evolution of the volume fraction of the superhard wurtzitic BN and the concentration of turbostratic stacking faults at the center and periphery of a sample, both averaged over the sample thickness, was measured for the first time under compression and torsion of the hexagonal BN in RDAC;43,52,53) the pressure distribution was measured with ruby particles. It was found that due to large volume change during the PT under nonhydrostatic conditions, large transformation-induced plasticity (TRIP) occurs, which by a factor of 20 exceeds plastic shear due to anvil rotation. Large TRIP allowed us to explain shear banding in fullerene during the PTs despite the much stronger high-pressure phases in the bands.54) A more general concept and corresponding analytical solution for coupled self-blown-up plastic deformation-PT-TRIP-heating in a band allowed us to resolve the main puzzles in the mechanisms of the deep focus earthquake.55)
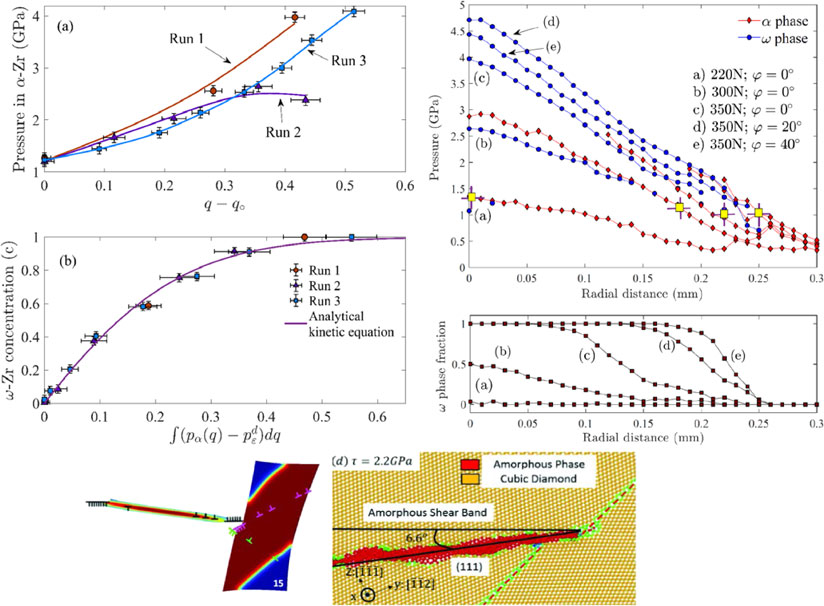
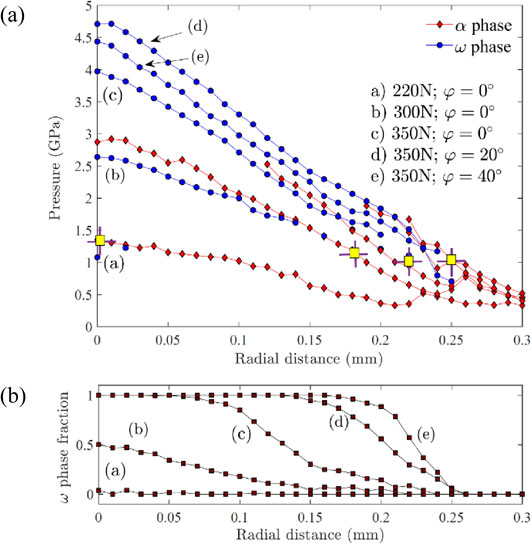
The qualitative progress was achieved in the RDAC study,12) where the full radial profile of pressure in α and ω phases of Zr and in the α + ω mixture, and volume fraction of ω-Zr, all averaged over the sample thickness, have been measured using x-ray diffraction (Fig. 2); the sample thickness profile was determined with x-ray absorption. The yield strength of α and ω phases after unloading was evaluated utilizing hardness and X-ray peak broadening, with quite close results. This method (although not strictly justified), if confirmed under high pressure, can be used to determine the pressure dependence of the yield strength of each phase in multiphase material, which cannot be achieved with other existing methods. The texture evolution was also measured, but because not all crystallographic planes contribute to the x-ray patterns in axial geometry shown in Fig. 1, the pole figures cannot be complete. Radial distributions of the crystallite size and dislocation density (along with distributions measured in Ref. 12)) were measured for the first time in Ref. 14), opening the direction of the in situ determination of the microstructure evolution under high pressure and SPD. Both papers12,14) led to several important conclusions (see Sections 4, 5, and 7).
To determine material displacements in DAC/RDAC, displacements of ruby particles spread over one56) and both13) sample-diamond contact surfaces were measured, qualitatively56) and quantitatively.13) It was demonstrated in Ref. 13) that the angle of rotation of Zr may be 5 times smaller than that of an anvil, demonstrating the inaccuracy of the shear-strain estimation based on the rotation of an anvil. Material displacements can be used as boundary conditions instead of friction stresses in FEM simulations of the processes in DAC and RDAC.20,21,57–61) Recently,14,16) DAC/RDAC with roughly-polished diamond anvils (rough-DA) have been introduced to increase contact friction to the maximum possible equal to the yield strength in shear. This allowed us to robustly determine the pressure-dependence of the yield strength and contact shear stress, intensify plastic flow, strain-induced PTs, and nanostructure evolution. Previously,62) an increase in friction for RDAC was achieved by making radial grooves on diamond culets. They, however, do not increase friction in the radial direction. Alternatively, concentric circular grooves,62) which represent a generalization of a single-groove toroidal DAC for compression,63,64) do not increase fraction in the azimuthal direction. An increase in asperities over the entire culet in Refs. 14, 16) increases friction shear stress in all directions and produces smaller stress concentrators in anvils than grooves.
RDAC with nano-polycrystalline diamond anvils65) for pressure up to 135 GPa was developed in Refs. 50, 66). An X-ray computed laminography technique48) was developed for in situ 3D observations of the Pt strain marker located along the diameter of the sample, which allowed to monitor shear strain.
4. In situ X-ray Studies with Synchrotron Radiation in Perpendicular Geometry
For x-ray studies in perpendicular geometry, also called radial diffraction,67–70) the beam passes through the gasket and the entire sample (Fig. 3(a)). Perpendicular geometry allows measurements of how the d-spacings vary with the angle between the compression and scattering direction, in contrast to parallel geometry. This allows one to determine deviatoric stresses, yield strength, and texture. The main challenge is finding a theoretical relationship for the transition from elastic strains in a single crystal to a polycrystalline sample. The first simple theory was developed in Refs. 71–74) based on the elasticity theory. It was extended by the inclusion of plastic strain in Ref. 75). The next step was implementing visco-plastic self-consistent models developed in Refs. 76, 77) and their further development, elasto-viscoplastic self-consistent model.78) They were broadly applied for high-pressure studies in DAC in perpendicular geometry of iron79) (including PTs), ultrafine-grained metals,80,81) tantalum at megabar pressure,82) tungsten carbide,83) and various geological materials.84–91) Perpendicular diffraction geometry is used by the SPD community during HPT24,25) (which we discussed in Introduction) and for the high-pressure sliding92) and compression93) (Fig. 3(b)). Averaged pressure over the sample diameter in Ti determined by X-ray diffraction during sliding was by 2.5–4 GPa lower than the load divided by thickness.92) Still, it should vary from zero to maximum pressure, and PT should start at the maximum pressure near the sample center, which an average pressure cannot characterize.

X-ray diffraction in perpendicular geometry is also used in rotational Drickamer apparatus.94–96) Ring-shaped sectored sample within very complex cell assembly is used to reduce strain and stress heterogeneity. The shear strain was estimated from X-ray image analysis of a Pt or Mo foil placed between sample sectors. Stress-strain curves and textures for pressures up to 23 GPa and temperatures up to 2150 K for various geological materials have been determined. The main problem in these types of experiments is a large error bar. Indeed, in Ref. 94) error bar for stress reaches 8 GPa for an average stress of 5–6 GPa, and the error bar in strain reaches 30% for an average strain of 50%.
The main problem with perpendicular geometry is that all parameters (pressure, volume fraction of phases, dislocation density, and crystallite size) are quite heterogeneous across the diameter and are averaged over the diameter. A small ratio of the sample diameter to the height is used to reduce heterogeneity due to contact friction in DAC. However, it increases during compression and this limits allowable plastic strain. While for diffraction in parallel geometry at fixed load, 40 to 60 local measurements are performed along the diameter, i.e., for different stress and plastic strain states, it is just one measurement for the perpendicular geometry, but for much more crystallographic planes.
5. Microscale Kinetics of Strain-Induced Phase Transformations
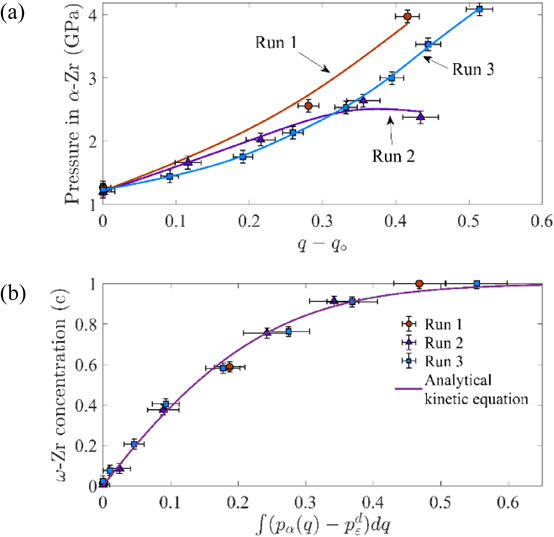
The only complete way to characterize the strain-induced PTs is to determine their kinetics.1,28,29) Such a kinetic equation was derived based on nanoscale mechanisms28,29) and took into account both direct and reverse PTs. It was generalized for multiple PTs and the presence of the non-transforming material in Ref. 97) with applications to PTs in Ge and Si. It does not include time; accumulated plastic strain q is a time-like parameter. Since plastic strain is not measured in DAC and RDAC, this kinetic equation was not verified experimentally until the appearance of paper12) on α-ω PT in ultra-pure Zr in RDAC. Since reverse strain-induced α-ω PT in Zr was not observed, a simplified kinetic equation for the volume fraction of ω-Zr looks like
| \begin{equation}
\frac{dc}{dq} = k\frac{B(1 - c)^{a}}{B(1 - c) + c}\left(\frac{p_{\alpha}(q) - p_{\varepsilon}^{d}}{p_{h}^{d} - p_{\varepsilon}^{d}} \right)\quad \text{for}\quad p_{\alpha} > p_{\varepsilon}^{d}.
\end{equation}
| (1) |
Here
$p_{\varepsilon }^{d} $ and
$p_{h}^{d}$ are the minimum pressure for direct plastic strain-induced PT and pressure-induced PT, respectively;
pα(
q) is the pressure in α-Zr -
q loading path (
Fig. 4(a));
$B = (\frac{\sigma_{y}^{\omega }}{\sigma_{y}^{\alpha }})^{w}$ includes the ratio of the yield strengths of phases;
k,
a, and
w are material parameters. While the plastic strain field is unknown, material near the symmetry axis undergoes macroscopically uniaxial compression, for which
q =
ln(
h0/
h), where
h and
h0 are the current and initial (namely, at the beginning of PT) thicknesses of a sample. Inequality
$p_{\alpha } > p_{\varepsilon }^{d}$ represents the PT criterion. Using several loading paths (
Fig. 4(a)), kinetic
equation (1) was verified and quantified for severely pre-deformed Zr (
Fig. 4(b)), with
$p_{\varepsilon }^{d} = 1.2$ GPa,
$p_{h}^{d} = 5.4$ GPa,
k = 21,
a = 1, and
B = 2.12. A strongly pre-deformed sample was produced by multiple rolling until its hardness reached a steady value and did not change under further rolling. This drastically simplifies the interpretation of experiments, see Section 5. It was also found that kinetics is independent of the pressure-plastic strain loading path and plastic deformations
q0 at pressures below the initiation of PT.
Similar results were obtained in Ref. 14) under compression of commercially pure strongly pre-deformed Zr, but with $p_{\varepsilon }^{d} = 1.36$ GPa, $p_{h}^{d} = 6.0 $ GPa, k = 11.65, a = 1, and B = 1.35. However, for the same material compressed with rough-DA, $p_{\varepsilon }^{d} = 0.67$ GPa, a = 0, and B = 1, i.e., instead of approximately first-order kinetics (a = 1 and the term B(1 − c) + c = 1.35 − 0.35c weaker dependent on c than 1 − c) one has zero-order kinetics. Thus, rough-DA change the character of plastic flow and strain-controlled PT kinetics.
More importantly, an unexpected time dependence of the kinetics of strain-induced PT at fixed plastic strain was found.14) This confronts the traditional view that strain-induced PTs do not occur without plastic strain increment and time is not an essential parameter1–3,6,27–29) and opens a new field of coupled plastic strain- and stress-induced PTs under high pressure. The characteristic time of the time-dependent part of the kinetics is 43 min, during which the volume fraction of ω-Zr grows by ∼20–30%.
6. New Laws of Coupled Strain-Induced Phase Transformations and Microstructure Evolution under SPD
Paper12) also offers the first very important rule for the minimum pressure for direct plastic strain-induced PT for strongly pre-deformed Zr. One of the global problems in studying plastic flow, strain-induced PTs, and microstructure evolution is that these processes depend, in addition to pressure, on all possible combinations of five plastic strain tensor components and an entire strain path with little hope of comprehending. It is clear from Fig. 2(a) that the minimum pressure for plastic strain-induced α-ω PT is independent of the particle radius. FEM simulations of the processes in DAC and RDAC20,21,57–61) demonstrate that for different particle positions and compression/torsion stages, plastic strain and strain path and material rotations are very different. At the center of a sample, there are no shears, and shears increase with an increasing radius for both compression and torsion. Thus, obtained results mean that the minimum pressure for plastic strain-induced PT for strongly pre-deformed Zr is independent of the plastic strain tensor and an entire strain path.
This also means that there is no advantage in the shear mode of plastic straining; any plastic straining path produces the same $p_{\varepsilon }^{d}$. Consequently, PT processes under plastic compression in DAC and torsion in RDAC are based on the same physical mechanisms and should be treated theoretically and computationally in the same way. This was assumed in Refs. 28, 29) due to lack of any information, used in kinetic equation (1), and used in all FEM simulations,20,21,57–61) but is proven in Ref. 12) for the first time. Of course, the RDAC has the strong advantage that it allows to independently control pressure-shear loading programs, particularly at constant pressure, while during compression in DAC, pressure grows with plastic straining. This is crucial for potential industrial applications.
However, it was claimed in most experiments1–3,6,17–19,24,27–29) that plastic shear reduces the PT pressure compared to plastic compression. The reason for such a contradiction is explained in Ref. 12) by comparison with experiments on annealed Zr. In this case, $p_{\varepsilon }^{d} = 2.3$ GPa at the center of a sample during compression, but at the periphery, after much larger plastic straining, $p_{\varepsilon }^{d} = 1.2$ GPa is the same as for strongly pre-deformed Zr. The conventional interpretation of these results would be that plastic shear reduces the PT pressure compared to compression. However, since it is not the case for severely pre-deformed Zr, a different interpretation was suggested. The minimum pressure for plastic strain-induced PT depends on the microstructure (grain size and dislocation density) just before the PT. After some critical preliminary plastic strain, the yield strength reaches its maximum value and does not change anymore;3,98) it was assumed that critical (steady) microstructure is achieved as well, after which $p_{\varepsilon }^{d} $ does not change during further plastic straining. During compression of annealed Zr, pressure at the center exceeds 1.2 GPa before plastic strain produces the steady microstructure, and $p_{\varepsilon }^{d} = 2.3$ GPa corresponds to the achieved microstructure. It is stated that eq. (1) must be generalized for the general (non-steady) microstructure by utilizing $p_{\varepsilon }^{d}(q)$ and $p_{h}^{d}(q)$ with q defined from the annealed state.
Paper14) significantly expands this idea by in situ measuring the pressure-dependent yield strength of ω-Zr, crystallite size, and dislocation density in α and ω-Zr. Two times lower $p_{\varepsilon }^{d}$ for α-ω PT for compression with rough-DA than with smooth-DA was related to smaller steady crystallite size and higher dislocation density in α-Zr at the initiation of the PT. The crystallite size and dislocation density in single-phase α and ω-Zr reach steady values which are pressure-, plastic strain tensor-, and strain-path-independent. The pressure-dependent yield strength of ω-Zr is also getting plastic strain tensor- and strain-path-independent. Note that the stationary states after SPD in terms of hardness, grain size, and dislocation density are well-documented, e.g., in Refs. 2, 3, 7–9, 51, 99, 100), especially after HPT; however, there are many cases where they were not found. However, these steady states were obtained postmortem after pressure release and further treatment during sample preparation for mechanical and structural studies. The direct effect of pressure was not studied previously. That is why the above results in Ref. 14) represent new rules under pressure.
The existence of three different steady states for α-Zr (after rolling and before PT during compression with smooth and rough DA), each of which is claimed to be independent of the plastic strain and strain path, is contradictory. This leads to a new key problem: for which classes of plastic strain and strain path, and maybe pressure path material remains in each of the steady states, and for which loading classes the material behavior jumps from one steady state to another? Any progress in the solution of this problem will help explain why different SPD techniques lead to different steady grain sizes and dislocation densities2) and how to design the loading process to reduce the grain size and PT pressure and increase dislocation density and strength.
One more rule is found during PT:14) crystallite size and dislocation density of ω-Zr are getting pressure-, plastic strain tensor- and strain-path-independent and are functions of ω-Zr volume fraction only for both smooth and rough-DA. Crystallite size in ω-Zr at the beginning of PT is much smaller than the steady value after completing PT. Thus, strain-induced PT is a much more effective way to reduce the grain size than solely plastic straining; it also may lead to the nanocomposite with the optimal combination of strength and ductility.
7. Atomistic and Phase-Field Studies of the Mechanism of Plastic Strain-Induced Phase Transformations
Four-scale theory and simulations, from atomistic to nano- and microscale phase field approaches to macroscale behavior of a sample in DAC/RDAC is reviewed in Ref. 1). The effectiveness of dislocation pileup to produce large stress concentrator and reduce PT by more than an order of magnitude compared to hydrostatic loading and even more than an order of magnitude below the phase equilibrium pressure was confirmed101–103) for a bicrystal with the help of the developed nanoscale phase field approach to the interaction between PTs and discrete dislocations.104–106) More advanced models for PTs107–109) that are calibrated by atomistic simulations appeared recently, which may lead to more precise results for interaction with dislocation pileups as well. However, these models resolve numerically phase interphases, which are ∼1 nm thick. Since 3–5 finite elements are required for a mesh-independent solution,110) nanosized samples can be treated only. These results were scaled up to a large single- and polycrystalline samples using developed scale-free phase field approach for PTs111–114) and then for PTs and discrete dislocation pileups115,116) (Fig. 5), which also allowed us to generate plastic shear dependent kinetic of evolution of volume fraction of the high-pressure phase and each crystallographically equivalent variant, pressure, and shear stress, all averaged over the polycrystalline sample (Fig. 6). They can be utilized for the development of microscale kinetic equation for strain-induced PT, more detailed that was derived in Refs. 28, 29) and used for the FEM simulations of the behavior of a sample.20,21,57–61)


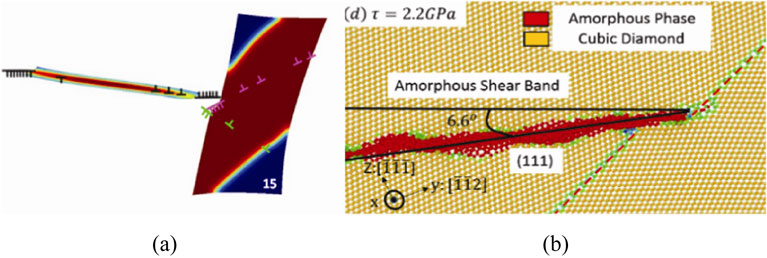
Molecular dynamic simulations have also been recently used to shed light on the interaction between dislocations and different grain boundaries in Si-I. Thus, screw shuffle dislocations pass through tilt grain boundaries117) and cannot produce pileup and cause strain-induced PT. In contrast,118) 60° shuffle dislocations pile up against Σ3, Σ9, and Σ19 grain boundaries (Fig. 7(b)) and significantly reduce shear stress required for the appearance of an amorphous band in Si-I. In contrast to analytical28,29) and nanoscale phase field approach,101–103) molecular dynamics naturally includes the Peierls resistance to the dislocation motion, which requires higher stresses to produce dislocation pileup. However, at high loading and dislocation rates, dislocations can glide well below the Peierls barrier.119) Note that the Peierls barrier is also included in the scale-free phase field approach modeling.115,116) Recently,120) 3D analytical and molecular dynamics treatments of the effect of the deviatoric stresses and dislocations on α-ω PT in Ti were suggested. While very insightful, these treatments cannot be considered a proper generalization of our 2D results for strain-induced PTs28,29,101–103,115,116) for the 3D case for the following reasons. While we consider barrierless nucleation and determine the shape of the nucleus analytically or computationally, stability of pre-existing sub- and supercritical spherical nuclei is treated in Ref. 120), without considering the nucleation process. The barrierless nucleation was not achieved in Ref. 120) because of the assumed finite distance from the dislocation pileup to the nucleus, thus eliminating singularity and the main point in our approach. Also, a small number of dislocations, up to three, could not cause a strong reduction in PT pressure observed in our experiments (see Section 8).
Coupled atomistic-continuum approaches to determine stress concentrators at the tip of dislocation pileup121) and following martensitic PT122) utilize atomistic resolution at the tip of the pileup and an obstacle (grain or phase boundary) and FEM solutions elsewhere. This allows for a significantly increased sample size while resolving critical atomistic processes. Results significantly differ from applying the linear elastic model and Eshelby solution for the dislocation pileup. Also, dislocation pileup restructures and splits into two, reducing stress concentration; however, it happens after it plays its part and causes nucleation.
Note that since the stress concentrator at the tip of dislocation pileup is proportional to the pressure-dependent shear modulus, there is a significant difference between the crystal lattice instability at the tip due to phonon or elastic instability.123) For elastic shear instability, the shear modulus tends to zero, and the stress concentrator is getting small. In contrast, the phonon instability is unrelated to the reduction in shear modulus and stress concentrator, and the reduction in PT pressure can be significantly larger.
8. Revisiting Grain-Size Dependence of the Minimum Pressure for Strain-Induced Phase Transformations
While many predictions of our analytical model on nucleation at the dislocation pileup28,29) were confirmed by the phase-field simulations,101–103,115,116) atomistic simulations,118,122) and qualitatively by experiment,19) one of the conclusions was opposite to the reality. Thus, all components of the stress tensor $\boldsymbol{\sigma}$ at the tip of the edge dislocation pileup are proportional to τl, where τ is the applied shear stress limited by the yield strength in shear τy, l is the length of the dislocation pileup, which is usually assumed to be a fraction of the grain size d (e.g., l = 0.5d). Then the greater d, the greater the stress concentration and, consequently, the drop in PT pressure. However, in experiments for α-ω PT in Zr,12) the minimum PT pressure is lower for the severely pre-deformed sample than for the annealed sample. This contradiction was eliminated in Refs. 14, 16). It follows from our phase-field,101–103) molecular dynamics,118) and concurrent atomistic-continuum simulations121,122) that most dislocations are located at the grain or phase boundary for large shear stress, making a step (superdislocation) (Fig. 7). That is why the grain size does not limit l. On the other hand, since shear stress τ = τy grows with the grain size reduction due to the Hall-Petch relationship,124) the stress concentrator grows and the minimum pressure for the strain-induced PT $p_{\varepsilon }^{d} $ reduces with decreasing grain size. This is in accordance with results for α-ω PT in Zr in Ref. 12), more detailed results in Ref. 14), and also for Si I → Si II PT.16) Note that it is well-known that for temperature-, pressure-, and stress-induced PTs, reduction in the grain size, in contrast, suppresses PT. However, for very small grain sizes, when the inverse Hall-Petch effect is valid, and grain boundary sliding competes with the formation of the dislocation pileups,124) both τy and l reduce with decreasing grain size, and PT pressure increases. The above conclusions were confirmed for Si I → Si II PT.16) Thus, one can essentially control the PT pressure for the strain-induced PTs by controlling grain size.
Note that the energy of a superdislocation is very high, and large repulsive forces equilibrated by applied shear stress lead to a significant increase in dislocation spacing after removing shear stresses and to possible absorption by the opposite side of a grain boundary. That is why postmortem observation (e.g., by TEM) of a dislocation pileup with a large number of dislocations or superdislocation at the grain boundary has low chances. Still, the novel precession electron diffraction technique shows a large dislocation density with significant localizations in nanograined materials.125)
It was shown in Ref. 126) for Y2O3, in Refs. 127, 128) for TiO2, and in Ref. 129) for ZnO, using TEM, that after HPT and PT, the recovered high-pressure phases have smaller and initial low-pressure phase larger grain sizes, respectively. Since these results are obtained ex situ after unloading, various interpretations are possible, including:
-
(a)
Reduction in grain size promotes direct PT to the high-pressure phase, small grains transform only, and there is no reverse PT.
-
(b)
Both small and large grains transformed to the high-pressure phase, but reverse PT only occurred in the large grains.
-
(c)
Grain size does not affect direct and reverse PTs; smaller grains in the high-pressure phase are due to strain-induced nucleation at the tip of dislocation pileups with limited growth because stresses quickly reduce away from the tip. Reverse PT does not occur. This was obtained in in situ experiments for PT in Zr14) by measuring the crystallite size during PT.
-
(d)
Independent of the effect of the grain size on the PT, incomplete PT occurs, and steady grain size for the high-pressure phase is smaller than that for the low-pressure phase.
-
(e)
Reduction in grain size promotes direct PT to the high-pressure phase and suppresses reverse PT.
For PT in TiO
2 in Ref.
127), using theory for pressure-induced PT, it was concluded that reduction in the grain size suppresses both direct and reverse PTs. While this is correct for pressure-induced reverse PT, this is not applicable for strain-induced direct PT. For PT in Y
2O
3 in Ref.
126), the high-pressure phase was formed at 6 GPa during HPT instead of 11–16 GPa under hydrostatic conditions. That is why our theory for strain-induced PT at dislocation pileup
60) and some of its experimental confirmations
18,27,130) were applied. The reasoning was that dislocation pileup produces internal pressure that promotes and stabilizes the high-pressure phase, and small grain size increases the number of grain boundaries, which are obstacles leading to dislocation pileups. This is correct; however, existing at that time theory
28,29) claimed that smaller grain size leads to a shorter length of dislocation and smaller stresses, which should suppress PT. The new theory in Refs.
14,
16) resolved this contradiction and supports that for strain-induced PTs, reduction of the grain size in the range of validity of the direct Hall-Petch effect promotes PT to the high-pressure phase. However, the reverse PT during pressure release is not accompanied by essential plastic strain and is pressure- or stress-induced. For such PTs, a reduction in the grain size suppresses any PT. Thus, option (e) seems to be consistent with the theory, but this is not the only option. Since there are no
in situ data, option (d) also cannot be excluded. The above analysis underlines the difficulties in interpreting
ex situ experiments and the importance of
in situ studies.
In Ref. 131), the increasing volume fraction of the ω-Ti curve versus grain size is found, with the absence of PT below some grain size. This contradicts our results that a reduction in grain size reduces the PT pressure and promotes strain-induced PT. The problem is that in Ref. 131) grain size is measured after PT and as a result of PT and SPD. Based on results for Zr,14) during plastic straining and PT, the grain size in ω-Zr is a growing function of the volume fraction of ω-Zr (see Section 6), which is independent of plastic strain, strain path, and pressure. Thus, PT and volume fraction of the high-pressure phase determine the grain size instead of vice versa.
9. Plastic Strain-Induced Reduction of Phase Transformation Pressure
Below we review the first in situ results in DAC and RDAC on drastic PT pressure reduction in Zr, Si, graphite, and BN.
(a) α-ω PT in strongly pre-deformed Zr.14) The smallest PT pressure for plastic strain-induced PT in Zr was obtained for strongly pre-deformed commercially pure Zr compressed with rough-DA. The α-ω PT starts at 0.67 GPa versus 6.0 GPa under hydrostatic loading. Thus, PT pressure is reduced by a factor of 9 compared to PT pressure under hydrostatic conditions and by a factor of 5 versus the phase equilibrium pressure of 3.4 GPa.
Note that at HPT, the reported minimum PT pressure is 1 GPa under compression132) and 0.25 GPa under five turns.133) However, the pressure was determined as an applied force divided by total area, which, based on our FEM simulations, may be smaller than the maximum pressure in a sample by a factor of 3 or larger.57,58) Also, in Ref. 133) β-Zr was claimed at 0.5 GPa and five turns, reducing PT pressure compared to the hydrostatic loading by a factor of 60. However, for the same Zr, we did not observe in Ref. 12) in situ the PT to β-Zr even at 13 GPa and rotation of 200°, which is consistent with phonon instability in β-Zr below 25 GPa.134)
It was found in Refs. 27, 30) with HPT that direct and reverse α-ω PT occur at the same pressure in the range of 2–2.5 GPa, which was claimed to be the phase equilibrium pressure. However, as it has been demonstrated in Refs. 28, 29), the direct and reverse strain-induced PTs may occur at the same pressure in a broad range, which is unrelated to the phase equilibrium pressure. Also, we did not observe reverse ω → α PT even at 0.2 GPa at the sample periphery at a rotation of 180° and after complete unloading.12)
(b) PTs in Si.16) Numerous strain-induced PTs between Si phases were studied in Ref. 16) for micron, 100 nm, and 30 nm particles. We mention just a few of them. For 100 nm Si, plastic-strain induced Si-I → Si-II PT was observed at 0.4 GPa. This is by a factor of 40.5 lower than the PT pressure of 16.2 GPa under hydrostatic conditions and 26.3 times smaller than the phase equilibrium pressure of 10.5 GPa. Si-III does not appear under hydrostatic loading (it is observed after pressure release starting with Si-II or Si-XI or Si-V or their mixtures only) but was obtained at 0.6 GPa at small torsion, demonstrating an infinite reduction in PT pressure. Si-II was retrieved at ambient pressure for the first time after its strain-induced appearance at low pressure for 100 nm particles and from Si-V at 13 GPa for 30 nm particles. If a large enough amount of Si-II is retrieved, its physical properties can be studied with traditional postmortem methods. The reverse Si-II → Si-I PT was also observed for the first time; usually, Si-II transforms to Si-III + Si-XII at slow unloading. Obtained results have various other potential practical applications.16)
Thus, drastic reduction in PT pressures due to plastic straining and its nontrivial dependence on the particle size, as well as change in PT paths, open new direction in developing the scientific foundation for new plastic strain- and defect-induced synthesis and retrieving the desired nanostructured pure phases or nanocomposites with optimal properties. Due to multiple PTs and obtained results, Si is an ideal model material for this goal. In particular, obtaining pure Si-III requires ∼10 GPa, ∼1000 K, and multi-hour or days quenching135) or 2 compression/slow (within 4 hours) decompression cycles to 13 GPa and room temperature.136) This led to the discovery that Si-III is a narrow-gap semiconductor (rather than a semimetal) with the potential for infrared plasmonic applications.137) Previously, HPT of Si at 24 GPa and ten turns was used to produce nanostructured metastable Si-III and Si-XII phases.138,139) We obtained nanostructured Si-III at 0.6 GPa, room temperature, and anvil rotation of 5° during minutes, and various synthetic compression-torsion-unloading paths can be developed to retain pure Si-III at ambient pressure. Observed very low PT pressures warn that some PTs may occur, e.g., in NEMS/MEMS, during contact interactions and friction, and should be taken into account or/and avoided. Obtained results may be implemented for quantitative modeling and optimization of surface processing, like turning and polishing and developing regimes of ductile machining by utilizing PT to ductile (Si-II and amorphous Si) phases.140,141)
Note that in RDAC but without in situ X-ray diffraction,27,142) Si-I → Si-III → Si-II sequence is claimed; later,143) with TEM, it was corrected that Si-I → Si-IV → Si-III occur at 3–4 GPa and Si-I → Si-III → S-II at higher pressure. These claims contradict our in situ results in Ref. 16). Review of recent ex situ studies of semiconductors by HPT is given in Ref. 144).
(c) PTs in BN. It was surprisingly found in Refs. 43, 52, 53), that PT pressure from the hexagonal to superhard wurtzitic BN is approximately the same, ∼10 GPa, under hydrostatic loading and compression and shear in RDAC. This was rationalized in the following way. Martensitic PTs in layered graphite-like structures are strongly suppressed by increasing concentration of the turbostratic stacking faults (degree of two-dimensional disordering). During SPD, the concentration of the turbostratic stacking faults significantly grows, suppressing the PT. This suppression effect appears to be fully compensated by traditional plastic strain-induced promotion of PTs, leading to the same PT pressure as under hydrostatic pressure. Compression of the highly ordered and textured rhombohedral BN along the c axis led to mechanical instability and its dynamic transformation to the superhard cubic BN145) at 5.6 GPa; under hydrostatic pressure, this transformation occurred at 55 GPa only. This was described theoretically by a new phenomenon, PT induced by rotational plastic instability. Highly disordered hexagonal BN was transformed to the wurtzitic BN under large shear in RDAC at 6.7 GPa but not under hydrostatic pressure up to 52.8 GPa.130) This was rationalized in terms of the reconstructive PT mechanism and shear-transformation zone mechanism of plastic flow of disordered materials.
(d) PTs in carbon. In the experiment, under quasi-hydrostatic compression, graphite transforms to diamonds at ∼70 GPa;146) under shear in RDAC at ∼20 GPa.27) Atomistic simulations19) for the perfect graphite under hydrostatic loading show loss of lattice stability and PT to a cubic diamond at 250 GPa; for uniaxial compression along the graphite [0001] direction with the absent lateral strains, the PT starts at 52 GPa. Superposing shear stress of 6–8 GPa further reduces PT pressure down to 17–26 GPa; increasing temperature from 0 to 300 K results in transformation at 15 GPa. The calculated PT start pressures under shear are consistent with experimental values in Ref. 27). However, our analytical estimates28,29) and phase field simulations102,103) of the PT at the tip of dislocation pileup show that the applied pressure can be reduced lower than the phase equilibrium pressure and even to zero pressure. This motivated RDAC experiments at very low pressure in Ref. 19), leading to hexagonal and cubic diamonds appearing at 0.4 GPa and 0.7 GPa, respectively. This is the record reduction in PT pressure due to plastic straining by a factor of 50 and 100, respectively. The cubic diamond was retrieved at ambient pressure, but the hexagonal diamond was not. Also, pressure growth to 3 GPa during torsion led to the appearance of a new orthorhombic diamond. The retrieved samples contain cubic and orthorhombic diamonds, fullerenes, amorphous phase, and fragmented graphite. Obtained results, if scaled up and reaching repeatability, may serve as a precursor of new low-pressure technology of diamond synthesis at room temperature and without a catalyst. They also suggest a new mechanism of microdiamond appearance in the Earth’s crust at low pressure and temperature.19) Note that PTs in few-layer graphene in RDAC were reported in Ref. 147).
With HPT, a diamond-like structure with an essential fraction of sp3 bonds was obtained at 6 and 20 GPa after 50 turns.148) The possible reason (in addition to possible purity of graphite) why diamonds in Ref. 19) have been obtained at sub-GPa and relatively small shear and other works could not receive diamonds at 20 GPa and 50 turns148) or could receive diamond at 20 GPa and large shear only27) is the following. While not reported, the initial particle size in Ref. 19) may be at the nanoscale, with a shape close to the spherical (instead of flakes) and with a low concentration of the turbostratic stacking faults. The stochastic orientation of spherical particles does not allow easy sliding along the weak (0001) plane and, along with small particle size, leads to high shear stresses. Small particle size promotes strain-induced PTs (like for Zr12,14) and Si16)), and low concentration of the turbostratic stacking faults does the same. A relatively small plastic shear does not significantly increase the turbostratic stacking faults’ concentration. High PT pressure for obtaining diamond in Ref. 27) or absence of diamonds in Ref. 148) could be explained by large initial grain size and/or high concentration of the turbostratic stacking faults. Even for a small initial concentration of the turbostratic stacking faults, large plastic straining (while reducing particle size) significantly increases it, suppressing PT. Of course, more detailed experiments based on the current understanding are required to resolve the issues and to obtain a large volume fraction of diamonds.
Note that for nanoparticles and nanograined materials, the effect of change in surface or grain boundary energy during the PT may play a crucial role in reducing PT pressure and phase selection, e.g., for multiple Si,16) carbon,19) and fullerene54) phases. Phase field approach to surface-induced PTs149,150) combined with mechanics for melting151,152) and martensitic PTs153,154) revealed many interesting effects and phenomena. Similar works were performed for the void155) and grain boundary.156,157) An interesting effect of the ratio of two scale parameters on various surface- and interface-induced phenomena is reviewed in Ref. 158). Large transformation strains, typical for PTs in Si, graphite, and BN, may lead to very non-traditional nanostructures159) and change the microstructure formation principles. However, none of these works includes plasticity, which is required for application to strain-induced PTs.
10. Concluding Remarks
Recent years brought breakthrough new opportunities in (a) in situ experimental studies of coupled SPD, strain-induced PTs, and microstructure evolution under high pressure utilizing DAC and RDAC, (b) their four-scale modeling and simulations, and (c) coupling experimental and computational efforts. It became clear that the study of strain-induced PTs is impossible without coupling it to the simultaneous evolution of the microstructure in terms of grain/crystallite size and dislocation density. That is why this study is significantly simplified when steady states for microstructure and pressure-dependent yield strength are reached before the initiation of strain-induced PTs.12,14) It was found that (a) crystallite size and dislocation density in both phases in a single phase state, the minimum pressure for the strain-induced α-ω PT in Zr, and the pressure-dependent yield strength of ω-Zr are independent of plastic strain tensor and strain path; (b) crystallite size and dislocation density in a single phase ω-Zr are also independent of pressure; (c) crystallite size and dislocation density in ω-Zr and (with some outliners) α-Zr during PT are independent of pressure, plastic strain tensor, and strain path and depend on the volume fraction of the high-pressure phase only. It was also found for Zr12,14) and Si16) that there is a correlation between the direct and inverse Hall-Petch effect of the grain/crystallite size on the yield strength and on the minimum pressure for the strain-induced PT, with corresponding theoretical justification. Then the factors and mechanisms that affect the steady grain size160) are important for the controlling of strain-induced PTs. These results change the general wisdom that plastic shear is responsible for reducing PT pressure; in fact, any mode of straining and strain path, which belong to some classes, leads to the same PT pressure and steady microstructure. It also leads to the key problem: for which classes of plastic strain and strain path, and maybe pressure path material remains in each of the steady states, and for which loading classes the material behavior jumps from one steady state to another? This problem is just a translation into the language of plasticity theory of known technological problem: why different SPD technologies lead to different steady microstructures and how to design the loading process to reduce the grain size and PT pressure and increase dislocation density and strength. It is also shown in Refs. 12, 14) that incomplete PT is a much more effective way to reduce the grain size to produce nanocomposite materials with controllable strength and ductility than SPD alone. In addition, SPD under normal pressure, e.g., by rolling, leading to one of the steady states followed by compression or HPT at relatively low pressure, is a more economical way to produce nanostructured high-pressure phases than HPT of annealed materials. The possibility of manipulating synthetic paths may lead to new economic technologies of the defect(strain)-induced material synthesis at relatively low pressures, room temperature, and without catalysts, e.g., for cubic and hexagonal diamond, cubic and wurtzitic BN, Si III, etc. Application of ultra-SPD161) may lead to new discoveries in strain-induced PTs. Still, this field is in its infancy; one needs to find whether the above results are valid for other materials and material classes and to find a much more detailed theoretical description at each of the four scales.
Acknowledgments
This work was written with support from NSF (CMMI-1943710, DMR-1904830, and XSEDE MSS170015) and Iowa State University (Vance Coffman Faculty Chair Professorship). The experimental part of this work is performed at HPCAT (Sector 16), Advanced Photon Source (APS), Argonne National Laboratory. HPCAT operations are supported by DOE-NNSA’s Office of Experimental Science. The Advanced Photon Source is a U.S. Department of Energy (DOE) Office of Science User Facility operated for the DOE Office of Science by Argonne National Laboratory under Contract No. DE-AC02-06CH11357. The author greatly appreciates and enjoyed collaborating with all his coauthors of papers cited here.
REFERENCES
- 1) V.I. Levitas: Mater. Trans. 60 (2019) 1294–1301. doi:10.2320/matertrans.MF201923
- 2) K. Edalati et al.: Mater. Res. Lett. 10 (2022) 163–256. doi:10.1080/21663831.2022.2029779
- 3) K. Edalati and Z. Horita: Mater. Sci. Eng. A 652 (2016) 325–352. doi:10.1016/j.msea.2015.11.074
- 4) V.I. Levitas: J. Phys. Condens. Matter 30 (2018) 163001. doi:10.1088/1361-648X/aab4b0
- 5) V.I. Levitas: Int. J. Plast. 140 (2021) 102914. doi:10.1016/j.ijplas.2020.102914
- 6) P.W. Bridgman: Phys. Rev. 48 (1935) 825–847. doi:10.1103/PhysRev.48.825
- 7) I.A. Ovid’Ko, R.Z. Valiev and Y.T. Zhu: Prog. Mater. Sci. 94 (2018) 462–540. doi:10.1016/j.pmatsci.2018.02.002
- 8) R.Z. Valiev, Y. Estrin, Z. Horita, T.G. Langdon, M.J. Zehetbauer and Y. Zhu: JOM 68 (2016) 1216–1226. doi:10.1007/s11837-016-1820-6
- 9) R.Z. Valiev, R.K. Islamgaliev and I.V. Alexandrov: Prog. Mater. Sci. 45 (2000) 103–189. doi:10.1016/S0079-6425(99)00007-9
- 10) N.V. Novikov, S.B. Polotnyak, L.K. Shvedov and V.I. Levitas: J. Superhard Mater. 21 (1999) 36–48.
- 11) N.B. Novikov, L.K. Shvedov, Y.N. Krivosheya and V.I. Levitas: J. Superhard Mater. 37 (2015) 1–7. doi:10.3103/S1063457615010013
- 12) K.K. Pandey and V.I. Levitas: Acta Mater. 196 (2020) 338–346. doi:10.1016/j.actamat.2020.06.015
- 13) K.K. Pandey and V.I. Levitas: J. Appl. Phys. 129 (2021) 115901. doi:10.1063/5.0044030
- 14) F. Lin, V.I. Levitas, K.K. Pandey, S. Yesudhas and C. Park: Research Square, https://doi.org/10.21203/rs.3.rs-1998605/v1.
- 15) V.I. Levitas, A. Dhar and K.K. Pandey: arXiv:2212.13000 https://doi.org/10.48550/arXiv.2212.13000.
- 16) S. Yesudhas, V.I. Levitas, F. Lin, K.K. Pandey and J. Smith: arXiv:2303.04407 https://arxiv.org/abs/2303.04407.
- 17) Y. Ma, E. Selvi, V.I. Levitas and J. Hashemi: J. Phys. Condens. Matter 18 (2006) S1075–S1082. doi:10.1088/0953-8984/18/25/S14
- 18) V.I. Levitas, Y. Ma, E. Selvi, J. Wu and J. Patten: Phys. Rev. B 85 (2012) 054114. doi:10.1103/PhysRevB.85.054114
- 19) Y. Gao, Y. Ma, Q. An, V.I. Levitas, Y. Zhang, B. Feng, J. Chaudhuri and W.A. Goddard, III: Carbon 146 (2019) 364–368. doi:10.1016/j.carbon.2019.02.012
- 20) B. Feng, O.M. Zarechnyy and V.I. Levitas: J. Appl. Phys. 113 (2013) 173514. doi:10.1063/1.4803851
- 21) B. Feng, V.I. Levitas and O.M. Zarechnyy: Comput. Mater. Sci. 84 (2014) 404–416. doi:10.1016/j.commatsci.2013.11.058
- 22) S. Anzellini, M.T. Wharmby, F. Miozzi, A. Kleppe, D. Daisenberger and H. Wilhelm: Sci. Rep. 9 (2019) 15537. doi:10.1038/s41598-019-51931-1
- 23) K. Edalati, Z. Horita, S. Yagi and E. Matsubara: Mater. Sci. Eng. A 523 (2009) 277–281. doi:10.1016/j.msea.2009.07.029
- 24) A. Kilmametov, G. Vaughan, A. Yavari, A. LeMoulec, W. Botta and R. Valiev: Mater. Sci. Eng. A 503 (2009) 10–13. doi:10.1016/j.msea.2008.11.023
- 25) M.B. Kerber, F. Spieckermann, R. Schuster, C. von Baeckmann, T. Fischer, N. Schell, T. Waitz and E. Schafler: Adv. Eng. Mater. 23 (2021) 2100159. doi:10.1002/adem.202100159
- 26) K.K. Pandey, V.I. Levitas, C. Park and G. Shen: arXiv:2301.10475 https://arxiv.org/abs/2301.10475.
- 27) V.D. Blank and E.I. Estrin: Phase Transitions in Solids under High Pressure, (CRC Press, New York, 2014).
- 28) V.I. Levitas: Continuum mechanical fundamentals of mechanochemistry. High Pressure Surface Science and Engineering, section 3, ed. by Y. Gogotsi and V. Domnich, (Inst. of Physics, Bristol, 2004) pp. 159–292.
- 29) V.I. Levitas: Phys. Rev. B 70 (2004) 184118. doi:10.1103/PhysRevB.70.184118
- 30) V.A. Zilbershtein, N.P. Chistotina, A.A. Zharov, N.S. Grishina and E.I. Estrin: Fiz. Met. Metalloved. 39 (1975) 445–447.
- 31) V.I. Levitas, H. Chen and L. Xiong: Phys. Rev. Lett. 118 (2017) 025701. doi:10.1103/PhysRevLett.118.025701
- 32) V.I. Levitas, H. Chen and L. Xiong: Phys. Rev. B 96 (2017) 054118. doi:10.1103/PhysRevB.96.054118
- 33) N.A. Zarkevich, H. Chen, V.I. Levitas and D.D. Johnson: Phys. Rev. Lett. 121 (2018) 165701. doi:10.1103/PhysRevLett.121.165701
- 34) H. Chen, N.A. Zarkevich, V.I. Levitas, D.D. Johnson and X. Zhang: npj Comput. Mater. 6 (2020) 115. doi:10.1038/s41524-020-00382-8
- 35) A.P. Hammersley: Fit2d: An introduction and overview, in ESRF internal report, ESRF97HA02t, (Institute of Physics, Bristol, 1997).
- 36) A.P. Hammersley, S.O. Svensson, M. Hanfland, A.N. Fitch and D. Hausermann: High Press. Res. 14 (1996) 235–248. doi:10.1080/08957959608201408
- 37) H.M. Rietveld: J. Appl. Crystallogr. 2 (1969) 65–71. doi:10.1107/S0021889869006558
- 38) R.A. Young: The Rietveld Method, International Union of Crystallography, (Oxford University Press, 1993).
- 39) B.H. Toby and R.B.V. Dreele: J. Appl. Crystallogr. 46 (2013) 544–549. doi:10.1107/S0021889813003531
- 40) M. Ferrari and L. Lutterotti: J. Appl. Phys. 76 (1994) 7246–7255. doi:10.1063/1.358006
- 41) R.J. Hemley, H.K. Mao, G.Y. Shen, J. Badro, P. Gillet, M. Hanfland and D. Hausermann: Science 276 (1997) 1242–1245. doi:10.1126/science.276.5316.1242
- 42) B. Li, C. Ji, W. Yang, J. Wang, K. Yang, R. Xu, W. Liu, Z. Cai, J. Chen and H.-K. Mao: Proc. Natl. Acad. Sci. USA 115 (2018) 1713–1717. doi:10.1073/pnas.1721425115
- 43) V.I. Levitas, Y. Ma, J. Hashemi, M. Holtz and N. Guven: J. Chem. Phys. 125 (2006) 044507. doi:10.1063/1.2208353
- 44) V.I. Levitas, M. Kamrani and B. Feng: npj Comput. Mater. 5 (2019) 94. doi:10.1038/s41524-019-0234-8
- 45) S. Hsieh et al.: Science 366 (2019) 1349–1354. doi:10.1126/science.aaw4352
- 46) M. Popov: J. Appl. Phys. 95 (2004) 5509–5514. doi:10.1063/1.1712018
- 47) Y. Akahama and H. Kawamura: J. Appl. Phys. 96 (2004) 3748–3751. doi:10.1063/1.1778482
- 48) R. Nomura and K. Uesugi: Rev. Sci. Instrum. 87 (2016) 046105. doi:10.1063/1.4948315
- 49) Y. Akahama and H. Kawamura: J. Appl. Phys. 100 (2006) 043516. doi:10.1063/1.2335683
- 50) M. Popov, V. Mordkovich, S. Perfilov, A. Kirichenko, B. Kulnitskiy, I. Perezhogin and V. Blank: Carbon 76 (2014) 250–256. doi:10.1016/j.carbon.2014.04.075
- 51) K. Edalati, D.J. Lee, T. Nagaoka, M. Arita, H.S. Kim, Z. Horita and R. Pippan: Mater. Trans. 57 (2016) 533–538. doi:10.2320/matertrans.M2015374
- 52) V.I. Levitas, J. Hashemi and Y. Ma: Europhys. Lett. 68 (2004) 550–556. doi:10.1209/epl/i2004-10235-1
- 53) V.I. Levitas, Y.Z. Ma and J. Hashemi: Appl. Phys. Lett. 86 (2005) 071912. doi:10.1063/1.1866226
- 54) B.A. Kulnitskiy, V.D. Blank, V.I. Levitas, I.A. Perezhogin, M. Yu Popov, A.N. Kirichenko and E.V. Tyukalova: Mater. Res. Express 3 (2016) 045601. doi:10.1088/2053-1591/3/4/045601
- 55) V.I. Levitas: Nat. Commun. 13 (2022) 6291. doi:10.1038/s41467-022-33802-y
- 56) V.D. Blank and S.G. Buga: Instrum. Exp. Tech. 36 (1993) 149–157.
- 57) B. Feng and V.I. Levitas: Mater. Sci. Eng. A 680 (2017) 130–140. doi:10.1016/j.msea.2016.10.082
- 58) B. Feng, V.I. Levitas and M. Kamrani: Mater. Sci. Eng. A 731 (2018) 623–633. doi:10.1016/j.msea.2018.06.061
- 59) V.I. Levitas and O.M. Zarechnyy: Phys. Rev. B 82 (2010) 174123. doi:10.1103/PhysRevB.82.174123
- 60) V.I. Levitas and O.M. Zarechnyy: Phys. Rev. B 82 (2010) 174124. doi:10.1103/PhysRevB.82.174124
- 61) B. Feng, V.I. Levitas and W. Li: Int. J. Plast. 113 (2019) 236–254. doi:10.1016/j.ijplas.2018.10.004
- 62) S. Azuma, R. Nomura, K. Uesugi, Y. Nakashima, Y. Kojima, S. Doi and S. Kakizawa: High Press. Res. 38 (2018) 23–31. doi:10.1080/08957959.2017.1396327
- 63) Z. Jenei, E.F. O’Bannon, S.T. Weir, H. Cynn, M.J. Lipp and W.J. Evans: Nat. Commun. 9 (2018) 3563. doi:10.1038/s41467-018-06071-x
- 64) A. Dewaele, P. Loubeyre, F. Occelli, O. Marie and M. Mezouar: Nat. Commun. 9 (2018) 2913. doi:10.1038/s41467-018-05294-2
- 65) T. Irifune, A. Kurio, S. Sakamoto, T. Inoue and H. Sumiya: Nature 421 (2003) 599. doi:10.1038/421599b
- 66) Y. Park, S. Azuma, K. Okazaki, K. Uesugi, M. Yasutake, Y. Nishihara and R. Nomura: Geophysical Research Letters 49 (2022) e2022GL100178. doi:10.1029/2022GL100178
- 67) S. Merkel: Radial diffraction in the diamond anvil cell: Methods and applications. in High-Pressure Crystallography: From Fundamental Phenomena to Technological Applications, ed. by E. Boldyreva and P. Dera, (Springer Science, Dordrecht, The Netherlands, 2010) pp. 111–122.
- 68) H.P. Liermann, S. Merkel, L. Miyagi, H.R. Wenk, G. Shen, H. Cynn and W.J. Evans: Rev. Sci. Instrum. 80 (2009) 104501. doi:10.1063/1.3236365
- 69) S. Merkel: J. Phys. Condens. Matter 18 (2006) S949–S962. doi:10.1088/0953-8984/18/25/S03
- 70) J. Immoor, H. Marquardt, L. Miyagi, I. Kupenko, V. Cerantola and L. Dubrovinsky: Rev. Sci. Instrum. 91 (2020) 045121. doi:10.1063/1.5143293
- 71) A.K. Singh: J. Appl. Phys. 73 (1993) 4278–4286. doi:10.1063/1.352809
- 72) A.K. Singh and C. Balasingh: J. Appl. Phys. 75 (1994) 4956–4962. doi:10.1063/1.355786
- 73) A.K. Singh, J. Hu, J. Shu, H.K. Mao and R.J. Hemley: J. Phys. Conf. Ser. 377 (2012) 012008. doi:10.1088/1742-6596/377/1/012008
- 74) A.K. Singh, H.K. Mao, J. Shu and R.J. Hemley: Phys. Rev. Lett. 80 (1998) 2157–2160. doi:10.1103/PhysRevLett.80.2157
- 75) S. Karato: Phys. Rev. B 79 (2009) 214106. doi:10.1103/PhysRevB.79.214106
- 76) R.A. Lebensohn and C.N. Tomé: Acta Metall. Mater. 41 (1993) 2611–2624. doi:10.1016/0956-7151(93)90130-K
- 77) R.A. Lebensohn, C.N. Tomé and P.P. Castaneda: Philos. Mag. 87 (2007) 4287–4322. doi:10.1080/14786430701432619
- 78) H. Wang, P.D. Wu, C.N. Tomé and Y. Huang: J. Mechan. Phys. Solids 58 (2010) 594–612. doi:10.1016/j.jmps.2010.01.004
- 79) S. Merkel, H.P. Liermann, L. Miyagi and H.R. Wenk: Acta Mater. 61 (2013) 5144–5151. doi:10.1016/j.actamat.2013.04.068
- 80) B. Chen, K. Lutker, S.V. Raju, J. Yan, J. Kanitpanyacharoen, J. Lei, S. Yang, H.R. Wenk, H.K. Mao and Q. Williams: Science 338 (2012) 1448–1451. doi:10.1126/science.1228211
- 81) X. Zhou et al.: Nature 579 (2020) 67–72. doi:10.1038/s41586-020-2036-z
- 82) C. Perreault, L.Q. Huston, K. Burrage, S.C. Couper, L. Miyagi, E.K. Moss, J.S. Pigott, J.S. Smith, N. Velisavljevic, Y. Vohra and B.T. Sturtevant: J. Appl. Phys. 131 (2022) 015905. doi:10.1063/5.0073228
- 83) B.L. Brugman, F. Lin, M. Lv, C. Kenney-Benson, D. Popov, L. Miyagi and S.M. Dorfman: Acta Mater. 220 (2021) 117301. doi:10.1016/j.actamat.2021.117301
- 84) F. Lin, S. Couper, M. Jugle and L. Miyagi: Minerals 9 (2019) 650. doi:10.3390/min9110650
- 85) X. Zhou, L. Chen, M. Yuan, F. Lin, T. Ye, F. Zhao, M. Kunz and L. Miyagi: Phys. Rev. B 105 (2022) L220101. doi:10.1103/PhysRevB.105.L220101
- 86) J. Immoor, L. Miyagi, H.-P. Liermann, S. Speziale, K. Schulze, J. Buchen, A. Kurnosov and H. Marquardt: Nature 603 (2022) 276–279. doi:10.1038/s41586-021-04378-2
- 87) S. Merkel, A. Kubo, L. Miyagi, S. Speziale, T.S. Duffy, H.K. Mao and H.R. Wenk: Science 311 (2006) 644–646. doi:10.1126/science.1121808
- 88) C.E. Vennari, F. Lin, M. Kunz, Y. Meng and D. Zhang: Am. Mineral. 1062 (2021) 1045–1105.
- 89) F. Lin, M. Giannetta, M. Jugle, S. Couper, B. Dunleavy and L. Miyagi: Minerals 9 (2019) 679. doi:10.3390/min9110679
- 90) F. Lin, N. Hilairet, P. Raterron, A. Addad, J. Immoor, H. Marquardt, C.N. Tomé, L. Miyagi and S. Merkel: J. Appl. Phys. 122 (2017) 205902. doi:10.1063/1.4999951
- 91) S Merkel, H.R. Wenk, J. Shu, G. Shen, P. Gillet, H. Mao and R.J. Hemley: J. Geophys. Res. 107 (2002) 3-1–3-17. doi:10.1029/2001JB000920
- 92) Z. Horita, D. Maruno, Y. Ikeda, T. Masuda, Y. Tang, M. Arita, Y. Higo, Y. Tange and Y. Ohishi: Mater. Trans. 62 (2021) 167–176. doi:10.2320/matertrans.MT-M2020314
- 93) Z. Horita, Y. Tang, T. Masuda, K. Edalati and Y. Higo: Mater. Trans. 64 (2023) 1585–1590. doi:10.2320/matertrans.MT-MF2022036
- 94) J. Girard, G. Amulele, R. Farla, A. Mohiuddin and S. Karato: Science 351 (2016) 144–147. doi:10.1126/science.aad3113
- 95) Y. Nishihara, D. Tinker, T. Kawazoe, Y. Xu, Z. Jing, K.N. Matsukage and S.-I. Karato: Phys. Earth Planet. Inter. 170 (2008) 156–169. doi:10.1016/j.pepi.2008.03.003
- 96) L. Miyagi, G. Amulele, K. Otsuka, Z. Du, R. Farla and S.-I. Karato: Phys. Earth Planet. Inter. 228 (2014) 244–253. doi:10.1016/j.pepi.2013.09.012
- 97) V.I. Levitas and O.M. Zarechnyy: J. Phys. Chem. B 110 (2006) 16035–16046. doi:10.1021/jp061795k
- 98) V.I. Levitas: Large Deformation of Materials with Complex Rheological Properties at Normal and High Pressure, (Nova Science, New York, 1996).
- 99) R. Pippan, S. Scheriau, A. Taylor, M. Hafok, A. Hohenwarter and A. Bachmaier: Annu. Rev. Mater. Res. 40 (2010) 319–343. doi:10.1146/annurev-matsci-070909-104445
- 100) K. Edalati and Z. Horita: Mater. Trans. 51 (2010) 1051–1054. doi:10.2320/matertrans.M2009431
- 101) V.I. Levitas and M. Javanbakht: Nanoscale 6 (2014) 162–166. doi:10.1039/C3NR05044K
- 102) M. Javanbakht and V.I. Levitas: Phys. Rev. B 94 (2016) 214104. doi:10.1103/PhysRevB.94.214104
- 103) M. Javanbakht and V.I. Levitas: J. Mater. Sci. 53 (2018) 13343–13363. doi:10.1007/s10853-018-2175-x
- 104) V.I. Levitas and M. Javanbakht: Appl. Phys. Lett. 102 (2013) 251904. doi:10.1063/1.4812488
- 105) V.I. Levitas and M. Javanbakht: J. Mechan. Phys. Solids 82 (2015) 287–319. doi:10.1016/j.jmps.2015.05.005
- 106) V.I. Levitas and M. Javanbakht: J. Mechan. Phys. Solids 82 (2015) 164–185. doi:10.1016/j.jmps.2015.05.006
- 107) V.I. Levitas: Int. J. Plast. 106 (2018) 164–185. doi:10.1016/j.ijplas.2018.03.007
- 108) H. Babaei and V.I. Levitas: Int. J. Plast. 107 (2018) 223–245. doi:10.1016/j.ijplas.2018.04.006
- 109) H. Babaei and V.I. Levitas: Acta Mater. 177 (2019) 178–186. doi:10.1016/j.actamat.2019.07.021
- 110) V.I. Levitas and M. Javanbakht: Int. J. Mater. Res. 102 (2011) 652–665. doi:10.3139/146.110529
- 111) V.I. Levitas, A.V. Idesman and D.L. Preston: Phys. Rev. Lett. 93 (2004) 105701. doi:10.1103/PhysRevLett.93.105701
- 112) S.E. Esfahani, I. Ghamarian, V.I. Levitas and P.C. Collins: Int. J. Solids Struct. 146 (2018) 80–96. doi:10.1016/j.ijsolstr.2018.03.022
- 113) H. Babaei and V.I. Levitas: J. Mechan. Phys. Solids 144 (2020) 104114. doi:10.1016/j.jmps.2020.104114
- 114) H. Babaei, R. Pratoori and V.I. Levitas: Acta Mater. 254 (2023) 118996. doi:10.1016/j.actamat.2023.118996
- 115) V.I. Levitas, S.E. Esfahani and I. Ghamarian: Phys. Rev. Lett. 121 (2018) 205701. doi:10.1103/PhysRevLett.121.205701
- 116) S.E. Esfahani, I. Ghamarian and V.I. Levitas: Acta Mater. 196 (2020) 430–443. doi:10.1016/j.actamat.2020.06.059
- 117) H. Chen, V.I. Levitas and L. Xiong: Comput. Mater. Sci. 157 (2019) 132–135. doi:10.1016/j.commatsci.2018.10.024
- 118) H. Chen, V.I. Levitas and L. Xiong: Acta Mater. 179 (2019) 287–295. doi:10.1016/j.actamat.2019.08.023
- 119) H. Chen, V.I. Levitas, L. Xiong and X. Zhang: Acta Mater. 206 (2021) 116623. doi:10.1016/j.actamat.2021.116623
- 120) K. Dang, C.N. Tomé and L. Capolungo: Acta Mater. 244 (2023) 118510. doi:10.1016/j.actamat.2022.118510
- 121) Y. Peng, R. Ji, T. Phan, W. Gao, V.I. Levitas and L. Xiong: Acta Materialia 226 (2022) 117663. doi:10.1016/j.actamat.2022.117663
- 122) Y. Peng, R. Ji, T. Phan, L. Capolungo, V.I. Levitas and L. Xiong: arXiv.2208.03592 https://doi.org/10.48550/arXiv.2208.03592.
- 123) V.I. Levitas: Phys. Rev. B 104 (2021) 214105. doi:10.1103/PhysRevB.104.214105
- 124) G.Z. Voyiadjis and M. Yaghoobi: Size Effects in Plasticity: From Macro to Nano, (Academic Press, Cambridge, 2019).
- 125) I. Ghamarian, Y. Liu, P. Samimi and P.C. Collins: Acta Mater. 79 (2014) 203–215. doi:10.1016/j.actamat.2014.06.063
- 126) H. Razavi-Khosroshahi, K. Edalati, H. Emami, E. Akiba, Z. Horita and M. Fuji: Inorg. Chem. 56 (2017) 2576–2580. doi:10.1021/acs.inorgchem.6b02725
- 127) H. Razavi-Khosroshahi, K. Edalati, M. Arita, Z. Horita and M. Fuji: Scr. Mater. 124 (2016) 59–62. doi:10.1016/j.scriptamat.2016.06.022
- 128) H. Razavi-Khosroshahi, K. Edalati, M. Hirayama, H. Emami, M. Arita, M. Yamauchi, H. Hagiwara, S. Ida, T. Ishihara, E. Akiba, Z. Horita and M. Fuji: ACS Catal. 6 (2016) 5103–5107. doi:10.1021/acscatal.6b01482
- 129) H. Razavi-Khosroshahi, K. Edalati, J. Wu, Y. Nakashima, M. Arita, Y. Ikoma, M. Sadakiyo, Y. Inagaki, A. Staykov, M. Yamauchi, Z. Horita and M. Fuji: J. Mater. Chem. A 5 (2017) 20298–20303. doi:10.1039/C7TA05262F
- 130) C. Ji, V.I. Levitas, H. Zhu, J. Chaudhuri, A. Marathe and Y. Ma: Proc. Natl. Acad. Sci. USA 109 (2012) 19108–19112. doi:10.1073/pnas.1214976109
- 131) K. Edalati, T. Daio, M. Arita, S. Lee, Z. Horita, A. Togo and I. Tanaka: Acta Mater. 68 (2014) 207–213. doi:10.1016/j.actamat.2014.01.037
- 132) B. Srinivasarao, A.P. Zhilyaev and M.T. Perez-Prado: Scr. Mater. 65 (2011) 241–244. doi:10.1016/j.scriptamat.2011.04.017
- 133) A.P. Zhilyaev, I. Sabirov, G. Gonzaalez-Doncel, J. Molina-Aldareguia, B. Srinivasarao and M.T. Perez-Prado: Mater. Sci. Eng. A 528 (2011) 3496–3505. doi:10.1016/j.msea.2011.01.062
- 134) B.T. Wang, P. Zhang, H.Y. Liu, W.D. Li and P. Zhang: J. Appl. Phys. 109 (2011) 06351. doi:10.1063/1.3556753
- 135) O.O. Kurakevych, Y.L. Godec, W.A. Crichton, J. Guignard, T.A. Strobel, H. Zhang, H. Liu, C.C. Diogo, A. Polian, N. Mebguy, S.J. Juhl and C. Gervais: Inorg. Chem. 55 (2016) 8943–8950. doi:10.1021/acs.inorgchem.6b01443
- 136) X. Li, Z. Li, K. Yang and H. Duanwei: Mater. Lett. 262 (2020) 127195. doi:10.1016/j.matlet.2019.127195
- 137) H. Zhang, H. Liu, K. Wei, O.O. Kurakevych, Y.L. Godec, Z. Liu, J. Martin, M. Guerrette, G.S. Nolas and T.A. Strobel: Phys. Rev. Lett. 118 (2017) 146601. doi:10.1103/PhysRevLett.118.146601
- 138) Y. Ikoma, K. Hayano, K. Edalati, K. Saito, Q. Guo and Z. Horita: Appl. Phys. Lett. 101 (2012) 121908. doi:10.1063/1.4754574
- 139) Y. Ikoma, K. Hayano, K. Edalati, K. Saito, Q. Guo, Z. Horita, T. Aoki and D.J. Smith: J. Mater. Sci. 49 (2014) 6565–6569. doi:10.1007/s10853-014-8250-z
- 140) S. Goel, X. Luo, A. Agrawal and R.L. Reuben: Int. J. Mach. Tools Manuf. 88 (2015) 131–164. doi:10.1016/j.ijmachtools.2014.09.013
- 141) J.A. Patten, H. Cherukuri and J. Yan: Ductile-Regime Machining of Semiconductors and Ceramics. In: High Pressure Surface Science and Engineering, Section 6, ed. by Y. Gogotsi and V. Domnich, (Institute of Physics, Bristol, 2004) pp. 521–540.
- 142) M.M. Alexandrova, V.D. Blank and S.G. Buga: Solid State Phys. 35 (1993) 1308–1317.
- 143) V.D. Blank and B.A. Kulnitskiy: High Press. Res. 15 (1996) 31–42. doi:10.1080/08957959608240458
- 144) Y. Ikoma: Mater. Trans. 60 (2019) 1221–1229. doi:10.2320/matertrans.MF201907
- 145) V.I. Levitas and L.K. Shvedov: Phys. Rev. B 65 (2002) 104109. doi:10.1103/PhysRevB.65.104109
- 146) T. Schindler and Y. Vohra: J. Phys. Condens. Matter 7 (1995) L637. doi:10.1088/0953-8984/7/47/001
- 147) M. Yuan, R.A. Susilo, S. Li, J. Feng, V. Benavides, J. Chen, A.V. Soldatov and B. Chen: Appl. Phys. Lett. 118 (2021) 213101. doi:10.1063/5.0049592
- 148) K. Edalati, T. Daio, Y. Ikoma, M. Arita and Z. Horita: Appl. Phys. Lett. 103 (2013) 034108. doi:10.1063/1.4816082
- 149) V.I. Levitas, D.W. Lee and D.L. Preston: Europhys. Lett. 76 (2006) 81–87. doi:10.1209/epl/i2006-10229-y
- 150) V.I. Levitas and K. Samani: Phys. Rev. B 89 (2014) 075427. doi:10.1103/PhysRevB.89.075427
- 151) V.I. Levitas and K. Samani: Phys. Rev. B 84 (2011) 140103(R). doi:10.1103/PhysRevB.84.140103
- 152) V.I. Levitas and K. Samani: Nat. Commun. 2 (2011) 284. doi:10.1038/ncomms1275
- 153) V.I. Levitas and M. Javanbakht: Phys. Rev. Lett. 105 (2010) 165701. doi:10.1103/PhysRevLett.105.165701
- 154) V.I. Levitas and M. Javanbakht: Phys. Rev. Lett. 107 (2011) 175701. doi:10.1103/PhysRevLett.107.175701
- 155) A. Basak and V.I. Levitas: Acta Mater. 189 (2020) 255–265. doi:10.1016/j.actamat.2020.02.047
- 156) A. Basak and V.I. Levitas: Appl. Phys. Lett. 112 (2018) 201602. doi:10.1063/1.5029911
- 157) A. Basak: Phys. Chem. Chem. Phys. 23 (2021) 17953–17972. doi:10.1039/D1CP02085D
- 158) V.I. Levitas: Scr. Mater. 149 (2018) 155–162. doi:10.1016/j.scriptamat.2017.08.035
- 159) H. Chen, V.I. Levitas, D. Popov and N. Velisavljevic: Nat. Commun. 13 (2022) 982. doi:10.1038/s41467-022-28604-1
- 160) O. Renk and R. Pippan: Mater. Trans. 60 (2019) 1270–1282. doi:10.2320/matertrans.MF201918
- 161) K. Edalati: Mater. Trans. 60 (2019) 1221–1229. doi:10.2320/matertrans.MF201914