Abstract
In this study, the effect of the initial phases of the Si-bearing near-α titanium alloy Ti–6Al–2.75Sn–4Zr–0.4Mo–0.45Si (Ti-1100) on Vickers microhardness during aging at 600°C from 5 min to 42 days was investigated by transmission electron microscopy. The initial phases included α′ martensite and α phases. The variation in the hardness of the specimen with the initial α′ martensite phase occurred in the following order: the decrease caused by dislocation recovery, the increase caused by silicide precipitation, the decrease caused by silicide coarsening, and the increase caused by α2 precipitation. As for the initial α phase, hardness initially decreased and then increased because of dislocation recovery and silicide/α2 precipitation, respectively. The difference in age-hardening behavior resulted from the difference between the dislocation amounts in the two initial phases. Silicide precipitation was promoted by dislocations, whereas α2 precipitation occurred via homogeneous nucleation irrespective of the dislocations.

1. Introduction
Near-α titanium alloys are widely used as aircraft, automobile, and turbine materials because of their high specific strength and superior high temperature strength, such as Ti–6Al–2Sn–4Zr–2Mo–0.1Si (Ti-6242S),1) Ti–5.6Al–3.8Sn–3.2Zr–0.5Mo–0.4Nb–1.0Ta–0.35Si (Ti60),2) Ti–6Al–2Zr–1Mo–1V (TA15),3) and Ti–6.0Al–4.0Sn–3.5Zr–0.5Mo–0.7Nb–0.35Si (IMI834).4) Research and development of new alloys is still ongoing.5–8) Ti–6Al–2.75Sn–4Zr–0.4Mo–0.45Si (Ti-1100) is a near-α titanium alloy, which is developed for the use at elevated temperatures up to 593°C.9) The microstructures and mechanical properties of Ti-1100 have been investigated by a lot of researchers.10–15) In particular, the microstructural change in Ti-1100 at elevated temperatures is due to the precipitation of silicide and Ti3Al (α2). The silicide was reported to be (Ti,Zr)6Si3 by Madsen et al.16) Ti-1100 includes 0.45 mass%Si, which improves creep strength by dissolving as solutes and contributes to precipitation strengthening by silicide precipitation.14) α2 precipitation improves strength but induces brittleness.12,13) Such microstructural changes affect high-temperature deformation, and vice versa. The mutual correlation between high-temperature deformation and microstructural change is complex.
Aging behavior without deformation must be investigated to understand the effect of microstructure on high-temperature deformation. Madsen et al. reported the aging behavior of Ti-1100 at 593°C, which is the maximum service temperature.16) In this report, solid solution treatment at 1093°C and stabilization at 593°C for 8 h followed by air cooling were performed before aging. Heat treatment produced the initial α phase before aging. After aging, the Rockwell C hardness curve exhibited two peaks. According to the authors, the first peak was most probably related to the formation of silicides, such as the formation of GP zones or an intermediate silicide phase or the final equilibrium silicide ((Ti,Zr)6Si3). By contrast, the second peak could be due to the formation of either the equilibrium silicide or α2 or both.
Precipitation is affected by dislocation. In various alloys, such as Fe alloys,17,18) Al alloys,19,20) and Ti alloys,21,22) dislocations promote diffusion via pipe diffusion and serve as nucleation sites. Therefore, the existence of dislocations before aging affects microstructural changes at elevated temperatures. Weinem et al. performed solid solution treatments in Ti-1100 with four kinds of cooling rates, including water quenching (7000°C/min), air cooling (800°C/min), fast furnace cooling (20°C/min), and slow furnace cooling (1°C/min).23) The initial phase in the water-quenched specimen before aging was an α′ martensite phase, whereas that in air-cooled, fast furnace-cooled, and slow furnace-cooled specimens was an α phase. Considering that several dislocations were included in the α′ martensite phase,24,25) aging behavior would vary in accordance with the initial phases. However, aging treatment was performed under one condition, that is, at 650°C for 8 h. Thus, the effect of the initial phase on the microstructural change during aging in Ti-1100 is not clarified in a wide range of aging time. As for long-time aging, Donlon et al. investigated the aging behavior at the early stage of precipitation in Ti-1100 consisting of the α′ martensite phase26) and reported C-curves of silicide and α2 using time–temperature–transformation (TTT) diagrams. The time when silicide and α2 start to precipitate can be known, but details of microstructural changes associated with the precipitation were not reported. TEM observation of the precipitation in Ti-1100 was reported only at aging at 450°C, 650°C, and 760°C for 2000 h.26) Therefore, it is significant to investigate the aging behavior with the α′ martensite phase as the initial phase.
On the other hand, when a large and thick Ti-1100 alloy is heat-treated in an actual process, it is possible that the entire volume will not transform into the α′ martensite phase even if the alloy is quenched into water because the cooling takes a long time. However, applications of near-α titanium alloys include small parts such as engine valves for automobiles and motorcycles.27) Thus, it is important to investigate the effects of the α′ phase on aging behavior.
In the present study, the effects of silicide and α2 precipitations on hardness during aging were investigated using Ti-1100 specimens with two different initial phases: α′ martensite and α phases.
2. Experimental Procedure
A Ti–6Al–2.75Sn–4Zr–0.4Mo–0.45Si (Ti-1100) bar with a diameter of 12 mm was supplied by Titanium Metals Corporation (TIMET) via Nippon Steel Corporation. The chemical composition of this alloy is presented in Table 1. Disks with a thickness of 3 mm were cut from this bar and then cut in half along the diameter. The half disks were subjected to the following heat treatment under Ar atmosphere (Fig. 1). First, solid solution treatment was performed at 1060°C for 25 min (β transus: ∼1010°C, silicide solvus: ∼1030°C, α2 solvus: ∼740°C26)), followed by iced brine quenching or air cooling. The former and latter specimens were designated as IBQ and AC specimens, respectively. The solution-treated specimens were subjected to aging treatments at 600°C, which is close to treatment at 593°C, for 5 min to 42 days (hereafter 42 d) followed by iced brine quenching. The Vickers microhardness of these specimens was measured under 1 kg load. The average hardness values were evaluated using 10 indentations, excluding the maximum and minimum values from 12 indentations randomly applied on the specimens. The sizes of the indentations ranged from 65.5 to 75.0 µm. Microstructures were observed using optical and transmission electron microscopes (TEM), including JEM-100CXII, JEM-2100, and JEM-3010 (JEOL) operating at 100, 200, and 300 kV, respectively. Optical microscopic and TEM specimens were prepared as follows. The 3-mm-thick half disk specimens were sliced in half thickness, and one half was used for optical microscopy and the other for TEM. The optical microscopic and TEM specimens were made from the internal region of the half disks to avoid the influence of the atmosphere during the heat treatment. The optical microscopic specimens were prepared by mirror-polishing the bottom surfaces and then etching the polished surfaces with a solution of 30% HF and 70% HNO3. The TEM specimens were prepared by mechanically grinding the half disks to a thickness of 0.1 mm with emery paper, punching them into disks with a diameter of 3 mm, and electropolishing the 3-mm disks by twin-jet electropolishing with a solution of 97 mL of HClO4, 18 mL of C4H7OH, and 885 mL of CH3OH at 10 V and −50°C. The constituent phases were investigated by X-ray diffraction (XRD, X’pert Pro MPD, PANalytical) using CuKα1 radiation generated at 45 kV, 40 mA at a scan speed of 0.01°/s from 30 to 80 degrees.

Table 1 Chemical composition of Ti-1100 used in the present study (in mass%).
3. Results
3.1 Vickers microhardness
Figure 2 presents the results of Vickers microhardness variation during aging of IBQ and AC specimens. The error bars indicate the standard deviations. The hardness of the IBQ specimen initially decreased until 25 min and then increased until 625 min, decreased until 4 d, and finally increased until 42 d. The hardness of the AC specimen decreased until 625 min and then increased until 42 d. Furthermore, the hardness value of the IBQ specimen was higher than that of the AC specimen at all the aging time.

In Madsen’s report,16) age hardening was measured using the specimen with the initial α phase. In this specimen before aging, no precipitates and no β phase were formed, and dislocations were observed in part near α lamellar interfaces. The variation in the hardness during aging exhibited two peaks. The first and second peaks were observed from 480 to 1000 min and from 1000 to 60000 min (approximately 42 d), respectively. However, the hardness in the present study monotonously increased from 625 min to 42 d (AC in Fig. 2). Based on Madsen’s report,16) the minimum and maximum values of the first peak were 35.5 and 36.7 HRC, which corresponded to 350 and 360 HV, respectively, based on the hardness conversion table in ASTM E140.28) As for the second peak, the minimum and maximum values were 35.9 and 38.1 HRC, which corresponded to 353 and 373 HV, respectively. Therefore, the increment of the hardness value of the first and second peaks was 10 and 20 HV, respectively. These increments were comparable to the error bar sizes in the present study (Fig. 2). Thus, the first and second peaks reported by Madsen et al.16) could not be detected in this study. The difference in the measurement results between Madsen et al. and the present authors was likely to be caused because the average values of hardness were evaluated from 120 indentations by Madsen et al. but from 10 indentations in the present study.
3.2 Microstructure
3.2.1 Before aging treatment
Figure 3 presents the results of optical microscopic observations of the IBQ and AC specimens before aging. Both specimens were composed of lamellae. The prior β grain size of the IBQ and AC specimens were measured from 107 and 83 grains, respectively; they were 400 ± 97 and 380 ± 110 µm. Errors are expressed as standard deviations. Consequently, the size of prior β grains was almost the same in both specimens as indicated by dashed lines (Figs. 3(a), (c)). Figure 4 presents TEM micrographs of both specimens. As shown in Fig. 4(a), the IBQ specimen included (A) twins, (B) stacking faults, and (C) dislocations in the lamellar microstructure. The stacking faults had striped contrasts, and the dislocations showed complicated mottled contrast because of the presence of a large number of dislocations in contrast to a single dislocation exhibiting a linear contrast. The twins were identified as $(10\bar{1}1)$ twins by nanobeam electron diffraction (Fig. 5). The $(10\bar{1}1)$ twins are reported in α′ martensite phases in pure titanium29) and other titanium alloys.30,31) Based on the characteristics of lattice defects in the α′ martensite phase (dislocations, stacking faults, and $(10\bar{1}1)$ twins; Figs. 4 and 5), the IBQ specimen before aging was composed of an α′ martensite phase. On the contrary, the AC specimen did not show stacking faults and twins (Fig. 4(b)). Bend contours with a smooth contrast were observed as indicated in an encircled area D, whereas bend contours in E exhibited a disturbed contrast. In area E, the bend contour contrast32) and dislocation contrast33) were superimposed. The overlapping contrast indicated the presence of dislocations. The AC specimen had a smaller number of dislocations than the IBQ specimen because the AC specimen exhibited smooth bend contours in a wide area. Thus, the AC specimen before aging consisted of an α phase because of the absence of stacking faults and twins as well as a small number of dislocations.

Figure 6 shows the XRD results of the IBQ and AC specimens after the solid solution treatment. The IBQ and AC specimens consisted of α′ and α phases, respectively; no silicide or β phase was detected. The full widths at half maximum of the peaks in the IBQ specimen were larger than those in the AC specimen, indicating a higher dislocation density in the IBQ specimen.
3.2.2 After aging treatment
3.2.2.1 Prior β grain size
Figure 7 presents the optical micrograph of IBQ and AC specimens after aging for 42 d. No difference was observed between prior β grain sizes of IBQ and AC specimens before and after aging (Figs. 3 and 7). Thus, the effect of prior β grain sizes on hardness was negligible when compared between IBQ and AC specimens.
3.2.2.2 Microstructure in prior β grains in IBQ specimens
Figure 8 presents bright-field images of IBQ specimens after solid solution treatment and aging for 25 min, 625 min, 4 d, and 42 d. A complicated mottled contrast was observed as indicated by a white circle in Fig. 8(a) because of a large number of dislocations in lamellae before aging. After aging for 25 min (Fig. 8(b)), many areas showed no dislocation contrast inside the lamellae, indicating that the area without dislocations increased. Silicide precipitates were not observed in Fig. 8(b). Therefore, the initial decrease in hardness (Fig. 2) corresponded to the increase in the dislocation-free regions caused by recovery. After 625 min (Fig. 8(c), (d)), silicides were formed at the interface between α phases and in the α lamellar interior as indicated by white and black arrows, respectively. Based on the TTT diagram reported by Donlon,26) silicides started to precipitate after approximately 2 h, which was consistent with the present result. As shown in Fig. 8(e), silicides at the α-phase interface coarsened after 4 d as indicated by white arrows, and fine silicides were observed on dislocations within α lamellae as indicated by black arrows. The chemical composition of the silicide (Fig. 8(c)) was measured by energy-dispersive X-ray spectroscopy (EDS, Fig. 9). Si was detected only in the precipitate. The increase in hardness from 25 min to 625 min and the decrease in hardness from 625 min to 4 d (Fig. 2) were attributed to silicide precipitation and coarsening, respectively. Jia et al. reported tensile test results of Ti–5.6Al–3.8Sn–3.2Zr–0.5Mo–0.4Nb–1.0Ta–0.35Si (Ti60) aged at 650°C, 700°C, and 750°C for 2 h.34) In this report, the yield strength of the 700°C-aged specimen was larger than that of the 650°C-aged specimen because the number of small silicides was larger at 700°C than at 650°C; the yield strength of the 750°C-aged specimen was smaller than that of the 700°C-aged specimen due to large silicide precipitation. This report showed that the strengthening effect would be decreased with increasing the size of silicides. This report is consistent with the hardness variation from 25 min to 4 d in the present study. As for silicides, three kinds of silicides are reported in various Si-bearing near-α titanium alloys: (Ti,Zr)5Si3 (S1), (Ti,Zr)6Si3 (S2), and S′.35) The three silicides have a hexagonal crystal structure and similar lattice parameters. In the present study, silicide was not identified. Madsen et al. assumed that silicide in Ti-1100 was S2 because S2 silicides were precipitated in near-α titanium alloys, including Ti–6Al–5Zr–0.5Mo–0.25Si (IMI685) and Ti–5.5Al–3.5Sn–3Zr–1Nb–0.25Mo–0.3Si (IMI829), which had similar compositions to Ti-1100.16)


Figures 10(a)–(c) present electron diffraction patterns of IBQ specimens after aging for 625 min, 4 d, and 42 d; the selected area diameters were 120 nm for 625 min and 4 d and 450 nm for 42 d. After 625 min (Fig. 10(a)), diffuse superlattice spots of α2 were observed. These superlattice spots were not those of silicide because of the following. If silicide’s spots are observed at the same position as $(11\bar{2}0)\alpha_{2}$, silicide’s other spots also appear. That is, the superlattice spot of $(11\bar{2}0)\alpha_{2}$ appears at the midpoint between $(11\bar{2}0)\alpha $ and the transmitted spot, while the silicide’s spots appear at the quadrisecting points between $(11\bar{2}0)\alpha $ and the transmitted spot.36,37) Such silicide’s spots were not observed in Figs. 10(a)–(c). Consequently, silicide’s spots were not included in Figs. 10(a)–(c).
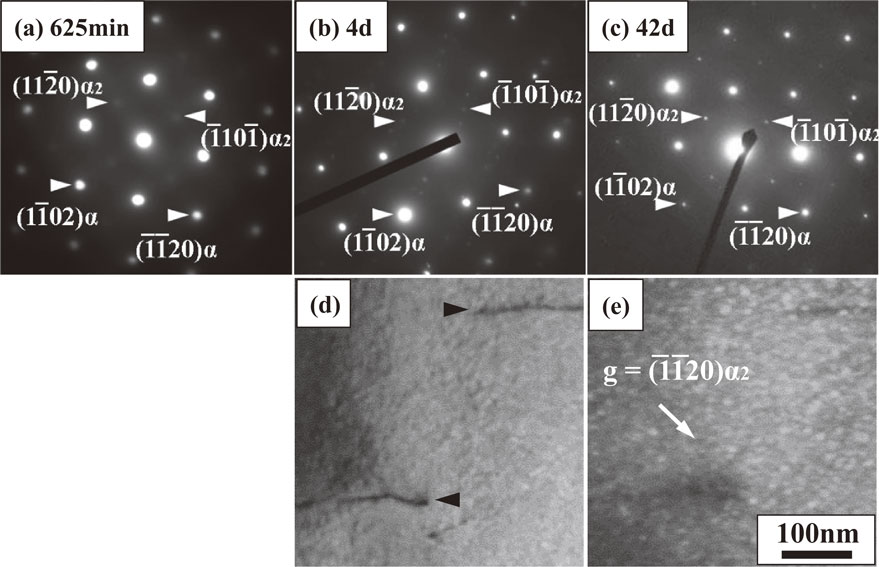
The superlattice spots of α2 gradually became distinct during aging from 625 min to 42 d. Although α2 formation increases hardness, the hardness shown in Fig. 2 decreased from 625 min to 4 d. The contribution of α2 formation to the increase of hardness was small because aging from 625 min to 4 d corresponded to the early stage of α2 precipitation, and the resulting α2 precipitates were too small, thereby resulting in diffuse diffraction spots. Based on Zhang’s report on α2 precipitation in Ti–6Al–2Cr–2Mo–2Sn–2Zr,38) the average size of α2 precipitates that exhibited diffuse superlattice spots was estimated to range between 1 and 2 nm. As for age hardening of α2 precipitation, a study in Ti–6Al–4V was reported.39) In this report, low hardness continued at the early stage of aging followed by a sharp increase. In the present study, aging time before 4 d corresponded to the early stage of α2 precipitation, and the contribution of α2 precipitates to the increase of hardness was small because of the occurrence of diffuse superlattice spots after aging for 625 min (Fig. 10(a)) and the increase of hardness after 4 d (Fig. 2).
After 4 d, α2 precipitates grew to exhibit distinct superlattice spots (Fig. 10(b)), thereby increasing hardness. Hardness monotonously increased until 42 d, and the size of α2 precipitates was approximately 10 nm (Fig. 10(e)). Although silicides also existed after 42 d (Fig. 8(e)), the contribution of silicides to the increase of hardness was small because silicides exhibited a decrease in hardness after 4 d because of silicide coarsening.
3.2.2.3 Microstructure in prior β grains in AC specimens
Figure 11 presents bright-field images of AC specimens after solid solution treatment and aging for 625 min, 7 d, and 42 d. Silicides were not observed before and after aging for 625 min (Figs. 11(a), (b)). Dislocations were observed in lamellae before aging, but the dislocation-free region increased after 625 min. Thus, the initial decrease in hardness (Fig. 2) was attributed to less dislocations caused by recovery. After 7 d, silicides were observed at the α interface as indicated by white arrows (Fig. 11(c)), and they grew after 42 d. The increase in hardness from 625 min to 42 d (Fig. 2) was consistent with silicide precipitation from 7 d to 42 d (Fig. 11).

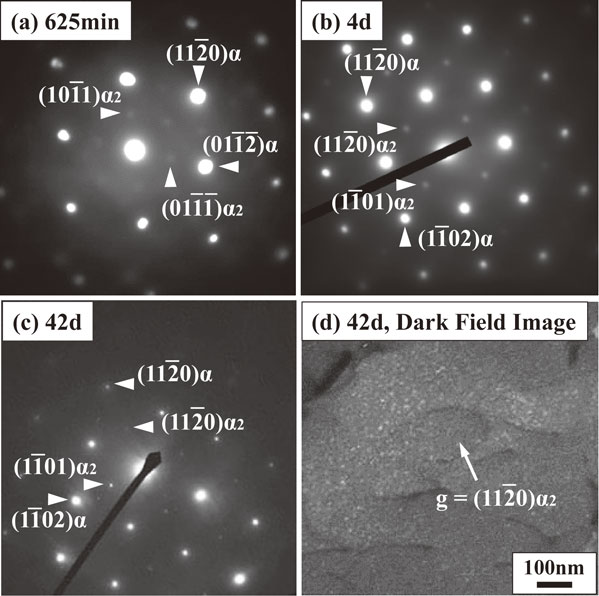
Figures 12(a)–(c) present electron diffraction patterns of the AC specimen after aging for 625 min, 4 d, and 42 d; the sizes of the selected area diameters were 120 nm for 625 min and 4 d and 450 nm for 42 d. In these patterns, α fundamental spots and α2 superlattice spots were observed. These superlattice spots were not those of silicide because of the same reason explained in Fig. 10. The superlattice spots were diffuse after 625 min, but such spots gradually became sharp with aging. The distinct superlattice spots were observed after 42 d, indicating that α2 precipitates grew from 625 min to 42 d. The size of the α2 precipitates was approximately 10 nm (Fig. 12(d)), which is a dark-field image using the $11\bar{2}0$ reflection of the α2 phase. The increase in hardness from 625 min to 42 d (Fig. 2) was consistent with α2 precipitation.13,16,40) As shown in Fig. 11, the increase in hardness from 625 min to 42 d was also related to silicide precipitation. α2 and silicide precipitations occurred concurrently. Thus, the contribution of the two kinds of precipitates to hardness must be distinguished, but this strategy remains to be clarified in future studies.
4. Discussion
4.1 Differences in precipitation behavior between IBQ and AC specimens
Compared with the AC specimen, silicide precipitation was promoted in the IBQ specimen; that is, silicides precipitated earlier in the IBQ specimen than in the AC specimen. However, the difference in α2 precipitation was not observed in both specimens. In the IBQ specimen, a large number of dislocations were introduced in the α′ martensite phase before aging (Figs. 4(a) and 8(a)). Thus, the IBQ specimen included more dislocations than the AC specimen. The dislocations in the IBQ specimen likely promoted diffusion via pipe diffusion17,18) and served as silicide nucleation sites (Fig. 8(d)). It has also been reported that silicide precipitates preferentially on dislocations in other Si-containing titanium alloys.41,42) It is suggested that a high driving force for silicide nucleation occurs on dislocations. In addition, it has been reported that the kinetics of silicide precipitation is enhanced by β stabilizers.8) However, in the present study, no β phase was present in the IBQ and AC specimens, and thus the amounts of β stabilizers in the matrix of both specimens were the same. Therefore, the β stabilizers had no effect on the promotion of silicide precipitation.
On the contrary, α2 precipitation was not promoted in the IBQ specimen. As shown in Fig. 10(e), α2 precipitates were homogeneously formed in the matrix. Figure 10(d) is a bright-field image taken from the same area as Fig. 10(e). Dislocations were indicated by black arrows in Fig. 10(d). These dislocations did not serve as heterogeneous nucleation sites for the α2 phase. Based on the report on α2 precipitation in near-α titanium alloys by Zhang and Li,43) α2 precipitation occurred via homogeneous nucleation at low aging temperatures because of the large temperature difference between the α2 solvus and the aging temperature, that is, the large driving force for α2 nucleation, whereas heterogeneous nucleation at dislocations occurred at high aging temperatures. It is assumed that the aging temperature in the present study was low for α2 precipitation to occur via homogeneous nucleation.
4.2 Difference in hardness between IBQ and AC specimens
The hardness value of the IBQ specimen was always larger than that of the AC specimen during aging until 42 d. The reason for this was considered based on the idea that hardness values of the IBQ and the AC specimens changed via dislocation strengthening, silicide precipitation strengthening, and α2 precipitation strengthening during aging as follows. Before aging, IBQ and AC specimens showed α′ martensite and α phases, respectively (Fig. 4). Thus, the IBQ specimen was harder than the AC specimen. This result was consistent with the fact that the α′ martensite phase exhibited a larger yield strength than the α phase in the tensile test of Ti-1100 by Weinem et al.23) At this stage, silicides were not precipitated; therefore, the IBQ specimen exhibited a larger hardness value because of dislocation strengthening and grain-size strengthening. Grain-size strengthening was due to the presence of twins. The size of the twins hardly changed during aging, just like the prior β grains (Fig. 7), and therefore did not affect the hardness variation during aging. Considering that dislocations decreased with aging, the hardness value derived from dislocation strengthening in both specimens would become equal as aging proceeds because of the change from α′ phase to α phase. In addition, as the hardness decreased with the change from the α′ phase to the α phase, solid solution strengthening did not affect the hardness variation because the lattice constants of the α′ phase and the α phase were almost equal according to the XRD results (Fig. 6) and precipitation did not occur (Fig. 8(b)). After 25 min, silicides were precipitated in the IBQ specimen, resulting in a larger hardness value in the IBQ specimen than in the AC specimen. α2 precipitation was not promoted in the IBQ specimen (Fig. 10). Thus, the hardness value derived from α2 precipitation strengthening in both specimens were equal. Therefore, the difference of hardness between the IBQ and the AC specimens after 25 min was attributed to the difference of silicide precipitation. As can be observed in the IBQ specimen shown in Figs. 8(c) and (d), the presence of dislocations promoted silicide precipitation. Consequently, silicide precipitation occurred not only at the interface of α lamellae but also within them. The average interparticle spacing between silicides in the IBQ specimen was likely to be smaller than that in the AC specimen after aging for 42 d (Figs. 8(f) and 11(d)), resulting in the larger hardness value in the IBQ specimen even after aging for 42 d.
5. Summary
The effect of the initial phases (α′ martensite and α phases) on Vickers microhardness during aging in the Si-bearing near-α titanium alloy Ti-1100 was investigated. Consequently, the following results were obtained, showing that the initial phases affected age hardening at 600°C (nearly equal to the maximum service temperature) in Ti-1100.
-
(1)
Solid solution treatment followed by iced brine quenching produced the α′ martensite phase, where dislocations, stacking faults, and $(10\bar{1}1)$ twins were formed. On the contrary, the solid solution treatment followed by air cooling produced the α phase, where no stacking faults, no $(10\bar{1}1)$ twins, and less dislocations were included as compared with the α′ martensite phase.
-
(2)
During aging of the specimen consisting of the initial α′ martensite phase (the IBQ specimen), hardness varied as follows: the decrease caused by dislocation recovery, the increase caused by silicide precipitation, the decrease caused by silicide coarsening, and finally the increase caused by α2 precipitation.
-
(3)
During aging the specimen composed of the initial α phase (the AC specimen), the hardness first decreased due to the dislocation recovery, and then monotonously increased due to the silicide and α2 precipitations.
-
(4)
Silicide precipitation was promoted in the IBQ specimen because the IBQ specimen included more dislocations than the AC specimen. The dislocation in the IBQ specimen likely promoted diffusion via pipe diffusion and served as the nucleation sites for silicide precipitation. On the contrary, α2 precipitation was not promoted in the IBQ specimen, and it occurred via homogenous nucleation irrespective of the dislocations.
-
(5)
The hardness value in the IBQ specimen was larger than that in the AC specimen at all aging times. This finding was attributed to the difference in dislocation strengthening until 25 min and thereafter the difference in silicide precipitation strengthening caused by the promotion of silicide precipitation in the IBQ specimen.
Acknowledgments
We would like to express our gratitude to the Research and Education Center of Materials Engineering, Faculty of Engineering, Ehime University and the Advanced Research Support Center of Ehime University for supplying the XRD and TEM used in the present study, respectively.
REFERENCES
- 1) S. Joseph, T.C. Lindley and D. Dye: Int. J. Plast. 110 (2018) 38–56. doi:10.1016/j.ijplas.2018.06.009
- 2) S. He, W. Zeng, R. Jia, J. Xu and X. Zhang: Mater. Sci. Eng. A 814 (2021) 140749. doi:10.1016/j.msea.2021.140749
- 3) D. He, J. Zhu, S. Zaefferer and D. Raabe: Mater. Des. 56 (2014) 937–942. doi:10.1016/j.matdes.2013.12.018
- 4) N. Singh and V. Singh: Mater. Sci. Eng. A 485 (2008) 130–139. doi:10.1016/j.msea.2007.07.064
- 5) X.Z. Ma, Z.L. Xiang, M.Z. Ma, Y.P. Cui, W.M. Ren, Z.T. Wang, J.C. Huang and Z.Y. Chen: Mater. Sci. Eng. A 775 (2020) 138996. doi:10.1016/j.msea.2020.138996
- 6) L. Ma, M. Wan, W. Li, J. Shao, X. Han and J. Zhang: J. Mater. Sci. Technol. 108 (2022) 173–185. doi:10.1016/j.jmst.2021.08.065
- 7) P.L. Narayana, S.W. Kim, J.K. Hong, N.S. Reddy and J.T. Yeom: Mater. Sci. Eng. A 718 (2018) 287–291. doi:10.1016/j.msea.2018.01.113
- 8) W.J. Zhang, X.Y. Song, S.X. Hui, W.J. Ye and W.Q. Wang: Rare Met. 37 (2018) 1064–1069. doi:10.1007/s12598-015-0666-3
- 9) P.J. Bania: ISIJ Int. 31 (1991) 840–847. doi:10.2355/isijinternational.31.840
- 10) B. Fu, H. Wang, C. Zou and Z. Wei: Trans. Nonferr. Met. Soc. China 25 (2015) 2206–2213. doi:10.1016/S1003-6326(15)63833-X
- 11) V.K. Chandravanshi, R. Sarkar, S.V. Kamat and T.K. Nandy: J. Alloy. Compd. 509 (2011) 5506–5514. doi:10.1016/j.jallcom.2011.02.114
- 12) A. Madsen and H. Ghonem: J. Mater. Eng. Perform. 4 (1995) 301–307. doi:10.1007/BF02649067
- 13) A. Madsen and H. Ghonem: Mater. Sci. Eng. A 177 (1994) 63–73. doi:10.1016/0921-5093(94)90478-2
- 14) A.H. Rosenberger, A. Madsen and H. Ghonem: J. Mater. Eng. Perform. 4 (1995) 182–187. doi:10.1007/BF02664112
- 15) D.H. Lee and S.W. Nam: J. Mater. Sci. 34 (1999) 2843–2849. doi:10.1023/A:1004627216837
- 16) A. Madsen, E. Andrieu and H. Ghonem: Mater. Sci. Eng. A 171 (1993) 191–197. doi:10.1016/0921-5093(93)90406-5
- 17) W.P. Sun, M. Militzer and J.J. Jonas: Metall. Trans. A 23 (1992) 3013–3023. doi:10.1007/BF02646119
- 18) V.K. Vasudevan, S.J. Kim and C.M. Wayman: Metall. Trans. A 21 (1990) 2655–2668. doi:10.1007/BF02646061
- 19) S. Cheng, Y.H. Chao, Y.T. Zhu and E. Ma: Acta Mater. 55 (2007) 5822–5832. doi:10.1016/j.actamat.2007.06.043
- 20) Y.S. Yassar, D.P. Field and H. Weiland: Scr. Mater. 53 (2005) 299–303. doi:10.1016/j.scriptamat.2005.04.013
- 21) D. Qiu, R. Shi, D. Zhang, W. Lu and Y. Wang: Acta Mater. 88 (2015) 218–231. doi:10.1016/j.actamat.2014.12.044
- 22) T. Furuhara, T. Maki and T. Makino: J. Mater. Proc. Tech. 117 (2001) 318–323. doi:10.1016/S0924-0136(01)00790-7
- 23) D. Weinem, J. Kumpfert, M. Peters and W.A. Kaysser: Mater. Sci. Eng. A 206 (1996) 55–62. doi:10.1016/0921-5093(95)09987-5
- 24) H. Matsumoto, H. Yoneda, D. Fabregue, E. Maire, A. Chiba and F. Gejima: J. Alloy. Compd. 509 (2011) 2684–2692. doi:10.1016/j.jallcom.2010.11.089
- 25) W.A. Baeslack, III and F.D. Mullins: Metall. Trans. A 15 (1984) 1948–1952. doi:10.1007/BF02664909
- 26) W.T. Donlon, J.E. Allison and J.V. Lasecki: Titanium’92, Science and Technology, ed. by F.H. Froes and I. Caplon, (The Minerals, Metals and Materials Society, 1993) pp. 295–302.
- 27) H. Fujii: J. JSTP 56 (2015) 530–534. doi:10.9773/sosei.56.530
- 28) ASTM E140-12B(2019)e1, Standard Hardness Conversion Tables for Metals Relationship Among Brinell Hardness, Vickers Hardness, Rockwell Hardness, Superficial Hardness, Knoop Hardness, Scleroscope Hardness, and Leeb Hardness, Standard, (ASTM International, International, West Conshohocken, PA, 2019) http://dx.doi.org/10.1520/E0140-12BR19E01.
- 29) Z. Nishiyama, M. Oka and H. Nakagawa: J. Japan Inst. Metals 29 (1965) 139–143. doi:10.2320/jinstmet1952.29.2_139
- 30) S. Lee, C. Park, J. Hong and J. Yeom: Sci. Rep. 8 (2018) 11914. doi:10.1038/s41598-018-30059-8
- 31) H. Matsumoto, L. Bin, S. Lee, Y. Li, Y. Ono and A. Chiba: Metall. Mater. Trans. A 44 (2013) 3245–3260. doi:10.1007/s11661-013-1655-5
- 32) P. Hirsh, A. Howie, R. Nicholson, D.W. Pashley and M.J. Whelan: Electron Microscopy of Thin Crystals, (Robert E. Krieger Publishing Co., Inc., 1977) pp. 201–207.
- 33) P. Hirsh, A. Howie, R. Nicholson, D.W. Pashley and M.J. Whelan: Electron Microscopy of Thin Crystals, (Robert E. Krieger Publishing Co., Inc., 1977) pp. 169–188.
- 34) W. Jia, W. Zeng and H. Yu: Mater. Des. 58 (2014) 108–115. doi:10.1016/j.matdes.2014.01.063
- 35) C. Ramachandra and V. Singh: Metall. Trans. A 23 (1992) 689–690. doi:10.1007/BF02801186
- 36) G. Sridhar and D.S. Sarma: Metall. Trans. A 20 (1989) 55–62. doi:10.1007/BF02647493
- 37) C. Ramachandra, A.K. Singh and G.M.K. Sarma: Metall. Trans. A 24 (1993) 1273–1280. doi:10.1007/BF02668196
- 38) X.D. Zhang, J.M.K. Wiezorek, W.A. Baeslack, III, D.J. Evans and H.L. Fraser: Acta Mater. 46 (1998) 4485–4495. doi:10.1016/S1359-6454(98)00158-X
- 39) M.R. Barajas-Álvarez, A. Ruiz, H. Carreón and V.H. López: AIP Conf. Proc. 2102 (2019) 060010. doi:10.1063/1.5099800
- 40) A. Gysler and S. Weissmann: Mater. Sci. Eng. 27 (1977) 181–193. doi:10.1016/0025-5416(77)90169-0
- 41) H.M. Flower, P.R. Swann and D.R.F. West: Metall. Trans. 2 (1971) 3289–3297. doi:10.1007/BF02811609
- 42) M. Thomas, T. Lindley, D. Rugg and M. Jackson: Acta Mater. 60 (2012) 5040–5048. doi:10.1016/j.actamat.2012.06.017
- 43) J. Zhang and D. Li: Mater. Sci. Eng. A 341 (2003) 229–235. doi:10.1016/S0921-5093(02)00240-X


