Abstract
Counter electrodes of Carbon Aerogel with Silver Sulfide Structures (CA/Ag2S) were synthetized by cathodic deposition and solid vapor reactions. Their optical and electrical properties were determined, and they were tested as counter electrodes in dye-sensitized solar cells instead of the conventional Pt. It was found that the Ag2S presence improves the optical and electrical conductivity of the counter electrodes. However, the impedance electrochemical spectra indicated increased resistivity (ERS) and charge transfer resistance (Rp) with increased Ag2S structures; this suggests that the interface (CA/Ag2S) may act as a barrier to electron transfer. Furthermore, the W1-R values decreased as the amount of Ag2S increased, indicating a higher catalytic activity for these samples. DSSC efficiencies range from 1 to 2.5%, lower than those reported for platinum. They are a consequence of a poor fill factor (FF) that can be explained by the electrolyte loss that occurs during cell testing due to the counter electrodes’ high absorption and catalytic properties. While the performance is not ideal, the high initial Jsc values (21 mA/cm2) suggest that this system may present an opportunity as a material for energy devices.

1. Introduction
The use of solar energy has been increasing speedily compared to other renewable energy sources.1) It can be obtained at no cost, a resource that never gets depleted. However, exploiting this energy is rather a recent idea.2) Solar cells have been classified into three categories; the first is the family of Silicon (Si) crystal solar cells. The second category is thin film solar cells, and the third category is called emerging technologies which include organic, inorganic, perovskite, and DSSC solar cells.3) Nevertheless, because of its high production cost and environmental threat, the current silicon-based solar cells are limited to the market.4) The dye-sensitized solar cell (DSSC), also recognized as Grätzel solar cell, is named after its creator Prof. Michael Grätzel.5) This device is among the most important in renewable energy, and researchers have given it greater attention because of its outstanding characteristics such as easy manufacturing process, inexpensive, transparency, lightweight, flexibility, ecologically friendly. They can convert at large scale solar energy to electrical energy.6) Generally, DSSCs are built of these three main components, a dye-sensitized TiO2 anode electrode, a counter electrode, and an electrolyte of I−/I3− redox couple that is inserted in the middle of the anode and counter electrode.7) One essential element of the DSSC is the counter electrode (CE), often called the cathode, which executes two tasks; first, it gathers the electrons coming from the external circuit and catalyzes the reduction of I3− to I−, because of that, regeneration of the sensitizer take place.7) CEs on Dye-sensitized solar cells typically are made of platinum (Pt) due to its good electrocatalyst properties in combination with I-/I-3 based electrolyte; however, Huang Y.J. et al. in 2021 reported that in combination with other redox couples such as Cobalt (Co), Copper (Cu) and Iron (Fe), it does not work as well, and rather unstable, resulting in a meager performance. Besides, Pt is rare and expensive to be considered for mass production and will not be suitable for commercialization. The search for finding an appropriate electrocatalyst material to use as CE is the goal for investigators nowadays. An optimal CE must have excellent electron conductivity, outstanding electrocatalysts, great redox stability, and be ample and inexpensive.2) Subsequently, carbon-based and carbon-composites have been the target to replace Pt counter electrodes, accordingly to recent investigations on this material which presents outstanding properties such as a high electrocatalyst, great electron conductor, is an abundant resource, and can be obtained at a low price.8) Chen H. et al. investigated carbon aerogel as a replacement for Pt CEs on DSSCs, the photovoltaic performance values obtained for photocurrent density (Jsc), open circuit voltage (Voc), fill factor (FF), and efficiency (η) surpassed the values achieved for DSSCs with Pt CE, electrochemical test exhibited lower resistance interaction between electrolyte and CE, likewise, a large active catalytic area was observed do to its double-layer capacitance, structure, and morphology of CA in the field emission scanning electron microscope (FE-SEM) show a three-dimensional interconnected porous confirming a great electrical conductivity.9) Wang C.C. and Lu S.Y., in 2014, fabricated from carbon black powder and investigated a Graphene Quantum Dots (GQD) and Mesoporous Carbon Aerogel (CA) composite synthesized by sol-gel technique to be used as a counter electrode. Results obtained from cyclic voltammetry (CV) characterization show better catalytic efficiency to the redox of I-/I3- than those with Pt and plain Carbon Aerogels. In addition, results show that when the long-term stability of the electrodes was investigated, GQD/CA composite electrodes exceeded the ones from Pt and plain CA.10) Zubaida Butt, M.T. et al. studied a nitrogen-doped carbon (N-dC) aerogel as a counter electrode for DSSC. N-dC was synthesized by hydrothermal carbonization process utilizing biomass-derived precursors. The highest current density achieved was 11.71 mA/cm2, 0.70 V of OC, FF of 0.56, and efficiency of 4.47%. Still just below the values that Pt counter electrodes have reported. Nevertheless, more studies need to be done with this material since the results obtained have shown to be a great replacement for Pt-free DSSCs.11) Wang et al. 2009 utilized a sulfide-based CE (CoS) in DSSCs, achieving an efficiency of 6.5% using a sensitizer Z907 and a eutectic melt electrolyte.12) Wu et al. synthesized counter electrodes of MoS2 and WS2. They obtained efficiencies (PCEs) of 7.59% and 7.73%, respectively, comparable to the device with a Pt CE (7.64%).13) Ag2S counter electrodes for DSSCs were synthesized by Huang et al. in 2015, obtaining efficiencies of 8.40%.14) Hybrid or composite counter electrodes (CEs) have enhanced DSSC performance. These materials are made of two or more components and exhibit a synergistic effect.15) The carbon aerogel-Ag2S has been studied, showing promissory results. HiuHiu, H. et al., in 2019, studied this system as a photocatalyst.16) Our research team has reported synthesizing and characterizing carbon aerogel electrodes with silver sulfide structures for electrochemical application.17) In the present study, we have expanded on this work by increasing the size and the amount of silver sulfide (Ag2S) structures in the carbon and tested them as counter electrodes in dye-sensitized solar cells, and this aims to provide alternatives to the conventional Platinum material for DSSC.
2. Experimental Procedure
Carbon aerogel (READE, Grade II) substrates were cut into 20 mm × 20 mm and coated with silver using a Ted Pella Silver target 99.9% placed in a Denton Vacuum Desk-V model sputtering. The working parameters were current 20 mAm, 0.072 Torr of pressure, and a gas-free atmosphere. The coating was applied using five different exposure times: 1, 2, 4, 8, and 12 minutes.
The following reactants produced a reactive sulfide atmosphere: 3 g of sublimated sulfur, 100 ml of deionized water, and carbon aerogel substrates coated with silver were placed inside a beaker. The top of the beaker was shielded with foil paper and sealed with thermal adhesive tape, then positioned inside an oven Ecoshell-HV50, with a constant temperature of 110°C, at atmospheric pressure for three hours. As a result, a new CA/Ag2S composite is created and will be characterized and analyzed for a Pt counter electrode replacement. This technique is called a solid-vapor reaction.
2.1 Electrodes preparation
Previously to the fabrication of DSSCs, preparation of the counter electrodes was carried out on a test cell bare electrode drilled (Solaronix, 74701) glass, using a conductive carbon double-sided tape (SPI 05072-AB 8 mm) that was placed in between the glass and the CA/Ag2S samples. A dye solution mixed with 25 ml of ethanol and 10 mg of Ruthenizer (Solaronix 535-bis TBA) was prepared to immerse TiO2 electrodes (Solaronix 74101) at room temperature for at least 24 hours before building the cells. Once the electrode and counter electrode were done and ready for assembling, the DSSCs, were placed together and filled with a liquid electrolyte (Solaronix Iodolyte AN-50 I-/I3-) to compare performance. An additional DSSC cell was fabricated with a conventional Pt counter electrode (Solaronix 74201).
2.2 Characterization
The structure of the five samples obtained was investigated by field emission scanning electron microscopy (SEM, Hitachi SU5000). Energy-Dispersive spectroscopy (EDS) was performed with the same equipment to acquire elemental chemical composition. Nanoparticle size was accomplished using Image J processing software. Electrical properties measurements (four-point probe technique with a 0 to 1 V sweep task) and efficiencies of DSSCs were performed with a “Keithley, model 2400 sourcemeter”. A solar simulator SunLite ABET technologies were used as a simulated sunlight source having an irradiance of 1000 W/m2, as measured using a standard reference cell under air mass 1.5 (AM1.5) conditions. XRD was performed to determine phase identification of the CA/Ag2S counter electrodes with X’Pert PRO PANalytical equipment.
Optical properties characterization was done with a StellarNet integrating sphere spectrometer. The Diffuse reflectance spectra were used to evaluate the optical band gap energy with the model of the Kubelka-Munk function.
| \begin{equation}
\text{F(R)} = (1-\text{R})2/\text{2R} = \text{k/s}
\end{equation}
| (1) |
Where, F(R) is the Kubelka-Munk function, R is the reflectance data, k is the absorption coefficient, and s is the scattering factor.
Electrochemical impedance spectra used a CS310 potentiostat with a CorrTest software V 5.2 to characterize the CA/Ag2S electrodes. Solution support of potassium chloride (0.1 M) combined with potassium ferrocyanide electrolyte (1 mM) with a frequency range from 0.01 Hz to 100 Hz, with 10 mV amplitude. Electrochemical impedance spectroscopy (EIS) calculations of the counter electrodes were executed with the CS studio 5 software, using an equivalent circuit of a resistor in series followed by a resistor and a capacitor in parallel, as shown in Fig. 6. Where, Rs is the solution resistance, Rp is the polarization resistance, and C is the capacitor. Various types of equivalent electrical models can be used to simulate different systems. A parallel circuit with a capacitor and a resistor is a characteristic representation of a Nyquist semi-circle, as this part of the Nyquist plot is denoted by the system’s reactions. No electric component could represent the diffusion of molecules, but it is represented by the Warburg impedance.18–20)
The impedance formula for the system is:
| \begin{equation}
\text{Z} = \text{Rs} + (\text{R} - \text{j$\omega$CR2}/1+\text{$\omega$2C2R2})
\end{equation}
| (2) |
Where Z is the total impedance, Rs is the solution resistance, R is the resistance of the resistor, j is the imaginary number, ω the frequency, and C the capacitance of the capacitor.21)
3. Results and Discussions
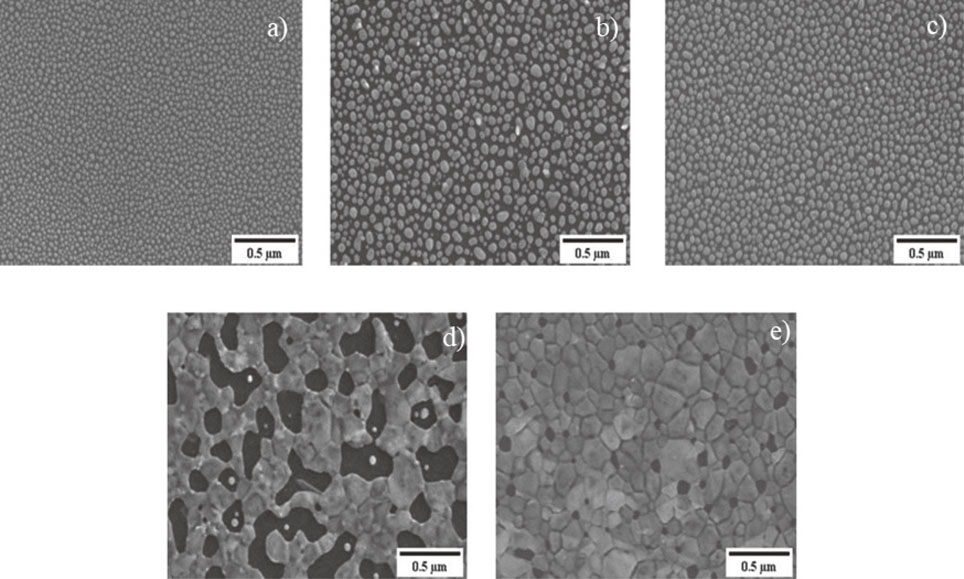
The counter electrode samples analyzed by Field emission scanning electron microscope revealed the Ag2S presence on the carbon aerogel with different microstructures for each counter electrode; times of silver deposition per sample and Ag2S structure size are detailed in Table 1. As the microstructure images are shown in Fig. 1, the longer Ag was deposited, the Ag2S silver structure size average increased. All samples were exposed to the same conditions for sulfidation, and the only difference within samples is the amount of silver deposited on the carbon aerogel, which plays a crucial role in Ag2S structure size through nucleation and growth. The silver sulfidation process in the presence of sulfur gas species involves the reaction between silver (Ag) and sulfur (S) to form silver sulfide (Ag2S). This process typically occurs when silver comes into contact with sulfur-containing gases, such as hydrogen sulfide (H2S) or sulfur dioxide (SO2) that are adsorbed onto the surface of the silver structures. This adsorption occurs due to the interaction between the sulfur molecules and the reactive sites on the silver surface. The adsorbed sulfur gas species dissociate into atomic sulfur (S) on the silver surface. This dissociation is typically facilitated by the heat or energy present in the system. The dissociated sulfur atoms react with the silver surface, forming silver sulfide through a chemical reaction. This reaction involves the bonding of sulfur atoms to silver atoms in a crystalline lattice structure.17,22)

Table 1 Silver deposition time, particle size and optical bandgap.
Elemental chemical analysis for the Ag2S electrodes was performed by energy-dispersive X-ray spectroscopy, which confirms the elements presents are Ag, S, and C. No impurities were found.
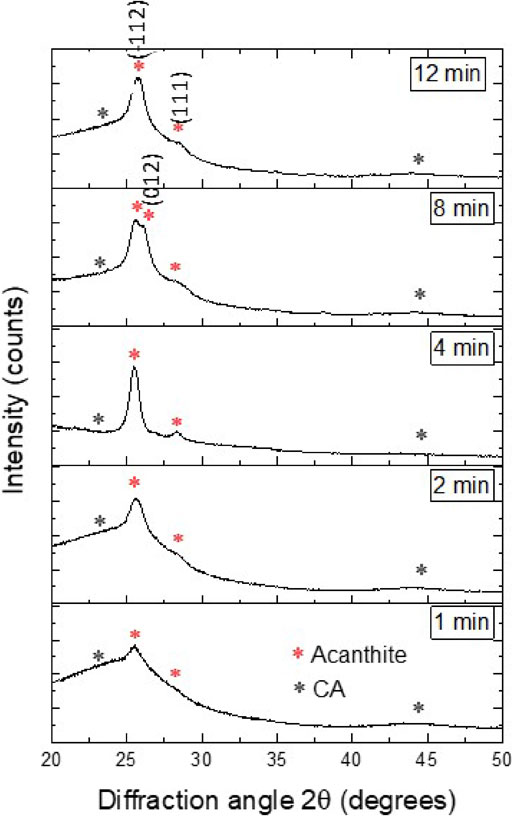
A composite of CA/Ag2S electrodes with deposition times of 1, 2, 4, 8, and 12 minutes was characterized by XRD. The diffractograms display peaks that were characterized as an acanthine phase of Ag2S, concerning JCPDS card number # 14-0074, which match the results for the equilibrium phase and what is reported in similar investigations, Garcia Martinez synthesized carbon aerogel to use in biosensors achieving similar patterns, Ortiz Diaz synthesized thin films, and the result of the investigation resemble values of this study.17,22) As well as a graphitic phase for carbon aerogel concerning JCPDS card number #22-1069, both broad reflection patterns were identified at just about the 23° and 43° 2θ angles. These results are shown in Fig. 2.
The results of UV-Vis diffuse reflectance spectroscopy characterization performed on carbon aerogel and CA/Ag2S composites with varying deposition times (1, 2, 4, 8, and 12 minutes) are presented in Fig. 3. Carbon aerogel showed the lowest absorption among the composites, with an absorption edge at 480 nm and an absorbance of 0.9. The 12-minute deposition sample exhibited the highest absorption, with an absorption edge at 570 nm and an absorbance of 0.31. For the 1-minute deposition sample, the absorption edge was observed at 610 nm with an absorbance of 0.18, while for the 2-minute deposition sample, the values were at 620 nm and 0.22, respectively. The 4-minute deposition sample showed values of 630 nm and 0.27 for the absorption edge and absorbance, respectively, and the 8-minute deposition sample exhibited values of 600 nm and 0.29 for the absorption edge and absorbance, respectively. The deposition of silver sulfide on the carbon aerogel substrate can alter its surface morphology and increase its effective surface area. This increased surface area provides more sites for light scattering and absorption, as the photons have a higher probability of interacting with the material. Consequently, the overall absorbance of the substrate can be enhanced. These findings are consistent with previous research by Martinez-Ruvalcaba,14) which reported that longer deposition times lead to increased absorbance due to a higher concentration of Ag2S.

Figure 4 shows Tauc plots of carbon aerogel and CA/Ag2S composites. The value of the energy band gap is determined by projecting a tangent to the resulting curve towards the x-axis; this point of intersection represents the bandwidth Eg.23) The energy band value for CA is 1.36 eV, a result comparable to that reported by Garcia Martinez. Results obtained for the CA/Ag2S composites at different deposition times are detailed in Table 1. An upward trend can be seen in the bandwidth values, where the value for the CA/Ag2S composite of 12 min is the highest with a value of 1.11 eV, and the lowest value obtained is 1 minute of deposit. These values are very similar to those reported by similar studies.17,24,25)

Table 2 and Fig. 5 show the values of open circuit voltages (Voc) that are very similar for the CA samples 2, 8, and 12 minutes of the deposit. In the 4-minute sample, a slightly higher value can be seen with a difference of 0.07 mV; the sample of 1 minute of deposit presents the highest value among all, reaching 0.7 mV; the difference between the values obtained is within a range of 0.1 mV, which does not exist a significant statistical difference. The Voc voltage values, even being low, remained practically constant for all the samples and matched with some results on carbon systems reported.26–28) These Voc values are below those reported by some authors in similar solar cells, ranging from 1.0 to 1.5 V.29)
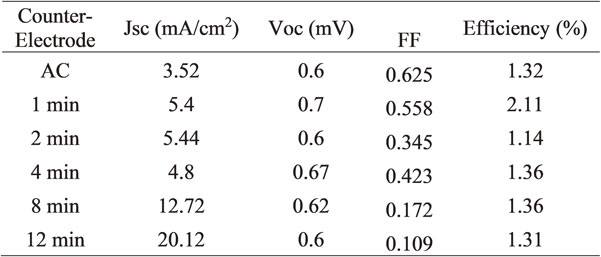
Table 2 Short circuit current density, open current voltage, fill factor, and efficiency of the DSSC.
Values were obtained for the fill factor, where the maximum value is for the CA sample with 0.625, and the lowest value obtained is for the 12-minute sample with 0.131. It can be seen in descending order in the results. The fill factor values are low, and this is because when performing the electrical test, the liquid electrolyte is absorbed in its entirety in the area where the DSSC receives the solar light; this results in a considerable drop in the fill factor result. There is also a more significant preferential trend in the speed of absorption of the liquid electrolyte for the deposition time; the longer the deposition time, the faster the liquid electrolyte is absorbed; this could be due to the catalytic properties reported for silver sulfide by Kryukov 2004 and Jiang 2005.30,31)
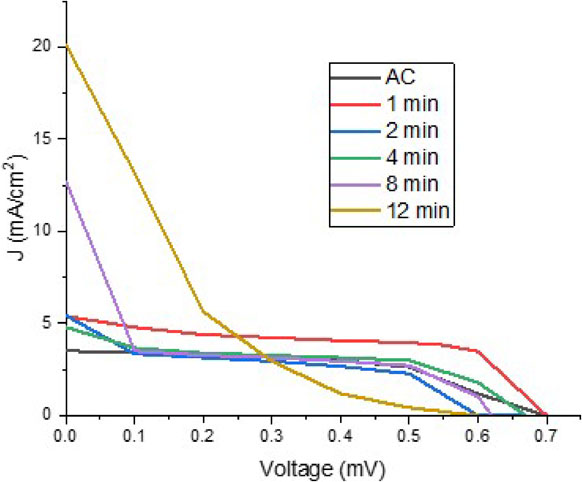
Table 2 also shows the values obtained for efficiency (η) in the solar cells, and it is observed that the values obtained are low and very similar, except for sample 2, which is higher. As mentioned above, the results for the efficiency were affected due to the excellent absorption capacity of the samples. Since the liquid electrolyte is absent, the test outcome is not expected to have great results. The current density values indicate an upward trend between the first CA sample and the last 12-minute deposit. For CA, the result is 3.5 mA/cm2; for 1 and 2 minutes samples, the same result of 5.4 mA/cm2 was obtained. It decreased a little to 4.8 mA/cm2 for the 4 minutes sample, the 8-minute sample reached a value of 12.7 mA/cm2, and the sample of 12 minutes of deposition increased to 20.1 mA/cm2; this suggests that the longer the Ag2S deposition time, the higher current density is obtained. Current intensity results are noteworthy, despite the system’s inherent instability. By ensuring that the liquid electrolyte is not absorbed in such a way, the point of stability in the system will have been achieved in the hope of having better results. Cells with a current density of 20 mA/cm2 and Voc of 0.6 volts (values similar to those obtained in this investigation) but with fill factors 0.6 showing efficiencies of approximately 12%.26)
The current-voltage (I-V) characteristic curves are shown in Fig. 5, and the pure carbon aerogel sample has a fill factor (FF) value of 0.625, the highest value achieved between all samples, and an efficiency (η) of 1.32%. The sample of 1 minute of silver deposit exhibits a 0.558 FF and 2.11% in η. For the sample with 2 minutes of the deposit, the FF was 0.345, and the η of 1.14%. Regarding the sample of 4 minutes of the deposit, the value obtained for the FF is 0.423, with a η of 1.36%. The sample of 8 minutes of deposit showed a FF of 0.172 and a η of 1.36%. The sample of 12 minutes of deposit has a FF of 0.109 and a η of 1.31%. The fast Jsc drop is appreciated for the samples with a longer deposition time, as mentioned above, which is because the CA/Ag2S counter electrode absorbs the electrolyte, the sample that presents the best stability is that of pristine CA, comparing values with similar systems, only the values of Voc and FF are close to those reported by Chen 2015,32) and in terms of Jsc and η they are lower.
Electrochemical impedance spectra (EIS) were obtained to comprehend the counter electrode performance better. Figure 6 shows the EIS analysis of the CA-Ag2S counter electrodes, where their ionic conductivity and resistivity can be compared. It is well known that equivalent series resistance (ESR) values on an impedance spectrum refer to equivalent series resistance, also known as loss resistance. A high ESR value indicates increased power loss in the system, which may be due to a poor connection, poor component quality, or a problem in circuit design.33) The estimated ESR values ranged from 13.72 to 16.68 Ω in this case. Pure carbon aerogel showed the lowest ESR values, and the sample with 8 and 12-minute exposure showed the highest ESR values indicating that as the presence of the silver sulfide phase increases, the sample’s resistance also increases; this does not agree with the conductivity values shown in Table 1 where Ag2S improves the aerogel conductivity. Therefore, this ESR increment could be explained by the effect of the interface between the carbon aerogel and the semiconductor that could act as a barrier to charge transfer between the two materials, which can increase the system’s resistance.34) However, these values do not significantly affect the solar cells’ efficiency since all the counter electrodes exhibit similar behavior.
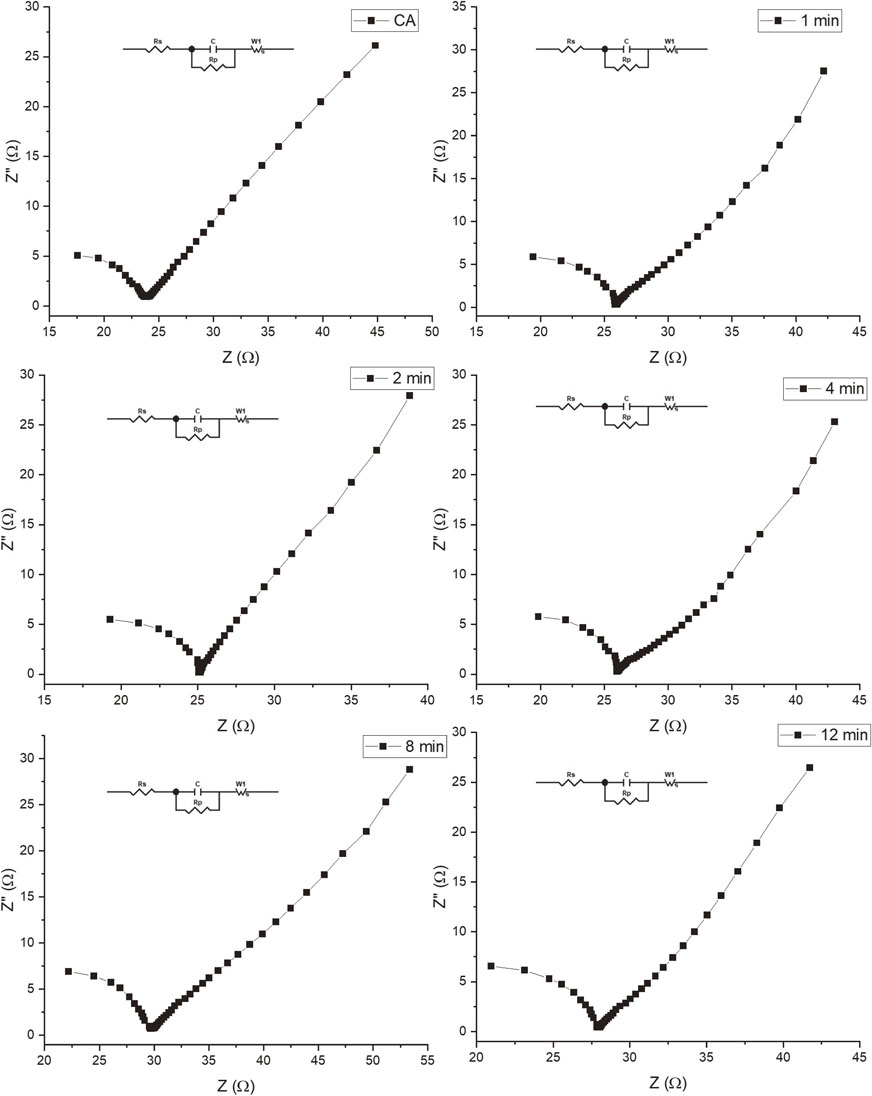
The semicircles found at high-frequency values are attributed to the counter electrode surface’s charge-transfer resistance (Rp). The resistance of the interface to the flow of charge causes the charge-transfer resistance. When an electrochemical reaction occurs at the interface, electrons are transferred between the electrode and the electrolyte, leading to charge buildup on either side. This charge buildup can lead to a potential difference across the interface, leading to a current flow. However, the interface can also act as a barrier to the flow of charge, leading to resistance to the current flow. The magnitude of the charge-transfer resistance depends on several factors, including the properties of the materials at the interface, the concentration of the species involved in the electrochemical reaction, and the reaction rate. In general, the charge-transfer resistance is proportional to the thickness of the interface, the density of states at the interface, and the electrochemical reaction rate.35) The lowest Rp values were for the pure carbon aerogel in this case. The highest Rp values were observed in the 8 and 12 min samples.
The W1-R value in the Nyquist plot describes the kinetics of the reaction. It is defined as the Warburg impedance and represents the resistance to species diffusion in the electrolyte. W1-R is calculated by subtracting the polarization resistance (Rp) from the total impedance (Z). This value is influenced by catalyst activity, reaction kinetics, and electrode surface area. A lower value of W1-R corresponds to a lower charge transfer resistance, indicating a higher catalytic activity of the electrode.36) The sample which shows the lowest value was the 12 min sample indicating a higher catalytical activity due to the increment of the Ag2S phase. This catalytic behavior could explain the high current values observed in the 12 samples when the voltage is applied in the DSSC cell.
The Z′ and Z′′ values in a Nyquist plot can provide valuable information about the microstructure of an electrode. The Z′ value corresponds to the natural component of the impedance, which represents the system’s resistance. It is associated with the ionic and electronic conductivities of the electrode and can provide information about the material’s properties. The highest Z′ values were found for the 8 and 12 min samples, indicating a high resistance in the material due to the high tortuosity of the electrode microstructure. The Z′′ value corresponds to the imaginary component of the impedance, which represents the reactance of the system. It corresponds to the capacitive properties of the electrode and can provide information about the material’s surface properties.37) The highest Z′′ value was found for the pure carbon aerogel, which indicates a higher capacitance of the electrodes or a higher double layer capacitance, which can be caused by factors such as the higher surface area or a higher electrochemical activity of the material.
4. Conclusion
Microstructures of CA/Ag2S composite and electrical and optical properties in different deposition times were investigated. Nanoparticles sizes in the range from 21 to 128 nm of silver sulfide with deposition times of 1, 2, 4, 8, and 12 minutes were successfully deposited on top of pure carbon aerogel by sputtering technique and synthesized by chemical vapor deposition to build a CA/Ag2S composite counter electrode to be used in DSSC. Findings have shown that, with increasing deposition time of silver on carbon aerogel, more significant nanoparticles and better electrical properties are obtained. Besides, absorbances improved from the 1-minute to the 12-minute samples by about 58% at wavelengths from 480 to 630 nm. Optical energy band gap values obtained are from 1.0 to 1.1 eV, and the counter electrode with better electrical and optical properties is one of 12 minutes deposit of silver sulfide. Efficiency achieved is low values compared to those reported for platinum and is a consequence of a poor fill factor (FF) that can be explained by the electrolyte loss that occurs during the cell testing due to the high aerogel absorption. However, the high initial Jsc values (21 mA/cm2) indicate a possible application of this composite in DSSC cells, subject to addressing the electrolyte loss issue. The electrochemical impedance spectra analysis provided valuable insights into the counter electrodes’ performance in DSSC cells. The equivalent series resistance (ERS) values indicated that the silver sulfide phase increased the samples’ resistance, possibly due to the interface between the carbon aerogel and the semiconductor acting as a barrier to charge transfer. The charge-transfer resistance (Rp) values showed that the lowest values were for the pure carbon aerogel, while the highest values were observed in the 8 and 12 min samples. The W1-R values indicated that the 12 min sample had a higher catalytic activity due to the increment of the Ag2S phase, explaining the high current values observed in the DSSC cell. Finally, the Z′ and Z′′ values provided information about the microstructure and surface properties of the electrodes, with the highest Z′ values found for the samples of 8 and 12 min indicating high resistance in the material, and the highest Z′′ value found for the pure carbon aerogel indicating a higher capacitance of the electrodes. Overall, these findings help to improve the understanding of the counter electrode performance in DSSC cells.
Acknowledgments
The authors would like to express their gratitude to the Universidad Autónoma de Ciudad Juárez for the financial support provided for this project (PIVA GRANT). Additionally, they extend their appreciation to CONAHCYT for awarding a scholarship to Luis Daniel Garcia Flores to support his PhD studies.
REFERENCES
- 1) H. Iftikhar, G.G. Sonai, S.G. Hashmi, A.F. Nogueira and P.D. Lund: Materials 12 (2019) 1998. doi:10.3390/ma12121998
- 2) Y.-J. Huang, P.K. Sahoo, D.-S. Tsai and C.-P. Lee: Molecules 26 (2021) 5186. doi:10.3390/molecules26175186
- 3) A.M. Bagher, M.M.A. Vahid and M. Mohsen: American Journal of Optics and Photonics 3 (2015) 94–113. doi:10.11648/j.ajop.20150305.17
- 4) J. Gong, K. Sumathy, Q. Qiao and Z. Zhou: Renew. Sustain. Energy Rev. 68 (2017) 234–246. doi:10.1016/j.rser.2016.09.097
- 5) A. Mbonyiryivuze, I. Omollo, B.D. Ngom, B. Mwakikunga, S.M. Dhlamini, E. Park and M. Maaza: Physics and Materials Chemistry 3(1) (2015) 1–6.
- 6) J. Theerthagiri, R.A. Senthil, K. Prabhakarn Arunachalam, A. Bhabu, A. Selvi, J. Madhavan, K. Murugan and A.K. Arof: Ionics 23 (2017) 1017–1025. doi:10.1007/s11581-016-1885-9
- 7) L. Jin, T. Liu and C. Wang: Appl. Phys. A 122 (2016) 606. doi:10.1007/s00339-016-0131-7
- 8) M. Kouhnavard, N.A. Ludin, B.V. Ghaffari, K. Sopian and S. Ikeda: ChemSusChem 8 (2015) 1510–1533. doi:10.1002/cssc.201500004
- 9) H. Chen, T. Liu, N. Wang, L. Zhao, Q. Zhao, J. Ren, H. He and H. Lin: Electrochim. Acta 174 (2015) 871–874. doi:10.1016/j.electacta.2015.06.082
- 10) C.-C. Wang and S.-Y. Lu: Nanoscale 7 (2015) 1209–1215. doi:10.1039/C4NR06118G
- 11) M.T.Z. Butt, K. Preuss, M.-M. Titirici, H.U. Rehman and J. Briscoe: Materials 11 (2018) 1171. doi:10.3390/ma11071171
- 12) W. Lee, Y.-S. Jun, J Park and G.D. Stucky: J. Mater. Chem. A 3 (2015) 24232–24236. doi:10.1039/C5TA08650G
- 13) M. Wu, Y. Wang, X. Lin, N. Yu, L. Wang, L. Wang, A. Hagfeldt and T. Ma: Phys. Chem. Chem. Phys. 13 (2011) 19298–19301. doi:10.1039/c1cp22819f
- 14) Q. He, S. Huang, J. Zai, N. Tang, B. Li, Q. Qiao and X. Qian: Chemistry 21 (2015) 15153–15157. doi:10.1002/chem.201502337
- 15) J. Wu, Z. Lan, J. Lin, M. Huang, Y. Huang, L. Fan, G. Luo, Y. Lin, Y. Xie and Y. Wei: Chem. Soc. Rev. 46 (2017) 5975–6023. doi:10.1039/C6CS00752J
- 16) H. Hu, W. Wei, Z. Jiang, W. Sun, X. Lv and J. Xie: J. Mol. Liq. 292 (2019) 111476. doi:10.1016/j.molliq.2019.111476
- 17) R.R.G. Martínez, C.A.R. González, J.F. Hernández-Paz, F.J. Vega, H.C. Montes and I.O. Armendáriz: Mater. Res. 24 (2021) e20200387. doi:10.1590/1980-5373-MR-2020-0387
- 18) S. Buteau and J.R. Dahn: J. Electrochem. Soc. 166 (2019) A1611–A1622. doi:10.1149/2.1051908jes
- 19) S. Buteau, D.C. Dahn and J.R. Dahn: J. Electrochem. Soc. 165 (2018) A228. doi:10.1149/2.0841802jes
- 20) X.-M. Liu, R. Zhang, Z.H.A.N. Liang, D.-H. Long, W.-M. Qiao, J. Yang and L.-C. Ling: N. Carbon Mater. 22 (2007) 153–158. doi:10.1016/S1872-5805(07)60015-8
- 21) R. Petibon: Study of Electrolyte Additives in Li-ion Batteries Using Electrochemical Impedance Spectroscopy on Symmetric Cells, (2013).
- 22) M. Díaz, M. Ramos-Murillo, J.E. Galindo, J.L. Enríquez-Carrejo, H. Montes and J.F. Hernández-Paz: Chalcogenide Lett. 13 (2016) 201–206.
- 23) H.I. Elsaeedy, A. Qasem, H.A. Yakout and M. Mahmoud: J. Alloy. Compd. 867 (2021) 159150. doi:10.1016/j.jallcom.2021.159150
- 24) H. Hu, W. Wei, Z. Jiang, W. Sun, X. Lv and J. Xie: J. Mol. Liq. 292 (2019) 111476. doi:10.1016/j.molliq.2019.111476
- 25) Q. Wu, M. Zhou, Y. Gong, Q. Li, M. Yang, Q. Yang and Z. Zhang: Catal. Sci. Technol. 8 (2018) 5225–5235. doi:10.1039/C8CY01522H
- 26) K. Sharma, V. Sharma and S.S. Sharma: Nanoscale Res. Lett. 13 (2018) 381–427. doi:10.1186/s11671-018-2760-6
- 27) C.-S. Wu, T.-W. Chang, H. Teng and Y.-L. Lee: Energy 115 (2016) 513–518. doi:10.1016/j.energy.2016.09.052
- 28) K. Imoto, M. Suzuki, K. Takahashi, T. Yamaguchi, T. Komura, J. Nakamura and K. Murata: Electrochemistry 71 (2003) 944–946. doi:10.5796/electrochemistry.71.944
- 29) K. Takagi, S. Magaino, H. Saito, T. Aoki and D. Aoki: J. Photochem. Photobiol. C 14 (2013) 1–12. doi:10.1016/j.jphotochemrev.2012.08.003
- 30) A.I. Kryukov, A.L. Stroyuk, N.N. Zin’chuk, A.V. Korzhak and S. Ya Kuchmii: J. Mol. Catal. A 221 (2004) 209–221. doi:10.1016/j.molcata.2004.07.009
- 31) Z.-J. Jiang, C.-Y. Liu and L.-W. Sun: J. Phys. Chem. B 109 (2005) 1730–1735. doi:10.1021/jp046032g
- 32) H. Chen, T. Liu, N. Wang, L. Zhao, Q. Zhao, J. Ren, H. He and H. Lin: Electrochim. Acta 174 (2015) 871–874. doi:10.1016/j.electacta.2015.06.082
- 33) H. Zhang, Q. Huang, H. Wang and X. Shi: IET Sci. Measur. Technol. 14 (2020) 494–498. doi:10.1049/iet-smt.2019.0131
- 34) P.F. Fleig, C.D.E. Lakeman and M. Fuge: “Capacitors with Low Equivalent Series Resistance”, U.S. Patent 7,864,507, issued January 4, (2011).
- 35) H.N. Tsao, J. Burschka, C. Yi, F. Kessler, M.K. Nazeeruddin and M. Grätzel: Energy Environ. Sci. 4 (2011) 4921–4924. doi:10.1039/c1ee02389f
- 36) Y. Liu, S. Yang, X. You, L. Qin, Y. Qin, W. Zhang and W. Liang: J. Alloy. Compd. 921 (2022) 165940. doi:10.1016/j.jallcom.2022.165940
- 37) M.E. Orazem and B. Tribollet: Electrochemical Impedance Spectroscopy, 1, (Wiley-Interscience, New Jersey, 2008) pp. 383–389.