Abstract
Distribution and concentration of certain organic compounds in drugs or biological tissue samples can provide key information to understand the behaviour and effect of that chemical species. In this study, we developed an analytical technique to perform mass spectrometry imaging for organic compounds under atmospheric pressure. The laser ablation technique was used as a sample introduction method to ablate a small amount of sample by focusing laser light onto the sample surface. Laser-induced sample particles were transferred by an argon gas stream to a newly developed plasma-based ion source for ionisation. The capability of this analytical method was demonstrated with the analysis of amino acids. Either protonated ([M+H]+) or ammoniated ([M+NH4]+) ions, with slight fragments, were observed for the amino acids and sugar, suggesting a fairly soft ionisation was achieved. Analytical repeatability defined by nine times repeated analysis was better than 10%. More importantly, linear correlations between the signal intensities and concentration of analytes were obtained for three amino acids (valine, methionine, and phenylalanine). With the present analytical technique, imaging analysis of several amino acids and sugar was carried out with a tablet sample. The resulting imaging can be used to evaluate the homogeneity of drug components both the within and among the tablets.
Introduction
The distribution and concentration of a chemical species within a solid sample is important to understand and elucidate the behaviour and effect of that chemical species on the sample. Spatial distribution of organic compounds in samples provides information to scientists to investigate the relation between spatial organisation, structure and function of molecules
[1-
3]. Imaging mass spectrometry is a sensitive approach to obtain spatial distribution information in solid samples. Imaging using mass spectrometry is conventionally performed by matrix-assisted laser/desorption ionisation-mass spectrometry (MALDI-MS) and secondary ionisation mass spectrometry (SIMS)
[4,
5]. Although soft ionisation can be achieved by these techniques, signal intensities of the target molecules can vary largely, as ionisation depend heavily on the sample preparation conditions and the choices of surface coating (matrix). Thus, these techniques are not suitable for quantitative analysis of organic compounds. Moreover, prior to the analysis, samples should be placed into the vacuum chamber, resulting in the analytical difficulty for biological tissues or tablet samples.
The scope of contemporary analytical mass spectrometry is expanded by a class of atmospheric pressure ionisation sources. Sample preparation requirement can be reduced, providing a significant advantage for real-time and in situ chemical analysis. In addition, samples can be preserved in their native environment. Desorption electrospray ionisation (DESI) has been applied as an imaging method for biological samples at ambient conditions
[6]. However, the use of solvent in DESI can be a problematic for samples that are sensitive to solvents. Meanwhile, plasma-based ionisation techniques such as direct analysis in real time (DART), flowing atmospheric pressure afterglow (FAPA), dielectric barrier discharge ionisation (DBDI) and low-temperature plasma (LTP) has proven to be successful in analysing compounds directly from untreated surfaces
[7-
10]. Plasma-based ionisation techniques have advantages including simplicity, portability and absence of solvents. Although these plasma-based ionisation techniques prove to be useful in analysing a variety of low-molecular-weight compounds, such as volatile organic compounds (VOCs), obtaining spatial information of the compounds in a solid sample still remains an issue.
Since sensitivity is crucial for the detection of small amounts organic compounds, an ion source that ionise compounds efficiently while generating a stable plasma is needed. Plasma sources in the corona discharge region are atmospheric pressure chemical ionisation (APCI) and direct analysis in real time (DART)
[7,
11]. These ion sources can only generate a limited number of reagent ions due to the low current used for corona discharges
[12]. Plasma sources that are produced at the normal glow regime (i.e., DBDI and LTP) have a dielectric barrier acting as a current-limiting device, which in-turn helps produce a more stable plasma
[12]. Nevertheless, the use of DBDI and LTP for quantitative studies are seldom reported. Lastly, plasma sources produced in the abnormal glow region (i.e., FAPA) produces more reagent ions than corona and glow discharges
[8]. However, they are not usually used for analytical purposes due to their instability
[12].
Laser ablation is widely known as a method for sample introduction of solid samples. Laser ablation is routinely combined with inductively coupled plasma-mass spectrometry (ICP-MS) for elemental analysis
[13]. LA-ICP-MS has advantages such as analysis of solid materials at atmospheric pressure, high spatial resolution and high sensitivity
[14-
16]. Wang et al. reported the first application of LA-ICP-MS on the imaging of elemental distribution in biological samples
[17]. Since then, LA-ICP-MS has flourished as a technique for imaging analysis of various solid samples. The ICP is a powerful ionisation source, allowing for reproducible results, which leads to good quantification capabilities. However, this property of the ICP is a trade-off with the lack of ability to obtain molecular information. Toward the goal of performing molecular imaging at atmospheric pressure, the laser ablation sampling method can be a useful tool when combined with a soft ionisation method.
Hence, in the present work, our aim is to develop an analytical method that has the ability to analyse solid samples under atmospheric pressure conditions, with minimal sample preparation, and without the use of matrices and solvents. Here, we develop an ion source, DBDI that can produce a stable and homogeneous plasma using glow discharge. We combine a UV femtosecond laser with the DBDI source as a soft ionisation method for organic compounds. Femtosecond laser was reported to reduce thermal diffusion into solid samples, producing smaller and stoichiometric aerosols
[18-
21]. The reduction in thermal degradation and vaporisation is important, especially when analysing biological samples, to preserve the integrity of the samples during analysis time and to ensure the highest possible resolution during imaging analysis. Here, we explore the use of LA-DBDI-MS in the direct analysis of low-molecular-weight compounds in solid samples. Low-molecular-weight compounds such as amino acids and sugars were analysed to demonstrate the potentials of this analytical technique. The characteristics of ions generated and the demonstration of reproducibility of the system, as well as imaging of organic compounds will be reported in this study.
Experimental Section
Reagents and Sample Preparation
Operational settings were optimised by maximising the ion signal of L-valine, L-methionine and L-phenylalanine. All reagents used were analytical grade, purchased from FUJIFILM Wako Pure Chemical Industries, Ltd. (Osaka, Japan). Table sugar, sold as stick packets (Mitsui Sugar Co., Ltd.), were purchased from the local supermarket. Prior to the analysis, powdered samples of the amino acids and sugar were pelletised for the laser sampling. About 50 mg of the amino acids were loaded onto a 7 mm-diameter die chamber and a pressing force of 1 ton (i.e., 250 MPa) was applied for 5 minutes using a hydraulic press (PIKE Technologies, Madison, USA) to form pellets. These powder pellets were directly subjected to laser ablation sampling.
Instrumentation
A femtosecond laser, equipped with Galvanometric mirrors (Jupiter Solid Nebulizer, ST Japan, Tokyo, Japan) was used as the laser ablation system in this study. The laser ablation technique was used as the sample introduction method to ablate a small amount of sample by focusing laser light onto the sample surface. Aerosols produced were transferred by an Ar gas stream at 0.3 L/min through a Tygon tube with FEP inner lining (VersilonTM SE-200, Saint-Gobain Performance Plastics, NJ, USA) to the ion source. The tube was 1 m in length, with a 6.4 mm o.d. and 3.2 mm i.d.
The ion source was an in-house atmospheric pressure plasma ion source. A schematic diagram of the instrumental setup is depicted in
Figure 1
. Plasma was produced by a dielectric barrier discharge (DBD). A quartz glass tube (o.d. 6 mm, i.d. 4 mm) was used as the body of the ion source. To produce a stable and homogeneous plasma, steel wool (internal electrode), acting as discharge stabiliser, was stuffed into the quartz tube, and 20 mm copper foil tape (external electrode) was wrapped around periphery of the quartz glass tube where the steel wool is. A copper wire (1 mm diameter), acting as cathode, was passed through the quartz tube and met with the steel wool. A high-voltage AC power supply, with frequency of 15–25 kHz (PCT-DFMJ-02AN, Plasma Concept Tokyo, Tokyo, Japan) was used to produce a plasma. A current of 20 mA and a peak-voltage of 10 kV was applied to the electrodes, while 0.6 L/min argon gas was flowed through the quartz tube, producing a plasma.
Prior to the ionisation by the atmospheric pressure plasma, laser induced sample particles were heated to evaporate the target molecules by passing through a heater made of a ceramic tube (o.d. 6 mm, i.d. 4 mm) with a Kanthal wire coiled around it. Organic molecules were evaporated and then ionised by collision with the reagent ions produced at the plasma. The resulting ions were then introduced into a hybrid dual quadrupole linear ion trap mass spectrometer (QTRAP 5500, AB SCIEX, Framingham, MA, USA). Vapur® interface (IonSense, Inc., Saugus, MA, USA) was applied to the mass spectrometer. A diaphragm vacuum pump (LABOPORT® N 810.3 FT.18, KNF Neuberger Inc., NJ, USA) was connected to the vacuum port of the Vapur ® interface to introduce more ions into the mass spectrometer. All analyses were acquired in positive ion mode at 650 K.
Imaging Analysis
For the imaging analysis, a commercially available Animalin L pharmacetical tablet (Taisho Pharmaceutical Co., Ltd., Tokyo, Japan) was used. The tablet was embedded in a photocurable resin (Acryl-one #2100N, Maruto Instrument Co., Ltd., Tokyo Japan) and exposed to light for one hour at room temperature. When the resin hardened, the sample was sectioned into half using IsoMet® 1000 (Buehler Ltd., IL, USA) and subjected to imaging analysis.
Analytical Procedure and Data Processing
Mass spectra were collected at a rate of 1000 Da/s, in the mass range of m/z 10–1000 using full scan mode (Q1). Galvanometric mirrors were used for fast repeated line scanning of the sample to give 15 s for each signal. The ablation area for each signal was 200 × 200 µm. Since high-purity samples were used, low laser conditions: fluence 1.5 J/cm2, repetition rate 100 Hz were used to prevent contamination of the mass spectrometer. Data processing was performed using Analyst (Version 1.7.1). Background correction was made by subtraction of the signal intensity data obtained without sample introduction (gas blank).
For repeatability and reproducibility experiments, quantitative evaluation experiments, and imaging analysis, signal intensities at the specific m/z values were monitored using selected ion monitoring (SIM) mode to obtain time-resolved signal intensity profiles. Analytical procedure and laser conditions when conducting repeatability and reproducibility experiments were the same (fluence 1.5 J/cm2, repetition rate 100 Hz, ablation area 200 × 200 µm). Dwell time per m/z was 100 ms. The measured signal intensities of each ablation area did not change much across the signal profile, thus, the signal intensity for each signal were calculated by integrating 10 s data.
For quantitative evaluation, solid mixing calibration method by implementing Galvanometric mirrors for fast-scanning of the laser on multiple solid materials was used
[22,
23]. Two powder pellets were placed side-by-side in the laser cell: a target analyte (amino acid) and a TiO2 (Kanto Chemical Co., Inc., Tokyo, Japan) pellet, for dilution purposes, were used to construct a calibration curve for each analyte. Laser ablation of the two materials was achieved with multiple laser ablation at different spots within very short time intervals. The mixing ratio of the two materials was adjusted by laser ablation with different proportion of number of laser shots onto the sample materials. This calibration protocol is explained in detail in previous studies
[22,
23]. Fluence of 1.5 J/cm2, repetition rate 1000 Hz was used. High repetition rate (e.g., >1000 Hz) is needed for the resulting aerosols of the two samples to be mixed well within the laser ablation cell. The total number of laser shots was 1000 shots, ablation cycle was within 1 s and repeated 15 times. The number of shots were adjusted as follows: ratio of target analyte and TiO 2 ratios were 0/1000, 1/999, 2/998, 5/995 and 10/990. Analysis was repeated three times. Total time for the laser ablation was fixed to 15 s, and signal intensities for 10 s were integrated. The ablated zones for the target analyte and TiO2 were measured by laser scanning confocal microscope (LEXT OLS3100, Olympus Corporation, Tokyo, Japan). Calibration curves were constructed based on the obtained signal intensities against the corrected concentration of the analyte.
Imaging analysis was conducted based on repeated line-profiling analysis across the sample with a raster speed of 50 µm/s. Fluence 1.2 J/cm 2 and repetition rate 2000 Hz was used for analysis. Data was acquired in SIM mode and dwell time per m/z was 50 ms. The raw data were exported as text files (.txt) and converted to comma separated values (CSV) formatted files. The data saved as the CSV format were then transported to an in-house software, iQuant2 for visualisation of the distribution of ingredients in the tablet
[24]. Background correction was also carried out using the iQuant2 software.
Results and Discussion
Characterisation of Ionisation Process
Representative mass spectra of the LA-DBDI-MS are shown in
Figure 2. Figures 2(a)–(c)
show the mass spectra of three amino acids and table sugar (sucrose). The base peaks of [M + H]+ were observed for the amino acids. Fragments such as [M −HCOOH + H]+ were also observed. The fragments observed in the mass spectra were consistent with fragmentation mechanism of amino acids reported in previous studies
[25,
26]. Moreover, the patterns of the mass spectra were similar with those obtained experimentally with dielectric barrier discharge by analysing amino acids deposited on filter paper
[9].
As for the mass spectrum of sucrose (
Figure 2(d)
), the dominant ion was the ammonium adduct [M + NH4]+ of the parent molecule instead of being protonated. Similar to the mass spectra of amino acids, fragments were observed. Polar molecules are known to form ammonium adducts
[27]. Since sucrose is a polar molecule, ammonium adduct of the molecule is formed more readily instead of the protonated molecule. All of the obtained mass spectra in
Figure 2
were similar to those obtained by DART-MS
[28,
29].
This study utilised a femtosecond laser, rather than nanosecond lasers usually used in previous studies for atmospheric pressure plasma-based ion source (i.e., FAPA, APCI, DBDI, and DART)
[30,
33]. The mass spectra obtained in this study had a similar trend with the previous studies, i.e., protonated molecules or ammonium adducts of the molecules are detected as base peaks, with slight fragmentation. This shows that the degree of fragmentation was independent on the pulse width of the laser. Instead, neutral molecules and small particles are mainly produced during the laser ablation process
[34]. Meanwhile, the tendency of the production of fragments increases as the supplemental heating temperature increases
[32].
Repeatability
To test the repeatability of the measurements, the signal intensity profile was acquired by the repeated-analysis from separated nine areas on a valine pellet.
Figure 3
illustrates the signal intensity profile of valine at m/z 118. The washout time for each signal was long, due to the low Ar carrier gas flow rate for aerosols, preventing the aerosols to be efficiently flushed out of the laser cell. The use of a higher carrier gas flow rate was hindered due to the configuration of the instrumental setup, which can be improved with further modifications to the system.
The mean counts of ion signals at m/z 118 was (197.3 ± 12.6) × 103 counts (N = 9, SD), suggesting that the repeatability of 6% could be achieved. The major cause of the variation of the signal intensities could be due to difference in the sampling mass of the sample powder through laser ablation. In fact, magnitude of variation found in this study was comparable with those obtained by elemental analysis of powder pellet with LA-ICP-MS
[35]. There could also be other causes of variations in the measured signal intensity, such as discharge current of the DBDI, temperature of the ceramic heater, or stability of mass spectrometer. Unfortunately, the evaluation of stability for these parameters are difficult, so these must be left as a possibility. In this study, we take the repeatability of signal intensity profile defined by the repeated analysis as the stability of overall system setup.
Signal Output Linearity
A correlation between signal intensity of the analytes and concentration is required to achieve accurate quantitative analysis. In this study, signal intensities of various concentrations were monitored for (a) valine, (b) methionine, and (c) phenylalanine (
Figure 4
). The concentration of the analytes was adjusted by the dilution with TiO2 through the solid sample mixing using the multiple-spot ablation
[18,
19]. Mass of the analyte and TiO2 was separately defined from the volume of each analysis, and the sampling mass was calculated based on equation (1), under the assumption that the density of each pellet is equal to the density of their respective bulks.
Here, m, C, and V represent the mass of the ablated material (g), concentration of the analyte (g/g), and volume of the ablated material (cm3), respectively. ρ denotes the density of the analyte (g/cm3). Concentration of the analyte was assumed to be >0.99 g/g for all samples based on their purity provided by the manufacturer. The volumes of the ablated materials were obtained by a laser scanning confocal microscope. The calculated mass of the target analyte was then divided by total ablated mass (mass of target analyte + mass of TiO 2) to calculate the concentration values. The resulting signal intensity were plotted against concentration to obtain the calibration curves. Each data point was repeated for three times, and errors bars were 2SD. Good linear correlations were found for all the amino acids. Moreover, the small error bars indicate that the aerosols of both materials (i.e., target analyte and TiO2) were mixed well within the laser ablation cell. Variation in hardness of pellets resulted in the difference in the final concentrations of each target analyte even though the same number of laser shots were used on all the three analytes. Besides that, the difference in ablation efficiency between the target analyte and TiO2, as well as the variation in transport efficiency of the ablated material into the mass spectrometer may have resulted in the deviation of the data points from the calibration lines and the ion detection response. The limits of detection for each analyte were determined as follows: 626 µg/g for valine, 668 µg/g for methionine, and 612 µg/g for phenylalanine. The above findings indicate that quantification is possible with the present LA-DBDI-MS system. Furthermore, our results are the first example of successfully constructing calibration lines of signal intensity response against concentration, compared to previous studies where laser ablation was coupled with a DBD ion source
[32,
36,
37].

Imaging Analysis
Finally, LA-DBDI-MS was applied for the imaging analysis of solid materials. A commercially-available Animalin L tablet was used as the sample. The cross section of the severed tablet (
Figure 5(a)
) has a boiled-egg-like structure, showing a white outer shell and a yellow inner core. This tablet is a sugar-coated tablet, which explains the white outer shell. The yellow inner core is the active ingredients, containing amino acids and vitamins.
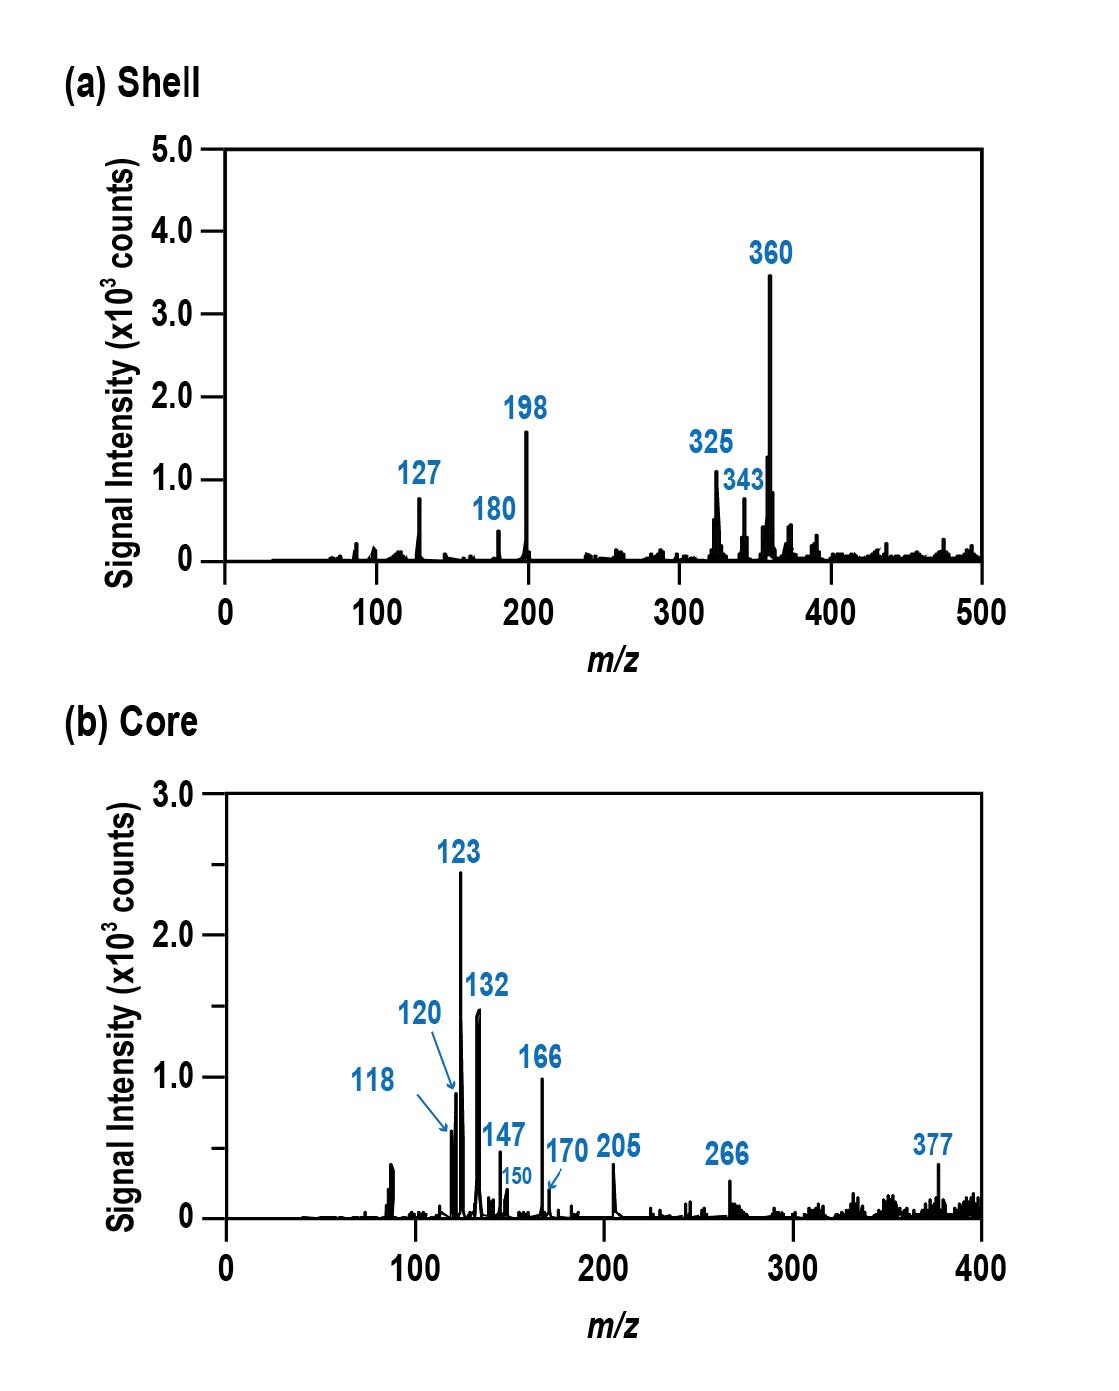
Prior to the imaging analysis, peak identification was carried out.
Figures 6(a)
and
6(b)
illustrate the mass spectrum obtained from the centre and edge of the tablet, respectively. The mass spectrum of the shell (
Figure 6(a)
) has a similar pattern with table sugar (sucrose) from
Figure 2(d)
, as well as reports from pharmaceutical manufacturers stating that the ingredient used in sugar-coated tablets is mainly sucrose
[38]. For the mass spectrum obtained from central part of the tablet (
Figure 6(b)
), several peaks at 118, 120, 132, 266, and 377 were detected. Based on the ingredients list by the manufacturer, these peaks originated from valine, threonine, leucine/isoleucine, vitamin B1, and vitamin B2, respectively. Other amino acids, such as methionine (m/z 150), phenylalanine (m/z 166), and tryptophan (m/z 205) were detected as well (imaging results not shown). Unfortunately, we were unable to distinguish between leucine and isoleucine due to these amino acids being isomers (both having molecular weight of 131.17). Peak assignment of the various ingredients is summarised in
Table 1
.
Next, the imaging analyses of sucrose, valine, threonine, leucine/isoleucine, vitamin B1, and vitamin B2 were carried out by the present system setup. The resulting imaging analysis are shown in
Figures 5(b)–5(g)
. Based on the imaging results, sucrose (detected as m/z 360) was distributed at the outer edges of the tablet, whereas all ingredients were heterogeneously distributed within the tablet, suggesting of formation of preferential enrichment of the ingredients within the tablet. The total analysis time for the imaging analysis was around 2.5 hours, with the time lengthen due to long washout time. Analysis time can be further shortened when improvements to the system is made.
Amino acids are an important class of metabolites which are involved in cell signalling, nutrition and disease therapy
[40,
41]. On the other hand, sucrose is an essential biomarker to assess sugar uptake associated with diseases such as metabolic syndrome, obesity, and cardiovascular problems
[41]. Knowledge of the spatial distribution of these molecules enhances our understanding of pharmacology and toxicology mechanisms, contributing to drug development. The above results demonstrated that LA-DBDI-MS can be an analytical method to study the distribution of low-molecular-weight compounds in solid samples.

Table 1.
List of ions at the core of the tablet and their corresponding ingredients.
| Detected m/z
|
Ingredient |
Molecular weight |
| 118 |
Valine |
117.15 |
| 120 |
Threonine |
119.12 |
| 123 |
Nicotinamide (Vitamin B3)
|
122.12 |
| 132 |
Leucine
Isoleucine
|
131.17 |
| 147 |
Lysine |
146.19 |
| 150 |
Methionine |
149.21 |
| 166 |
Phenylalanine |
165.19 |
| 170 |
Pyridoxine (Vitamin B6)
|
169.18 |
| 205 |
Tryptophan |
204.22 |
| 266 |
Thiamine (Vitamin B1)
|
265.35 |
| 377 |
Riboflavin (Vitamin B2)
|
376.36 |
Conclusion
This work has demonstrated that coupling laser ablation with an atmospheric pressure plasma-based ion source is possible for mass spectrometry imaging of organic compounds. Mass spectra of organic compounds obtained in this study showed that the ion source developed primarily ionises sample material into protonated molecular ions and ammonium adducts of the molecular ions with few fragments. This indicates that although DBDI is not as soft as ionisation methods such as MALDI or electrospray ionisation (ESI), it is definitely softer than electron impact (EI). LA-DBDI-MS gives good stability and repeatability, as well as good quantitative capability. Limits of detection were rather high, at above 600 µg/g for all measured analytes, but sensitivity could be improved by using helium to generate plasma or modifying the configuration of the laser ablation and ion source. Finally, this preliminary work shows that rapid imaging analysis of pharmaceuticals is promising, which does not require any solvent or matrices, allowing us to analyse solid samples in their native state. Future works will involve combining the current instrumentation with LA-ICP-MS to simultaneously obtain spatial information on elements through a single analysis. We hope that through this future work, we will be able to provide visualised data on the distribution of elements and organic compounds, as well as provide a metallomics perspective on the interaction of elements with organic compounds within biological samples.
Acknowledgments
We are grateful to the following people for their support, without whose help this work would never have been possible: Takahiro Kanamori and Yoshihiro Ichido from Eurofins Analytical Science Laboratories, Inc. for providing the mass spectrometer as well as scientific advice, Tetsuya Tamaki (Next Lab) for technical assistant of the laser system, Takao Nishiguchi (BioChromato, Inc.) for technical support on the Vapur® interface used in this study, Prof. Hiroyuki Kagi (The Univ. of Tokyo) for scientific advice and technical assistance of the laser scanning confocal microscope, and Shuji Yamashita (The Univ. of Tokyo) for critical reading the manuscript. This work was financially supported by a Grant-in-Aid for Scientific Research (JP 19H01081 and JP 21H04511) from the Ministry of Education, Culture, Sports, Science and Technology, Japan.
Statements about COI
The authors declare no conflict of interest associated with this manuscript.
References
- [1]
Hanash
S
:
Disease proteomics.
Nature
422:
226–
232,
2003.
- [2]
Roher
AE
,
Weiss
N
,
Kokjohn
TA
,
Kuo
Y
,
Kalback
W
,
Anthony
J
,
Watson
D
,
Luehrs
DC
,
Sue
L
,
Walker
D
,
Emmerling
M
,
Goux
W
,
Beach
T
:
Increased Aβ Peptides and Reduced Cholesterol and Myelin Proteins Characterize White Matter Degeneration in Alzheimer’s Disease.
Biochemistry
41(
37):
11080–
11090,
2002.
- [3]
Niziol
J
,
Sunner
J
,
Beech
I
,
Ossolinski
A
,
Ossolinski
T
,
Plaza
A
,
Ruman
T
:
Localization of Metabolites of Human Kidney Tissue with Infrared Laser-Based Selected Reaction Monitoring Mass Spectrometry Imaging and Silver-109 Nanoparticle-Based Surface Assisted Laser Desorption/Ionisation Mass Spectrometry Imaging.
Anal. Chem.
92(
6):
4251–
4258,
2020.
- [4]
Caprioli
RM
,
Farmer
TB
,
Gile
J
:
Molecular Imaging of Biological Samples: Localization of Peptides and Proteins Using MALDI-TOF MS.
Anal. Chem.
69(
23):
4751
4760,
1997.
- [5]
Pacholski
ML
,
Winograd
N
:
Imaging with Mass Spectrometry.
Chem. Rev.
99(
10):
2977–
3005,
1999.
- [6]
Takáts
Z
,
Wiseman
JM
,
Gologan
B
,
Cooks
RG
:
Mass spectrometry sampling under ambient conditions with desorption electrospray ionisation.
Science
306:
471–
473,
2004.
- [7]
Cody
RB
,
Larameé
JA
,
Durst
HD
:
Versatile new ion source for the analysis of materials in open air under ambient conditions.
Anal. Chem.
77(
8):
2297–
2302,
2005.
- [8]
Andrade
FJ
,
Shelley
JT
,
Wetzel
WC
,
Webb
MR
,
Gamez
G
,
Ray
SJ
,
Hieftje
GM
:
Atmospheric Pressure Chemical Ionisation Source. 1. Ionisation of Compounds in the Gas Phase.
Anal. Chem.
80(
8):
2646–
2653,
2005.
- [9]
Na
N
,
Zhao
M
,
Zhang
S
,
Yang
C
,
Zhang
X
:
Development of a dielectric barrier discharge ion source for ambient mass spectrometry.
J. Am. Soc. Mass Spectrom.
18(
10):
1859–
1862,
2007.
- [10]
Harper
JD
,
Charipar
NA
,
Mulligan
CC
,
Zhang
X
,
Cooks
RG
,
Ouyang
Z
:
Low-temperature plasma probe for ambient desorption ionisation.
Anal. Chem.
80(
8):
9097–
9104,
2008.
- [11]
Horning
EC
,
Horning
MG
,
Carroll
DI
,
Stillwell
RN
:
New Pictogram Detection System Based on a Mass Spectrometer with an External Ionisation Source at Atmospheric Pressure.
Anal. Chem.
45(
6):
936–
943,
1973.
- [12]
Molnar
BT
,
Shelley
JT
:
Modern Plasma-based Desorption/Ionisation: From Atoms and Molecules to Chemical Synthesis.
Mass Spectrom. Rev.
40(
5):
609–
627,
2020.
- [13]
Gray
AL
:
Solid Sample Introduction by Laser Ablation for Inductively Coupled Plasma Source Mass Spectrometry.
Analyst
110:
551–
556,
1985.
- [14]
Becker
JS
,
Zoriy
M
,
Matusch
A
,
Wu
B
,
Salber
D
,
Palm
C
,
Becker
JS
:
Bioimaging of metals by laser ablation inductively coupled plasma mass spectrometry (LA-ICP-MS).
Mass Spectrom. Rev.
29(
1):
156–
157,
2010.
- [15]
Koch
J
,
Günther
D
:
Review of the state-of-the-art of Laser Ablation Inductively Coupled Plasma Mass Spectrometry.
Appl. Spectrosc.
65(
5):
155A–
162A,
2011.
- [16]
Makino
Y
,
Ohara
S
,
Yamada
M
,
Mukoyama
S
,
Hattori
K
,
Sakata
S
,
Tanaka
Y
,
Suzuki
T
,
Shinohara
A
,
Matsukawa
T
,
Yokoyama
K
,
Hirata
T
.
Quantitative Elemental Bioimaging Protocol using Femtosecond-Laser Ablation-ICP-Mass Spectrometry Coupled with Glass Standard Reference Material. Ogra & Hirata (ed): Metallomics.
Recent Analytical Techniques and Applications. Springer,
Tokyo,
2017,
93–
106.
- [17]
Wang
S
,
Brown
R
,
Gray
DJ
:
Application of Laser Ablation-ICPMS to the Spatially Resolved Micro-analysis of Biological Tissue.
Appl. Spectrosc.
48(
11):
1321–
1325,
1994.
- [18]
Koch
J
,
von Bohlen
A
,
Hergenröder
R
,
Niemax
K
:
Particle size distributions and compositions of aerosols produced by near-IR femto-and nanosecond laser ablation of brass.
J. Anal. At. Spectrom.
19:
267–
272,
2004.
- [19]
Hergenröder
R
,
Samer
O
,
Hommes
V
:
Femtosecond laser ablation elemental mass spectrometry.
Mass Spectrom. Rev.
25:
551–
572,
2006.
- [20]
Fernández
B
,
Claverie
F
,
Pécheyran
C
,
Donard
OFX
:
Direct analysis of solid samples by fs-LA-ICP-MS.
Trends in Anal. Chem.
26(
10):
951–
966,
2007.
- [21]
Poitrasson
F
,
d’Abzac
FX
:
Femtosecond laser ablation inductively coupled plasma source mass spectrometry for elemental and isotopic analysis: are ultrafast lasers worthwhile?
J. Anal. At. Spectrom.
32:
1075–
1091,
2017.
- [22]
Yokoyama
TD
,
Suzuki
T
,
Kon
Y
,
Hirata
T
: Determinations of Rare Earth Element Abundance and U-Pb Age of Zircons U-Pb Age of Zircons Using Multispot Laser Ablation-Inductively Coupled Plasma Mass Spectrometry.
Anal. Chem.
83(
23):
8892–
8899,
2011.
- [23]
Makino
Y
,
Kuroki
Y
,
Hirata
H
:
Determination of major to trace elements in metallic materials based on the solid mixing calibration method using multiple spot-laser ablation-ICP-MS.
J. Anal. At. Spectrom.
34(
9):
1794–
1799,
2019.
- [24]
Suzuki
T
,
Sakata
S
,
Makino
Y
,
Obayashi
H
,
Ohara
S
,
Hattori
K
,
Hirata
T
:
iQuant2: Software for Rapid and Quantitative Imaging using Laser Ablation-ICP Mass Spectrometry.
J. Mass Spectrom.
7(
1):
A0065,
2018.
- [25]
Klassen
JS
,
Kebarle
P
:
Collision-Induced Dissociation Threshold Energies of Protonated Glycine, Glycinamide, and Some Related Small Peptides and Peptide Amino Amides.
J. Am. Chem. Soc.
119(
28):
6552–
6563,
1997.
- [26]
O’Hair
RA
,
Broughton
PS
,
Styles
ML
,
Frink
BT
,
Hadad
CM
:
The Fragmentation Pathways of Protonated Cycline: A Computational Study.
J. Am. Chem. Soc.
11(
8):
687–
696,
2000.
- [27]
Cody
RB
:
Observation of Molecular Ions and Analysis of Nonpolar Compounds with the Direct Analysis in Real Time Ion Source.
Anal. Chem.
81(
3):
1101–
1107,
2009.
- [28]
Sekimoto
K
,
Sakakura
M
,
Kawamukai
T
,
Hike
H
,
Shiota
T
,
Usui
F
,
Bando
Y
,
Takayama
M
:
Ionisation characteristics of amino acids in direct analysis in real time mass spectrometry.
Analyst
139:
2589–
2599,
2014.
- [29]
Wang
Y
,
Liu
L
,
Ma
L
,
Liu
S
:
Identification of saccharides by using direct analysis in real time (DART) mass spectrometry.
Int. J. Mass. Spectrom.
357:
51–
57,
2014.
- [30]
Shelley
JT
,
Ray
SJ
,
Hieftje
GM
:
Laser Ablation Coupled to a Flowing Atmospheric Pressure Afterglow for Ambient Mass Spectral Imaging.
Anal. Chem.
80(
21):
8308–
8313,
2008.
- [31]
Herdering
C
,
Reifschneider
,
Wehe
CA
,
Sperling
M
,
Karst
U
:
Ambient molecular imaging by laser ablation atmospheric pressure chemical ionisation mass spectrometry.
Rapid Commun. Mass Spectrom.
27(
23):
2595–
2600,
2013.
- [32]
Gilber-López
B
,
Schilling
M
,
Ahlmann
N
,
Michels
A
,
Hayen
H
,
Molina-Díaz
A
,
García-Reyes
,
Franzke
J
:
Ambient Diode Laser Desorption Dielectric Barrier Discharge Ionisation Mass Spectrometry of Nonvolatile Chemicals.
Anal. Chem.
85(
6):
3174–
3182,
2013.
- [33]
Fowble
KL
,
Teramoto
K
,
Cody
RB
,
Edwards
D
,
Guarrera
D
,
Musah
RA
:
Development of “Laser Ablation Direct Analysis in Real Time Imaging” Mass Spectrometry: Application to Spatial Distribution Mapping of Metabolites Along the Biosynthetic Cascade Leading to Synthesis of Atropine and Scopolamine in Plant Tissue.
Anal. Chem.
89(
6):
3421–
3429,
2017.
- [34]
Conzemius
RJ
,
Capellen
JM
:
A review of the applications to solids of the laser ion source in mass spectrometry.
Int. J. Mass Spectrom. Ion Phys.
34(
3–4):
197–
271,
1980.
- [35]
Kon
Y
,
Hirata
T
:
Determination of 10 major and 34 trace elements in 34 GSJ geochemical reference samples using femtosecond laser ablation ICP-MS.
Geochem. J.
49(
4):
351–
375,
2015.
- [36]
Bierstedt
A
,
Riedel
J
:
High-repetition rate laser ablation coupled to dielectric barrier discharge postionisation for ambient mass spectrometry.
Methods
104:
3–
10,
2016.
- [37]
Funke
SKI
,
Brückel
VA
,
Weber
M
,
Lützen
E
,
Wolf
JC
,
Haisch
C
,
Karst
U
:
Plug-and-play laser ablation-mass spectrometry for molecular imaging by means of dielectric barrier discharge ionisation:
Analytica Chimica Acta
1177:
338770,
2021.
- [38]
Hogan
JE
. Sugar Coating.
Cole
G (ed)
:
Pharmaceutical Coating Technology.
Taylor & Francis,
London,
1995,
53–
64.
- [39]
Wu
G
:
Functional Amino Acids in Growth, Reproduction, and Health.
Adv. Nutr.
1(
1):
31–
37,
2010.
- [40]
Huang
C
,
McConathy
J
:
Radiolabeled Amino Acids for Oncologic Imaging.
J. Nucl. Med.
54(
7):
1007–
1010,
2013.
- [41]
Tasevska
N
:
Urinary sugar – a biomarker of total sugars intake.
Nutrients
7:
5816–
5833,
2015.