Abstract
Background: We aimed to investigate the correlation between hepcidin mRNA expression and the pathophysiology of the liver or the long-term prognosis in patients with chronic hepatitis C (CHC) or liver cirrhosis (LC).
Methods: A total of 82 patients with CHC or LC who underwent liver biopsy were included in this study. Hepcidin mRNA expression was detected in the frozen liver tissues obtained from patients with CHC or LC who underwent liver biopsy. Hepcidin mRNA expression in frozen liver tissues was assessed using real-time quantitative polymerase chain reaction. We previously reported that the extent of proliferation of atypical hepatocytes (POAH) within the six-cell lesion of irregular regeneration (IR) of hepatocytes is a significant histological finding associated with the development of hepatocellular carcinoma (HCC) from CHC or LC. Therefore, we investigated the association between hepcidin mRNA expression and disease severity, pathological findings such as the extent of POAH, and the incidence of HCC development from CHC and LC. Furthermore, we compared hepcidin mRNA expression with serum cytokine and chemokine levels using a Bio-plex suspension array system (Bio-Rad Laboratories, CA, USA).
Results: Hepcidin mRNA expression was associated with serum ferritin concentration (p=0.009) and unsaturated iron-binding capacity (P=0.0003) in the serological parameters, but no association was found with histological parameters. The cumulative incidence of HCC development was significantly higher in the low hepcidin mRNA expression group than in the high hepcidin mRNA expression group (p=0.003). Additionally, patients with lower hepcidin mRNA levels tended to exhibit more extensive POAH (p=0.0089). Hepcidin mRNA expression was also significantly associated with apoptosis-related and anti-inflammatory cytokines/chemokines.
Conclusions: Low hepcidin mRNA expression may be a risk factor for carcinogenesis in patients with CHC or LC.
Introduction
Although iron is an essential element for the human body, excessive amounts of free iron (Fe2+) can be toxic. Excess iron can catalyze the formation of free radicals, which may lead to various cellular disorders. Therefore, the human body tightly regulates intracellular iron levels and the peptide hormone hepcidin, plays a crucial role by binding to the iron export transporter ferroportin (FPN) [1]. Elevated serum iron levels results in rapid inhibition of iron transport [2] and the degradation of cell-surface FPN [3-6], which in turn inhibits FPN-mediated dietary iron absorption and iron release from intracellular iron stores. As a result, dysregulation of hepcidin or FPN expression can lead to iron disorders in humans.
Hepcidin expression in the liver is a complex process that is regulated by various factors including iron overload and inflammation which increase hepcidin expression, whereas hypoxia and erythropoiesis decrease expression [7-9]. In patients with chronic viral liver disease, hepcidin expression has also been reported to influence hepatic morbidity and pathophysiology [10-12]. We hypothesized that hepatic hepcidin expression is associated with liver morbidity in nonalcoholic steatohepatitis (NASH). Therefore, we previously investigated hepatic hepcidin expression using a rat model of NASH development [13], and found that hepcidin mRNA expression decreases with the progression of NASH, which led us to speculate that hepcidin may be linked to the pathogenesis of NASH.
According to reports, hepcidin is involved in the progression of steatohepatitis, including NASH and metabolic dysfunction-associated steatotic liver disease [14-16]. Impaired iron translocation from the hepatocytes and Kupffer cells is the primary cause of iron accumulation in nonalcoholic fatty liver disease. Impaired iron transport is associated with inflammation and metabolic abnormalities that affect iron regulators, such as hepcidin, ferroportin, transferrin receptors, ferritin, and copper [17,18].
Furthermore, our previous research revealed that phlebotomy in patients with chronic hepatitis C (CHC) or liver cirrhosis (LC) can reduce transaminase levels and the cumulative incidence of hepatocellular carcinoma (HCC) development in patients with CHC and LC [19]. Therefore, we hypothesized iron overload is associated with the progression of CHC or LC and the development of HCC from CHC or LC. We have also reported that intrahepatic iron concentration affects the pathogenesis of chronic hepatitis [20]. Herein, we hypothesized that liver iron overload and hepcidin mRNA expression in the liver are linked to the severity of liver disease and the development of HCC.
Regarding histological factors that are associated with carcinogenesis in liver sections, the degree of irregular regeneration (IR) of hepatocytes was reported by Uchida et. al. [21-23]. The theory of the IR of hepatocytes was proposed by Peters [24] and Uchida [21-23]. The IR of hepatocytes in lobules is a general term encompassing anisocytosis of hepatocytes, map-like distribution, nodular arrangement of parenchyma, oncocytic change of hepatocytes, proliferation of atypical hepatocytes, and bulging of hepatocytes.
Recently, we defined the grade according to the IR of each group of hepatocytes, and examined the correlation between the IR grade in hepatocytes and the occurrence of HCC in chronic hepatitis C or cirrhosis [25]. The analysis revealed that the extent of proliferation of atypical hepatocytes (POAH) was a strong histological risk factor for HCC development. Atypical hepatocytes are generally characterized by smaller cells with a higher nucleoplasmic (N/C) ratio, nuclei that show mild size disparity, cytoplasm with enhanced eosinophilia, a clear distinction between atypical and normal hepatocytes, and the absence of fat droplets [26,27]. It has been reported that the degree of proliferation of atypical hepatocytes (POAH) within the six-cell lesion of IR of hepatocytes is a significant histological finding associated with the development of HCC from CHC or LC [19,23,25]. Therefore, we hypothesized that the level of expression of hepcidin mRNA in chronic hepatitis represents a highly carcinogenic state of the liver. Hence, we investigated the relationship between liver histology, including the extent of POAH and hepcidin mRNA expression.
We then examined the cytokines/chemokines that regulate hepcidin mRNA expression using a multiplex cytokine assay to detect serum cytokine/chemokine concentrations. Based on these studies, we investigated whether hepcidin mRNA expression levels are associated with the progression of liver disease and the development of HCC from CHC and LC. The expression of hepcidin mRNA was quantified using the formula: ΔCt = Ct for hepcidin gene test : − Ct glyceraldehyde−3−phosphate dehydrogenase (GAPDH) test.
Materials and methods
-
Participants
The study population comprised 82 hepatitis C virus (HCV) RNA-positive patients who underwent liver biopsy at Nihon University Itabashi Hospital between January 1, 2001 and December 25, 2008. These patients were selected based on the feasibility of using cryopreserved liver biopsy specimens. The participants were HCV RNA-positive patients with CHC or LC who consented to long-term prognostic evaluation and participation in the study. The clinical characteristics of the patients are presented in Table 1. The enrolled patients were assigned an F stage according to the INUYAMA and Demet classification, with F0 to F3 designated as CHC, and F4 as LC [28,29].
Of the 82 patients, 49 whose cytokine and chemokine levels were previously measured [30] were analyzed for correlations between hepcidin mRNA expression and cytokine and chemokine concentrations. These patients comprised 27 males and 22 females and were classified into four F stages as follows: F1 (n=21), F2 (n=13), F3 (n=6), and F4 (n=9).
Table 1.Clinical profiles of participants (n=82)
|
Chronic hepatitis
(F0 to F3) |
Liver cirrhosis
(F4) |
| number |
63 |
19 |
| observation periods (yrs) |
8.8 (0.1-14.1) |
6.3 (0.4-12.4) |
| age (yrs) |
54.0 (23.5-73.7) |
59.8 (44.8-74.1) |
| gender (males) |
35 (54.7%) |
9 (47.4%) |
| AST (U/L) |
44.5 (15-183) |
74.0 (40-129) |
| ALT (U/L) |
55.5 (10-328) |
79.0 (45-138) |
| r-GT (U/L) |
39.0 (10-303) |
50.0 (24-128) |
| ALP (U/L) |
246.0 (111-624) |
331.0 (163-1370) |
| total bilirubin (mg/dl) |
0.60 (0.25-1.47) |
0.70 (0.40-1.38) |
| platelet counts(x104)
|
18.2 (7.3-38.1) |
11.9 (9.6-22.8) |
| total protein (g/dl) |
7.2 (6.1-8.6) |
7.3 (6.7-8.6) |
| albumin (g/dl) |
4.0 (3.4-4.7) |
3.6 (3.1-6.9) |
| prothrombin time (%) |
96 (69-100) |
92 (79-100) |
| BTR |
5.94 (4.06-12.20) |
5.29 (2.82-8.00) |
| BCAA |
489 (352-677) |
477 (259-825) |
| tyrosine |
83 (40-126) |
92 (63-151) |
| ammonia (µg/dl) |
|
|
| ICGR15 (%) |
7.0 (1.4-21.2) |
14.0 (2.1-71.1) |
| zinc concetration (µg/dl) |
74 (47-101) |
64 (48-100) |
| F stages |
| F0 |
0 |
|
| F1 |
32 (50.8%) |
|
| F2 |
21 (33.3%) |
|
| F3 |
9 (14.3%) |
|
| F4 |
|
19 |
| HCV RNA |
| high |
52 (82.5%) |
17 (89.5%) |
| low |
11 (17.5%) |
2 (10.5%) |
| Serotype |
| 1 |
41 (49.4%) |
12 (14.5%) |
| 2 |
22 (26.6%) |
7 (8.4%) |
Abbreviations: BCAA, branched chain amino acids; BTR, BCAA to tyrosine molar ratio; CH, chronic hepatitis; LC, liver cirrhosis; AST, aspartate amino transferase; ALT, alanine aminotransferase; ALP, alkaline phosphatase; Γ-GT, γ-glutamyltransferase; ICGR15, the retention rate of indocyanine green at 15 min, HCV RNA high, ≥106copy/mL; HCV RNA low, <105copy/mL
-
Clinical and laboratory evaluation of patients with CHC and LC
Serum and liver biopsy specimens were collected at the time of liver biopsy and stored at −80°C until analysis. Samples were only collected from the patients who provided informed consent for their serum samples to be stored for subsequent laboratory analysis. The exclusion criteria for CHC and LC were as follows: age < 18 years, habitual alcohol consumption (> 30 g ethanol/day), presence of hepatitis B surface antigen (enzyme-linked immunosorbent assay (ELISA); Abbott Tokyo, Japan), presence of anti-smooth muscle antibody (fluorescent antibody method; FA), presence of anti-mitochondrial M2 antibody (enzyme immunoassay; EIA), and current intravenous drug use. All patients were positive for serum HCV RNA and were followed up for > 1 year. A definitive diagnosis of HCC was obtained using abdominal angiography or liver tumor biopsy. HCC nodules were evaluated every 3–12 months if detected using contrast-enhanced abdominal ultrasonography or enhanced CT. All patients were closely followed up for HCC development at our outpatient clinic until May 31, 2020.
-
Hematological and biochemical examinations
The serum concentrations of aspartate aminotransferase (AST), alanine aminotransferase (ALT), alanine phosphatase (ALP), γ-glutamyl transpeptidase (γ-GT), total bilirubin, total protein (TP), albumin (Alb), branched-chain amino acid-to-tyrosine molar ratio (BTR), prothrombin time (PT), platelet count, and zinc were evaluated. In addition, the serum concentration of alpha-fetoprotein (AFP) was measured as a tumor marker, and the indocyanine green retention rate at 15 min (ICGR15) was also assessed. Serum zinc concentrations were determined using conventional atomic absorption spectrophotometry with a Zeeman polarized atomic absorption spectrophotometer (Z-6100; Hitachi, Tokyo, Japan). Serum ferritin levels were assessed using chemiluminescent ELISA or EIA (SRL, Tokyo, Japan). Serum levels of HCV RNA were determined using the Amplicor HCV Monitor (Roche Diagnostics KK, Tokyo, Japan) or TaqMan PCR methods (Cobas TaqMan HCV [auto] v2.0; Roche Diagnostics KK, Tokyo, Japan). Each patient’s serum HCV RNA level was classified as high (≥100 kilo copies/mL or 5.0 log U/mL) or low (<100 kilo copies/mL or 5.0 log U/mL). The HCV serotype was determined using an EIA kit (Imucheck F-HCV Gr1 and Gr2 reagents; International Reagent Corporation, Tokyo, Japan) according to the manufacturer’s instructions.
-
Histological analysis of hematoxylin-eosin-stained sections from liver biopsy
Liver biopsy specimens were obtained from patients with CHC or LC through percutaneous needle biopsy (Tru-Cut soft tissue biopsy needles, 14 G, Baxter, Deerfield, IL, USA) or hard Monopty needles (14 G, Medicon, Tokyo, Japan). These sections were fixed in 10%–20% buffered formalin and embedded in paraffin. The paraffin-embedded specimens were cut into 3- to 4-μm sections and stained with hematoxylin and eosin (HE). Each liver biopsy specimen was analyzed semi-quantitatively, with a score assigned to each parameter, as previously reported [25,27,30]. The HE-stained sections obtained from the liver biopsies performed at our department were evaluated by the first author and co-authors at a conference without knowledge of the patients’ characteristics. The data were entered into a database and subsequently relevant patient data were retrieved from the database and analyzed.
-
Real-time quantitative PCR analysis
Hepcidin mRNA expression was evaluated using real-time reverse transcription-quantitative polymerase chain reaction (RT-qPCR). RNA was extracted from the liver using TRIzol reagent (Thermo Fisher Scientific, Waltham, MA, U.S.A.) [27]. Complementary DNA was synthesized from 4 μg of total RNA using the SuperScript ™ Ⅲ First-Strand Synthesis System (Thermo Fisher Scientific). qPCR was performed using a THUNDERBIRD® SYBR qPCR Mix (TOYOBO, Osaka, Japan) and a 7500 Fast Real-Time PCR System (Thermo Fisher Scientific). Gene expression was normalized to GAPDH expression. The qPCR conditions included 95°C for 1 min, followed by 40 cycles of 95°C for 15 s, and 60°C for 60 s. The RT-qPCR data were analyzed using a standard curve. The correlation coefficient of the standard curve was > 0.90 for all patients. The PCR primer sequences used for detection were hepcidin F (5'-CAC AAC AGA CGG GAC AAC TT-3'; 20-mer), hepcidin R (5'-CGC AGC AGA AAA TGC AGA TG-3'; 20-mer), GAPDH F (5'- TGA Superscript CAT CAA GAA GGT Superscript GAA G -3'; 25-mer), and GAPDH R (5'- TCC TTG GAG GCC ATG TGG GCC AT -3'; 23-mer). The expression of hepcidin mRNA was quantified using the formula: ΔCt = Ct for hepcidin gene test − Ct GAPDH test. The RT-qPCR experiments were performed in triplicate.
-
Long-term patient outcomes
In order to assess long-term patient outcomes, we compared the cumulative probability of HCC based on the classification of hepcidin mRNA expression (ΔCt) as high or low. The high ΔCt group included patients with hepcidin ΔCt levels exceeding the middle value for all patients, while the low ΔCt group included those with hepcidin ΔCt levels below the middle level.
-
Measurement of serum cytokine and chemokine concentrations
Cytokine and chemokine levels in the serum of 49 patients were measured using a Bio-plex Suspension Array System (Bio-Rad Laboratories, HERCULES, CA, USA) following concentrations measured in our previous study [30]. The cytokines and chemokines measured were cutaneous T-cell-attracting chemokine (CTACK), growth-regulated alpha protein (GROa), interleukin (IL)-1α, IL-2 receptor α(Rα), IL-3, IL-12p40, IL-16, IL-18, leukemia inhibitory factor (LIF), monocyte-specific chemokine 3 (MCP-3), macrophage colony-stimulating factor (M-CSF), macrophage migration inhibitory factor (MIF), Hu migration inducing gene (MIG), b-nerve growth factor (NGF), c-Kit receptor present on mast cells and stem cell factor (SCF), stem cell growth factor β(SCGF)-β, stromal cell-derived factor 1 α (SDF-1α), tumor necrosis factor (TNF)-β, tumor necrosis factor-related apoptosis-inducing ligand (TRAIL), hepatocyte growth factor (HGF), Hu interferon α2 (IFN-α2), platelet-derived growth factor receptor (PDGF)- ββ, IL-1b, IL-1ra, IL-2, IL-4, IL-5, IL-6, IL-7, IL-8, IL-9, IL-10, IL-12(p70), IL-13, IL-15, IL-17, eotaxin, FGF basic, granulocyte-colony stimulating factor (G-CSF), granulocyte macrophage-colony stimulating factor (GM-CSF), interferon gamma (IFN-γ), interferon gamma-induced protein-10 (IP-10), monocyte chemoattractant protein-1 (MCP-1)(MCAF), macrophage inflammatory protein 1 (MIP-1α), MIP-1β, regulated on activation normal T-cell expressed and secreted (RANTES), TNF-α, and vascular endothelial growth factor (VEGF).
-
Statistical analysis
Statistical analysis was performed using JMP 12 software (SAS Institute Inc., Tokyo, Japan). Data are expressed as the mean ± SD or median (range). Categorical variables were compared using the Mann–Whitney U test (non-parametric). The Kruskal–Wallis and Steel–Dwass tests were used for multiple-group comparisons. The Spearman’s rank correlation coefficient test was used for correlation analysis between the two groups. p < 0.05 was considered statistically significant. The cumulative incidence of HCC development was estimated using the Kaplan–Meier method, and differences between groups were assessed using the log-rank test. Statistical analyses was performed using JMP 12 software (SAS Institute Inc., Tokyo, Japan).
-
Ethical Approval
This study was approved by the Ethics Committee of Nihon University School of Medicine (RK-100611-13, # RK100910-15) and conducted in accordance with the tenets of the Declaration of Helsinki of 1964 and its subsequent amendments. Written informed consent was obtained from all participants. The enrolled patients agreed to cooperate with the study procedures and for publication of the results.
Results
-
Hepcidin mRNA expression (ΔCt) levels of liver biopsy specimens obtained from patients with CHC or LC
The median levels of hepcidin (ΔCt) did not show any significant differences between the sexes or between different age groups. Additionally, no significant differences were observed in the median hepcidin ΔCt levels between patients with different stages of chronic liver disease (F0 to F4) or between different HCV serotypes or serum HCV RNA levels (Table 2).
-
Correlation between hepcidin ΔCt levels and blood, biochemical, and histological parameters
Hepcidin ΔCt levels did not exhibit significant correlations with most biochemical parameters, except for serum ferritin concentration (r=−0.357; p=0.0161) and unsaturated iron binding capacity (p=0.0003; Table 3). Interestingly, hepcidin ΔCt levels did not show any significant associations with the scores of histological factors, although a significant correlation was observed between the extent of POAH and hepcidin ΔCt levels (r=0.288, p=0.0086). Patients with higher hepcidin ΔCt levels were more likely to exhibit a greater degree of POAH (minimal versus moderate, p=0.0158; none versus moderate, p=0.0242, Figure 1A). Notably, no significant association was observed between hepcidin ΔCt levels and the F-stages (p=0.3254; Figure 1B).
Table 2.Associations between
hepcidin mRNA expression (ΔCt) and clinical characteristics of patients (n=82).
| Parameter |
number |
r |
p |
| Gender |
|
|
0.5223 |
| male |
44 |
0.0744 |
|
| female |
38 |
0.4817 |
|
| Age |
|
|
0.0669 |
| <65 yrs |
66 |
0.2139 |
|
| ≥65 yrs |
16 |
1.3036 |
|
| Genotype |
|
|
0.9200 |
| 1a |
54 |
0.3267 |
|
| 2a |
15 |
0.5013 |
|
| 2b |
12 |
−0.1300 |
|
| HCV RNA |
|
|
0.3351 |
| High |
67 |
0.5012 |
|
| Low |
12 |
−0.2411 |
|
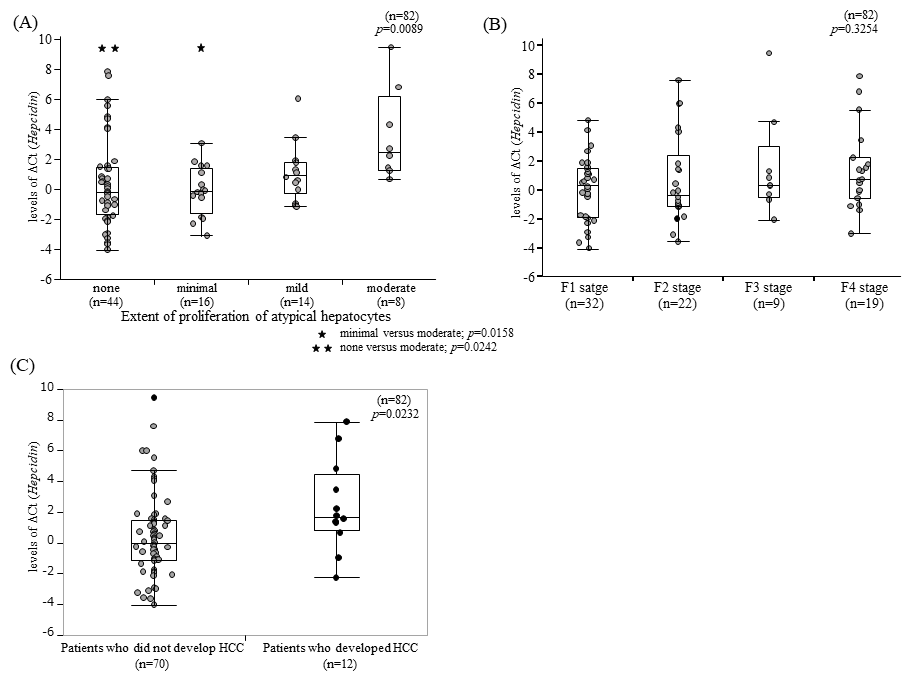
Figure 1.
(A) Hepcidin mRNA expression was quantified using the formula: ΔCt = Ct for hepcidin gene test: - Ct glyceraldehyde-3-phosphate dehydrogenase (GAPDH) test. The degree of proliferation of atypical hepatocytes (POAH) and hepcidin ΔCt levels were significantly associated with the degree or extent of POAH (p=0.0089) based on robust regression analysis using Huber M estimation. Significant differences in hepcidin ΔCt levels were observed between moderate and minimal (p=0.0158) and none and moderate (p=0.0242) POAH, with hepcidin ΔCt levels being significantly higher in moderate cases (p=0.0267) based on Kruskal–Wallis and Steel–Dwass tests. (B) Comparison between hepcidin ΔCt levels and F1 to F4 stages in patients with hepatitis C virus (HCV) RNA-positive chronic hepatitis. No significant correlation was observed between hepcidin ΔCt level and F stage (p=0.3254). Data were analyzed using Kruskal–Wallis and Steel–Dwass tests. (C) Comparison between hepcidin ΔCt levels and the development of hepatocellular carcinoma in patients. Patients who did not develop HCC exhibited significantly lower hepcidin ΔCt levels than those who developed HCC (p=0.0232). Data were analyzed using ANOVA.
Table 3.Associations between
hepcidin mRNA expression levels (ΔCt), blood and biochemical examination results or histological parameters of patients (n=82)
| Parameter |
number |
r |
p |
| Blood and Serological Examination. |
|
|
|
| aspartate aminotransferase (U/L) |
82 |
0.100 |
0.367 |
| alanine aminotransferase (U/L) |
82 |
0.017 |
0.875 |
| γ-glutamyl transpeptidase (U/L) |
82 |
−0.114 |
0.306 |
| alkaline phosphatase (U/L) |
82 |
−0.099 |
0.306 |
| total Bilirubin (mg/dl) |
82 |
−0.176 |
0.112 |
| platelet counts (x104) |
82 |
−0.020 |
0.852 |
| total protein (g/dl) |
74 |
0.023 |
0.837 |
| albumin (g/dl) |
74 |
−0.151 |
0.210 |
| prothrombin time (%) |
74 |
0.031 |
0.779 |
| BTR |
62 |
−0.135 |
0.315 |
| BCAA |
62 |
0.089 |
0.508 |
| tyrosine |
62 |
0.191 |
0.153 |
| indocyanine green retention rate 15min |
62 |
0.043 |
0.700 |
| alpha-feto protein (ng/ml) |
70 |
0.029 |
0.798 |
| zinc concentration (μg/ml) |
62 |
−0.013 |
0.914 |
| ferritin concentration (ng/ml) |
62 |
−0.382 |
0.009 |
| FIB-4 |
82 |
0.178 |
0.123 |
| APRI |
82 |
0.141 |
0.221 |
| unsaturated iron binding capacity |
62 |
0.582 |
0.0003 |
| Histology of liver biopsy section (score) |
82 |
|
|
| Irregular regeneration of hepatocytes |
82 |
|
|
| anisocytosis of hepatocytes |
|
0.084 |
0.448 |
| bulging of hepatocytes |
|
0.106 |
0.341 |
| map-like distribution |
|
0.123 |
0.269 |
| oncocytic change of hepatocytes |
|
0.089 |
0.424 |
| nodular arrangement of hepatocytes |
|
0.136 |
0.052 |
| proliferation of atypical hepatocytes |
|
0.288 |
0.0086 |
| Inflammatory cell infiltration |
|
|
|
| peri-portal |
|
0.101 |
0.366 |
| parenchyma |
|
0.138 |
0.215 |
| portal |
|
−0.044 |
0.692 |
| F stage |
|
0.144 |
0.196 |
| lymphoid aggregation of portal tract |
|
−0.020 |
0.858 |
| portal sclerotic change |
|
−0.068 |
0.563 |
| bile duct damage |
|
−0.124 |
0.266 |
| peri-venular fibrosis |
|
−0.150 |
0.177 |
| peri-cellular fibrosis |
|
0.005 |
0.958 |
| bridging necrosis |
|
0.002 |
0.858 |
| steatosis |
|
0.173 |
0.118 |
Data were analyzed using Spearman’s rank correlation coefficients. Abbreviations: BCAA, branched-chain amino acids; BTR, BCAA-to-tyrosine molar ratio, FIB-4; fibrosis-4; APRI, AST-to-platelet ratio index.
-
Relationship between hepcidin ΔCt levels and cumulative incidence of HCC development
The cumulative incidence of HCC development was analyzed in the cohort of 82 patients. These patients were divided into low (<0.299) and high (≥0.334) groups based on their hepcidin ΔCt levels. The low ΔCt group consisted of patients with hepcidin ΔCt expression below the middle value, whereas the high ΔCt group comprised patients with hepcidin ΔCt expression exceeding the middle level. The cumulative incidence of HCC in the low ΔCt group, after a median follow-up of 12.06 (range: 0.11–18.71) years, was significantly lower than that in the high ΔCt group, with a median follow-up of 8.13 (range: 0.32–17.18) years (p=0.0028; Figure 2A). Moreover, the 5-year incidence rates were 0% and 19.2% in the low and high ΔCt groups, respectively. The association between hepcidin ΔCt levels in patients who developed HCC and the time to HCC development after the first liver biopsy was then examined. Although no statistically significant difference was observed, there was a tendency for a shorter time to HCC development in patients with low hepcidin ΔCt levels (p=0.3675; Figure 2B). These findings suggest that higher hepcidin ΔCt levels are associated with an increased risk of HCC development.
-
Correlations between serum cytokine/chemokine concentrations and hepcidin ΔCt levels
Significant correlations were observed between hepcidin ΔCt levels and the concentrations of certain cytokines (Table 4). The hepcidin ΔCt levels was positively correlated with the concentrations of IL-1α (r=0.3323; p=0.0197), IL-5 (r=0.3771; p=0.0076), IL-8 (r=0.2823; p =0.0493), IL-10 (r=0.3395; p=0.0170), IL-12 (p70) (r=0.4243; p=0.0024), IL-13 (r=0.3110; p =0.0024), G-CSF (r=0.3294; p=0.0208), GM-CSF (r=0.3208; p=0.0246), IFN-γ (r=0.3063; p=0.0323), MIP-1b (r=0.2840; p=0.0480). Conversely, a negative correlation was observed between hepcidin ΔCt levels and the concentration of TRAIL (r=−0.2933, p=0.0408).
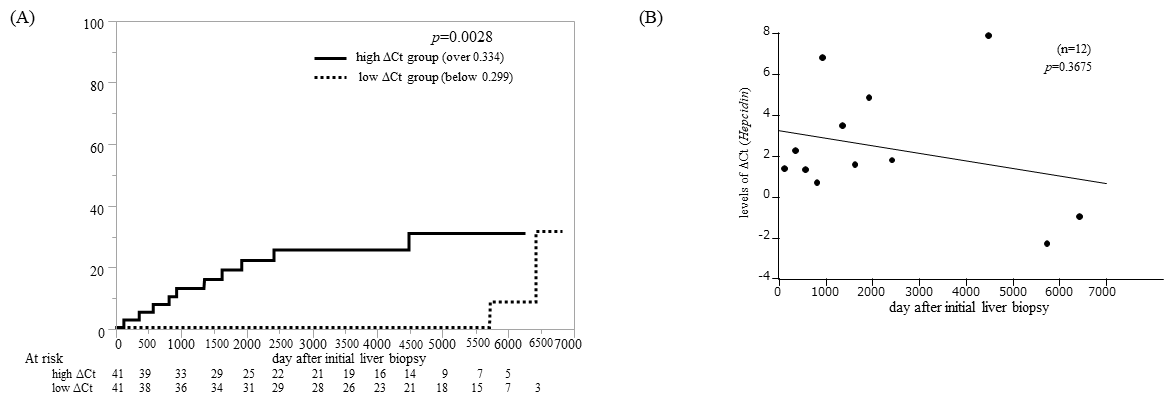
Figure 2.
(A) The cumulative incidence of HCC development in the high hepcidin ΔCt group (≥0.334, straight line) was significantly higher than that in the low hepcidin ΔCt group <0.299, dashed line) (p=0.0028). Data were analyzed using the Kaplan–Meier method, and between-group differences were assessed using the log-rank test. (B) Comparison between days after initial biopsy during HCC development and hepcidin ΔCt levels (p=0.3675). Data were analyzed using Spearman's rank correlation test.
Table 4.Associations between
hepcidin levels (ΔCt) and serum cytokine and chemokine concentrations (n=49). The expression of each gene mRNA was quantified using the formula:
ΔCt = Ct for each gene test: Ct β-actin. RT-qPCR experiments were performed in triplicate.
|
r |
p |
| Hu CTACK |
−0.0407 |
0.7812 |
| Hu GROa |
0.1041 |
0.4766 |
| Hu IL-1α |
0.3323 |
0.0197 |
| Hu IL-2Ra |
0.2457 |
0.0888 |
| Hu IL-3 |
0.1984 |
0.1717 |
| Hu IL-12p40 |
0.0416 |
0.7766 |
| Hu IL-16 |
0.0280 |
0.8485 |
| Hu IL-18 |
0.0272 |
0.8526 |
| Hu LIF |
−0.0367 |
0.8024 |
| Hu MCP-3 |
0.0958 |
0.5126 |
| Hu M-CSF |
0.1273 |
0.3834 |
| Hu MIF |
0.0861 |
0.5565 |
| Hu MIG |
0.2319 |
0.1088 |
| Hu b-NGF |
0.1598 |
0.2726 |
| Hu SCF |
−0.0669 |
0.6477 |
| Hu SCGF-b |
0.0456 |
0.7556 |
| Hu SDF-1a |
0.1161 |
0.4270 |
| Hu TNF-β |
0.2257 |
0.8692 |
| Hu TRAIL |
−0.2933 |
0.0408 |
| Hu HGF |
0.0583 |
0.6909 |
| Hu IFN-a2 |
0.1822 |
0.2103 |
| Hu PDGF-bb |
0.0384 |
0.7935 |
| Hu IL-1b |
0.2537 |
0.0797 |
| Hu IL-1ra |
−0.0337 |
0.8183 |
| Hu IL-2 |
0.2238 |
0.1222 |
| Hu IL-4 |
0.0254 |
0.8624 |
| Hu IL-5 |
0.3771 |
0.0076 |
| Hu IL-6 |
0.2791 |
0.0521 |
| Hu IL-7 |
0.2149 |
0.1381 |
| Hu IL-8 |
0.2823 |
0.0493 |
| Hu IL-9 |
0.0889 |
0.5436 |
| Hu IL-10 |
0.3395 |
0.0170 |
| Hu IL-12(p70) |
0.4243 |
0.0024 |
| Hu IL-13 |
0.3110 |
0.0296 |
| Hu IL-15 |
0.1814 |
0.2122 |
| Hu IL-17 |
0.1021 |
0.4851 |
| Hu Eotaxin |
0.0131 |
0.9290 |
| Hu FGF basic |
−0.1754
|
0.2280 |
| Hu G-CSF |
0.3294 |
0.0208 |
| Hu GM-CSF |
0.3208 |
0.0246 |
| Hu IFN-γ |
0.3063 |
0.0323 |
| Hu IP-10 |
0.0033 |
0.9820 |
| Hu MCP-1(MCAF) |
0.1930 |
0.1841 |
| Hu MIP-1a |
−0.1451
|
0.3200 |
| Hu MIP-1b |
0.2840 |
0.0480 |
| Hu RANTES |
0.1317 |
0.3669 |
| Hu TNF-alpha |
0.2411 |
0.0952 |
| Hu VEGF |
0.1174 |
0.4216 |
The expression of each gene mRNA was quantified using the formula: ΔCt = Ct for each gene test: Ct β-actin. RT-qPCR experiments were performed in triplicate. The following cytokines and chemokines were measured: cutaneous T-cell-attracting chemokine (CTACK), growth-regulated alpha protein (GROa), Interleukin (IL)-1α, IL-2 receptor α(Rα), IL-3, IL-12p40, IL-16, IL-18, leukemia Inhibitory Factor (LIF), monocyte-specific chemokine 3 (MCP-3), macrophage colonystimulating factor (M-CSF), macrophage migration inhibitory factor (MIF), Hu migration inducing gene (MIG), b-nerve growth factor (NGF), c-Kit receptor present on mast cells and stem cell factor (SCF), stem cell growth factor β(SCGF)-β, stromal cell-derived factor 1 α (SDF-1α), tumor necrosis factor (TNF)-β, tumor necrosis factor-related apoptosis-inducing ligand (TRAIL), hepatocyte growth factor (HGF), Hu interferon α2 (IFN-α2), platelet-derived growth factor receptor (PDGF)- ββ, IL-1b, IL-1ra, IL-2 , IL-4, IL-5, IL-6, IL-7, IL-8 , IL-9, IL-10, IL-12(p70), IL-13, IL-15, IL-17, eotaxin, FGF basic, granulocyte-colony stimulating factor (G-CSF), granulocyte macrophage-colony stimulating factor (GM-CSF), interferon gamma (IFN-γ), interferon gamma-induced protein-10 (IP-10), monocyte chemoattractant protein-1 (MCP-1)(MCAF), macrophage inflammatory protein 1 (MIP-1α), MIP-1β, regulated on activation, normal T-cell expressed and secreted (RANTES), TNF-α, and vascular endothelial growth factor (VEGF).
Discussion
The results of our study suggest that patients with low hepcidin mRNA expression in liver biopsy tissues are at higher risk of developing HCC. This is supported that the majority of patients who developed HCC exhibited high hepcidin ΔCt levels. Previous studies have reported a reduction in hepcidin mRNA expression in HCC tissues compared to that in non-cancerous liver tissues [31,32].
Based on the premise that low hepcidin mRNA expression (high hepcidin ΔCt level) is a risk factor for HCC development, we propose a hypothesis regarding the underlying mechanism. We hypothesize that within the lobules of patients with chronic hepatitis or cirrhosis, some of the atypical regenerating hepatocytes are more similar to HCC cells than to normal hepatocytes. Consequently, these hepatocytes may possess a diminished capacity to produce hepcidin mRNA. This may explain the observed decrease in hepcidin mRNA expression under these conditions. Based on our hypothesis, we speculate that livers with low hepcidin mRNA expression may have atypical hepatocytes that exhibit similar characteristics to those of HCC cells to some extent, when compared to normal hepatocytes.
Although the frequency of patients with advanced POAH was low, those with mild or higher POAH exhibited significantly lower hepcidin mRNA expression (Figure 1A). To date, we have reported the extent of POAH as a risk factor for the development of HCC from chronic hepatitis C and as a risk factor for HCC recurrence [33,34]. This suggests that hepcidin may play a direct role in the development of POAH. Further investigation is required for more detailed exploration of this hypothesis, which is beyond the scope of the present study. Our results support the finding that low hepcidin expression in cancerous areas is associated with HCC progression and poor prognosis [34,35].
While low hepcidin mRNA expression in liver tissue is a significant predictor of HCC development, the exact role of hepcidin in inhibiting or promoting HCC development remains unclear. Further studies are required to elucidate the precise mechanisms and determine the specific impact of hepcidin on HCC development. Furthermore, hepcidin mRNA expression showed an inverse positive correlation with blood ferritin concentration and a positive correlation with unsaturated iron-binding capacity levels, although only a few patients were analyzed. Based on this finding, it appears plausible that blood ferritin concentration reflects hepcidin mRNA expression in liver biopsy tissues. However, it is important to note that blood ferritin levels may be elevated under carcinogenic conditions or in patients with high levels of inflammation. Therefore, caution should be exercised when interpreting the blood ferritin level as a direct indicator of hepcidin mRNA expression in the liver. In contrast, hepcidin mRNA expression was not associated with the degree of inflammatory lymphocytic infiltration in liver lobules. This finding may suggests that hepcidin mRNA expression is unrelated to the mechanism of hepatocellular injury recognized by immunocompetent cells. In general, low hepcidin mRNA expression in hepatocytes indicates that ferroportin expression is not suppressed, thereby resulting in an increased export of iron ions from the cells, leading to a reduction in the intracellular iron ion levels. Hence, the reduction of iron ions can be seen as a mechanism that aids in suppressing the generation of radicals that can cause cellular damage.
We further investigated the relationship between serum cytokine and chemokine concentrations and hepcidin mRNA expression levels in the liver biopsy tissues. We found that hepcidin mRNA expression positively correlated with TRAIL only. On the other hand, hepcidin mRNA expression exhibited inverse correlations with IL-1α, IL-5, IL-8, IL-10, IL-12 (P40), IL-13, G-CSF, GM-CSF, IFN-γ, and MIP-1b. These findings suggest a complex interplay between hepcidin mRNA expression and various cytokines and chemokines in the liver microenvironment. The lifespan of neutrophils is normally 2–3 days at most to induce apoptosis, and the inverse correlation between G-CSF and GM-CSF suggests that low hepcidin mRNA expression may induce apoptosis and respond to infection by increasing the production of the granulocyte lineage and monocytes. Further, TRAIL is an antitumor cytokine that transduces apoptosis-inducing signals into cells by binding to specific receptors on the cell membrane [35]. Therefore, the positive correlation between hepcidin mRNA expression and TRAIL may indicate a pro-apoptotic effect of hepcidin. Zerafa et al. reported that TRAIL-knockout mice exhibit increased rates of carcinogenesis [36], and this positive correlation also suggests that hepcidin may exert an inhibitory effect on hepatocarcinogenesis. Thus, hepcidin mRNA levels positively correlated with TRAIL and negatively correlated with IL-13 and G-CSF, suggesting that hepcidin regulates apoptosis in a hyperactivating direction. Next, hepcidin mRNA expression was inversely correlated with MIP-1β (CCL4). Although MIP-1α/β display similar responses, MIP-1 selectively induces migration of CD8+ lymphocytes and MIP-1β of CD4+ lymphocytes [37]. Additionally, MIP-1 (CCL4) promotes tumor development and progression by recruiting regulatory T cells and pro-tumorigenic macrophages to enhance their pro-tumorigenic capacity [38]. IL-10 acts on immune cells such as T cells and macrophages, directly suppressing cell activation and weakening the antigen-presenting capacity of macrophages, thereby suppressing the immune response [39]. IL-12 (p70) is a cytokine essential for the induction of Th1 responses through the production of IFN-γ, which is important for protective immunity against infection and the induction of tumor immunity [40]. IL-13 has been observed to be a mediator of cytotoxicity in vitro and it has been reported that IL-13 induces cell death when applied to the colon cancer epithelial cell line HT29 [41,42]. It is believed that the disruption of the cell structure by IL-13 causes unstable cells to undergo apoptosis. Taken together, these results suggest that low hepcidin mRNA expression facilitates the enhancement of cell apoptosis and may also modulate the inflammatory response in an inhibitory manner. Comparison of cytokine/chemokine concentrations requires the detection of hepcidin mRNA expression and cytokine/chemokine levels in the liver tissue. To further elucidate the function of hepcidin and the mechanisms regulating hepcidin mRNA expression, we compared the differences in hepcidin expression in cell lines in which hepcidin was highly expressed in cultured cells or knocked down using small interfering RNA, and performed RNA-Seq to confirm the differences in gene expression. This study was based on a small number of liver biopsy tissues. We would like to recruit more patients and perform further studies using more liver tissue samples.
In conclusion, this study suggests that low hepcidin mRNA expression in patients with HCV-associated liver disease is associated with a high risk of HCC development. Thus, low hepcidin mRNA expression appears to indicate a hypercarcinogenic liver state. Furthermore, measuring hepcidin mRNA expression can be clinically useful for predicting the long-term prognosis of patients and for guiding treatment decisions.
Acknowledgments
We greatly thanks for Motomi Yamazaki, PhD. And Ms. Kayo Iwaguchi, and Ms. Shinobu Arai for technical assistance.
Author Contributions
M.O. and M.M., contributed to data collection, statistical analyses, interpretation of data, the writing of the manuscript and was the main author of the manuscript.
M.O., H.N, and M.M., contributed to data and sample collection,
M.O., M.M., and K.K. were contributed for study concept and design;
H.N. and M.M. were contributed for histological analysis;
M.M., T.S. and K.K. were responsible or analysis and interpretation of data;
M.M., and K.K. were responsible for statistical analysis;
Ethics approval and consent to participate
This study was approved by the Ethics Committee of Nihon University School of Medicine (RK-100611-13, # RK100910-15).
The study was performed in accordance with the ethical standards as laid down in the 1964 Declaration of Helsinki and its later amendments or comparable ethical standards.
Consent for participate
Written informed consent was obtained from each patient.
Availability of data and material
Not applicable.
Funding
Not applicable.
Consent for publication
Not applicable.
Competing interests
Mitsuhiko Moriyama; Towa Pharmaceutical Co., Ltd. The other authors have no conflict of interest to declare.
References
- [1] Billesbølle CB , Azumaya CM , Kretsch RC , Powers AS , Gonen S , Schneider S , Arvedson T , Dror RO , Cheng Y , Manglik A . Structure of hepcidin-bound ferroportin reveals iron homeostatic mechanisms. Nature. 2020; 586(7831): 807-811. doi: 10.1038/s41586-020-2668-z. Epub 2020 Aug 19.
- [2] Nemeth E et al. Hepcidin regulates cellular iron efflux by binding to ferroportin and inducing its internalization. Science. 2004; 306, 2090-2093.
- [3] Aschemeyer S et al. Structure-function analysis of ferroportin defines the binding site and an alternative mechanism of action of hepcidin. Blood, The Journal of the American Society of Hematology. 2018; 131, 899-910.
- [4] De Domenico I et al. The molecular mechanism of hepcidin-mediated ferroportin down-regulation. Mol. Biol. Cell. 2007; 18, 2569-2578.
- [5] Qiao B et al. Hepcidin-induced endocytosis of ferroportin is dependent on ferroportin ubiquitination. Cell Metab. 2012; 15, 918-924.
- [6] Ross SL et al. Molecular mechanism of hepcidin-mediated ferroportin internalization requires ferroportin lysines, not tyrosines or JAK-STAT. Cell Metab. 2012; 15, 905-917.
- [7] Darshan D , Anderson GJ . Interacting signals in the control of hepcidin expression. Biometals. 2009; 22: 77-87.
- [8] Mastrogiannaki M , Matak P , Keith B , Simon MC , Vaulont S , Peyssonnaux C . HIF-2alpha, but not HIF-1alpha, promotes iron absorption in mice. J Clin Invest. 2009; 119: 1159-1166.
- [9] Sagar P , Angmo S , Sandhir R , Rishi V , Yadav H , Singhal NK . Effect of hepcidin antagonists on anemia during inflammatory disorders. Pharmacol Ther. 2021; 226: 107877.
- [10] Miyachi H , Kobayashi Y , Relja B , Fujita N , Iwasa M , Gabazza EC , Takei Y . Effect of suppressor of cytokine signaling on hepcidin production in hepatitis C virus replicon cells. Hepatol Res. 2011 ; 41: 364-374.
- [11] Mifuji-Moroka R , Iwasa M , Miyachi H , Sugimoto R , Tanaka H , Ishihara T , Fujita N , Kaito M , Kobayashi Y , Takei Y . Iron overload and glucose abnormalities in chronic hepatitis C virus infection: phlebotomy lowers risk of new-onset diabetes. Hepatogastroenterology. 2013; 60: 1736-1741.
- [12] Kohgo Y , Ikuta K , Ohtake T , Torimoto Y , Kato J . Iron overload and cofactors with special reference to alcohol, hepatitis C virus infection and steatosis/insulin resistance. World J Gastroenterol. 2007;13 : 4699-706.
- [13] Higuchi T , Moriyama M , Fukushima A , Matsumura H , Matsuoka S , Kanda T , Sugitani M , Tsunemi A , Ueno T , Fukuda N . Association of mRNA expression of iron metabolism-associated genes and progression of non-alcoholic steatohepatitis in rats. Oncotarget. 2018; 9: 26183-26194.
- [14] Chen H , Zhao W , Yan X , Huang T , Yang A . Overexpression of Hepcidin Alleviates Steatohepatitis and Fibrosis in a Diet-induced Nonalcoholic Steatohepatitis. J Clin Transl Hepatol. 2022; 10: 577-588.
- [15] Datz C , Müller E , Aigner E . Iron overload and non-alcoholic fatty liver disease. Minerva Endocrinol. 2017; 42: 173-183.
- [16] Corradini E , Pietrangelo A . Iron and steatohepatitis. J Gastroenterol Hepatol. 2012; 27 Suppl 2: 42-46.
- [17] Abd Elmonem E , Tharwa el-S , Farag MA , Fawzy A , El Shinnawy SF , Suliman S . Hepcidin mRNA level as a parameter of disease progression in chronic hepatitis C and hepatocellular carcinoma. J Egypt Natl Canc Inst. 2009; 21: 333-42.
- [18] Aoki CA , Rossaro L , Ramsamooj R , Brandhagen D , Burritt MF , Bowlus CL . Liver hepcidin mRNA correlates with iron stores, but not inflammation, in patients with chronic hepatitis C. J Clin Gastroenterol. 2005; 39: 71-74.
- [19] Nirei K , Matsuoka S , Nakamura H , Matsumura H , Moriyama M . Incidence of hepatocellular carcinoma reduced by phlebotomy treatment in patients with chronic hepatitis C. Intern Med. 2015; 54: 107-117.
- [20] Chino S , Moriyama M , Matsumura H , Ono Y , Arakawa Y . Clinical pathological significance of iron metabolism with chronic hepatitis C patients. Hepatol Res. 2002; 24: 245.
- [21] Uchida T . Small hepatocellular carcinoma: its relationship to multistep hepato-carcinogenesis. Pathol Int. 1995; 45: 175-184.
- [22] Uchida T . Pathology of hepatitis C. Intervirology. 1994; 37: 126-132.
- [23] Shibata M , Morizane T , Uchida T , Yamagami T , Onozuka Y , Nakano M , et al. Irregular regeneration of hepatocytes and risk of hepatocellular carcinoma in chronic hepatitis and cirrhosis with hepatitis-C-virus infection. Lancet. 1998; 351: 1773-1777.
- [24] Peters RL . Viral hepatitis: a pathologic spectrum. Am J Med Sci. 1975; 270: 17-31.
- [25] Matsumura H , Nirei K , Nakamura H , Higuchi T , Arakawa Y , Ogawa M , Tanaka N , Moriyama M . Histopathology of type C liver disease for determining hepatocellular carcinoma risk factors. World J Gastroenterol. 2013; 19: 4887-4896.
- [26] Ueno Y , Moriyama M , Uchida T , Arakawa Y . Irregular regeneration of hepatocytes is an important factor in the hepatocarcinogenesis of liver disease. Hepatology. 2001; 33: 357-362.
- [27] Moriyama M , Kanda T , Midorikawa Y , Matsumura H , Masuzaki R , Nakamura H , Ogawa M , Matsuoka S , Shibata T , Yamazaki M , Kuroda K , Nakayama H , Higaki T , Kanemaru K , Miki T , Sugitani M , Takayama T . The proliferation of atypical hepatocytes and CDT1 expression in noncancerous tissue are associated with the postoperative recurrence of hepatocellular carcinoma. Sci Rep. 2022; 12: 20508. doi: 10.1038/s41598-022-25201-6
- [28] Ichida F , Tsuji T , Omata M , Ichida T , Inoue K , Kamimura T , Yet al. New Inuyama classification: new criteria for histological assessment of chronic hepatitis. Int Hepatol Commun 1996; 6: 112-119.
- [29] Desmet VJ , Gerber M , Hoofnagle JH , Manns M , Scheuer PJ . Classification of chronic hepatitis: diagnosis, grading and staging. HEPATOLOGY 1994; 19: 1513-1520.
- [30] Ohnishi M , Higuchi A , Matsumura H , Arakawa Y , Nakamura H , Nirei K , Yamamoto T , Yamagami H , Ogawa M , Gotoda T , Matsuoka S , Nakajima N , Sugitani M , Moriyama M , Murayama H . Involvement of Ornithine Carbamoyltransferase in the Progression of Chronic Hepatitis C and Liver Cirrhosis. Int J Med Sci. 2017; 14: 629-638.
- [31] Kijima H , Sawada T , Tomosugi N , Kubota K . Expression of hepcidin mRNA is uniformly suppressed in hepatocellular carcinoma. BMC Cancer. 2008 ; 8: 167.
- [32] Kessler SM , Barghash A , Laggai S , Helms V , Kiemer AK . Hepatic hepcidin expression is decreased in cirrhosis and HCC. J Hepatol. 2015; 62: 977-979.
- [33] Polak KZ , Schaffer P , Donaghy D , Zenk MC , Olver CS . Iron, hepcidin, and microcytosis in canine hepatocellular carcinoma. Vet Clin Pathol. 2022; 51: 208-215.
- [34] Kessler SM , Barghash A , Laggai S , Helms V , Kiemer AK . Hepatic hepcidin expression is decreased in cirrhosis and HCC. J Hepatol. 2015; 62: 977-979.
- [35] Chaudhari BR , Murphy RF , Agrawal DK. Following the TRAIL to apoptosis. Immunol Res. 2006; 35: 249-262.
- [36] Zerafa N , Westwood JA , Cretney E , Mitchell S , Waring P , Iezzi M , Smyth MJ . Cutting edge: TRAIL deficiency accelerates hematological malignancies. J Immunol. 2005; 175: 5586-5590.
- [37] Obregon-Perko V , Hodara VL , Parodi LM , Giavedoni LD . Baboon CD8 T cells suppress SIVmac infection in CD4 T cells through contact-dependent production of MIP-1α, MIP-1β, and RANTES. Cytokine. 2018; 111: 408-419.
- [38] Mukaida N , Sasaki SI , Baba T . CCL4 Signaling in the Tumor Microenvironment. Adv Exp Med Biol. 2020; 1231: 23-32.
- [39] Minton K . Immune regulation: IL-10 targets macrophage metabolism. Nat Rev Immunol. 2017; 17: 345.
- [40] Trinchieri G . Interleukin-12 and the regulation of innate resistance and adaptive immunity. Nat Rev Immunol. 2003; 3: 133-146.
- [41] Li BH , Xu SB , Li F , Zou XG , Saimaiti A , Simayi D , Wang YH , Zhang Y , Yuan J , Zhang WJ . Stat6 activity-related Th2 cytokine profile and tumor growth advantage of human colorectal cancer cells in vitro and in vivo. Cell Signal. 2012; 24: 718-725.
- [42] Wright K , Kolios G , Westwick J , Ward SG . Cytokine-induced apoptosis in epithelial HT-29 cells is independent of nitric oxide formation. Evidence for an interleukin-13-driven phosphatidylinositol 3-kinase-dependent survival mechanism. J Biol Chem. 1999; 274: 17193-201.