Abstract
This study examined the effect of combining visual and olfactory cues to attract oriental fruit flies (OFFs). Six different colored light-emitting diodes (LEDs) served as a visual attractant and methyl eugenol served as olfactory bait to lure male flies. An internet of things (IoT)-based pest monitoring system, consisting of sensor nodes, a gateway, and automatic counting traps, was deployed in the field to automatically collect environmental data and pest counts. The results of the calibrated experiments indicated that green, yellow, or red LEDs exhibited better performance in attracting flies than white, purple, or blue LEDs or no LEDs. With an accurate combination of visual and olfactory cues, the proposed IoT-based pest monitoring system may be an effective tool in agricultural pest management, given its advantages for efficiently capturing OFFs in a labor and time saving manner, providing accurate information regarding increases in pest populations, and enabling long-term, real-time data collection.
1. Introduction
The oriental fruit fly (OFF), Bactrocera dorsalis (Hendel) (Diptera: Tephritidae), is the major pest that attacks fruit in Southeast Asia and the Pacific Rim. In Taiwan, for example, the number of the flies has been found to be higher in May and June, compared with July and August.1) Researchers found that female flies are attracted by the odor of fruit at different ripeness stages.2)–4) Female flies lay eggs inside the fruit, causing major damage to fruit production. The hatched larvae eat the fruit and reduce its value. Previous studies reported that OFFs are highly polyphagous.5) They can damage more than 470 kinds of fruit and vegetables,6) many of which have a high economic value.7),8) It is unsurprising that OFFs appear on the quarantine list in many countries.9) Therefore, it is an important task to develop an effective strategies to control increases in OFF populations and reduce their damage to agricultural crops.
Some traditional pest control methods, such as the irradiation treatment, pesticide uses, and male annihilation techniques, can be used by farmers to effectively mitigate the economic loss caused by pest attack. For example, a generic dose of irradiation quarantine treatment for controlling all tephritid fruit flies, including the OFF, has been proposed and tested in detail.10) Mainstream prevention and suppression approaches for OFFs still rely on spraying chemical insecticides (e.g., organophosphates, pyrethroids, and antibiotic based pesticide compounds)11) or annihilating male flies using methyl eugenol (ME).12) Produced naturally by many plant species, ME is a powerful attractant to male OFFs, but their responses to ME are not related to food seeking. To eradicate male fruit flies more efficiently, toxic insecticides are usually mixed with ME. For example, a sufficient dose of naled has been used in a male annihilation technique (MAT) conducted in Okinawa Islands, Japan.13) In Taiwan, traps with naled-intoxicated ME lures have been deployed in towns and villages to capture and kill male OFFs.14) Chemical control is an effective method to reduce the population of OFFs; however, they have gradually developed adaptive resistance to insecticides, such as trichlorophon, alphamethrin, abamectin, and β-cypermethrin.15),16) Overuse of chemical insecticides may also have negative impacts on the environment and might endanger human health. Thus, it is necessary to develop novel and safe prevention methods to control the populations of the OFFs in orchards.
New methods for controlling the OFFs have also been proposed. For example, internet of things (IoT) technology has been adopted to develop OFF monitoring systems, which were able to accurately identify specific hotspots of fly populations in cultivation areas.17),18) Based on the accurate counting of pest populations, hotspot distributions and the dynamics of pest populations can be quickly identified, and such information can further be used to make effective pest management decisions before more serious problems occur.19) Through accurate and quantitative pest population information, farmers can efficiently apply integrated pest management (IPM) programs to their farmland to reduce damage associated with pest outbreaks while increasing productivity, and consumers can also buy better quality agricultural products.
The OFF monitoring systems mentioned earlier solely relied on fly traps to capture OFFs, and these traps used ME baits to attract male OFFs.17),18) To improve the efficiency of attracting OFFs, different luring methods have been proposed.20),21) The biological responses of fruit flies to shapes, sizes, and colors were also investigated.4),22) For example, visual cues were used to capture fruit flies based on the phototaxis of the flies, and pest insects were found to have a specific spectral preference.23)–26) Taking the OFF as an example, Wu et al. (2007) examined the spectral preference of OFFs using ultraviolet (UV) light and sticky papers with different colors.25) The experimental results showed that the spectra of stimuli between 300 and 380 nm (ultraviolet) and between 500 and 570 nm (green) can enhance the attractiveness of a colored paper for OFFs, and the spectra of the stimuli between 380 and 500 nm (blue) reduced the attractiveness.25) In fact, the effects on a combination of visual and olfactory cues to attract other species of flies, such as house flies and stable flies,26) and sandflies27) have been studied. Researchers found that using both a heated bait and a lighted trap increased the chance of catching house flies (Musca domestica L.), and stable flies (Stomoxys calcitrans L.) by an average of 2.4 and 1.8 times, respectively, compared with using the trap alone.26) For capturing sandflies (Phlebotomus papatasi), traps that included both UV light and carbon dioxide yielded the best results, followed by traps that solely employed carbon dioxide.27)
Given that OFFs depend on both visual and olfactory cues to find food,3),28) these cues may have a complementary effect on attracting flies.29) To examine the complementary effect of visual and olfactory cues in attracting OFFs, this study used a trapping device that combined a light mechanism with an ME bait. The effects of different color sources for luring OFFs were investigated. Light-emitting diodes (LEDs) were used to maintain a stable light intensity to continuously lure OFFs into the trapping device. This study used LEDs with different emission spectra, but the intensity of the LEDs was kept constant to determine the most effective spectra for attracting OFFs.
Traditionally, pest-related information is obtained from manually counting the number of captured OFFs and manually collecting environmental data. Such monitoring methods are labor-intensive and time-consuming, and the measured data are not synchronized. In addition, the influence of environmental factors on the effectiveness of attracting OFFs has not been explored. Monitoring system designs based on an IoT framework can provide an effective solution to these issues. IoT enables network devices to have the ability to measure different parameters and collect monitoring data, and then share the data through the internet. Combined with data analytics, IoT can be used to promote smart agriculture through which agricultural production is expected to be more effective and deliver higher yields.30)–32) Studies have found that IoT can be a major contributor to modern agriculture.33) IoT technology has been applied to pest monitoring in orchards,18),34) foraging behavior of honey bees,35) precision cultivation management in orchid greenhouses,36),37) crop and livestock monitoring,38),39) irrigation and water quality monitoring,40),41) weather monitoring,42) soil monitoring,43) disease and pest control,44) and automation and precision.45) With this technology, farmers can control their farms remotely and manage agricultural activities in a more effective way. Accurate and real-time monitoring data obtained from various sensors can provide important information to improve the sustainability of agricultural production. Among IoT-based agricultural applications, for example, an automated insect trap has been developed,46)–50) which can capture, count, and even characterize insect types. The pest data can be uploaded to a data cloud for further analysis. When remote sensing is enabled, sensors, actuators, and devices can be connected over the internet to allow interaction, control, and decision making. Such an IoT-based trap can minimize human effort and save time during data collection and transmission, and effectively reduce harmful attacks by insect pests.
To investigate the effect of combining visual and olfactory cues on attracting OFFs, this study utilized an IoT-based pest monitoring system to automatically measure the number of captured OFFs in an orchard. In this system, a specially designed trap containing one of the six different colored LEDs and ME bait was used to attract male flies. Environmental parameters, including ambient temperature, relative humidity, and illumination, were collected using a wireless module (Octopus II),51) and a sensor node in the system. The data were transmitted via a wireless communication module (ZigBee module) for statistical analyses to determine which colored LED can yield the best performance in attracting male flies. The proposed IoT-based pest monitoring system can enhance the temporal resolution of pest monitoring. The complementary strategy of a visual cue (i.e., LEDs) and an olfactory cue (i.e., ME) is expected to enhance fly capture rates and in turn prevent pest outbreaks.
2. IoT-based automatic pest monitoring system with a visual cue mechanism
To validate the proposed complementary strategy of visual and olfactory cues, an IoT-based pest monitoring system was developed to capture OFFs and measure environmental parameters. This IoT-based system was an extended version of an OFF monitoring system developed in previous studies.17),34) The architecture of the system included front-end and back-end parts. The front-end part, consisting of a gateway, wireless sensor nodes, and automatic counting traps, was responsible for sensing tasks, and the back-end part contained a database responsible for data storage, as shown in Fig. 1. In the front-end, an industrial personal computer (ARK-3360F, Advantech Co., Ltd., Taiwan), served as the gateway to collect data and transmitted these to a back-end database via a GSM module. An Octopus II, built on an MSP 430 microcontroller (Texas Instruments), served as the wireless sensor node,51) as shown in Fig. 2. The low-power, low-cost Octopus II device included a wireless radio transceiver. The ZigBee protocol following the IEEE 802.15.4 specification was used to transmit the sensed data to the gateway.34) A temperature/relative humidity sensor (SHT15, Sensirion AG, Switzerland) and an illumination sensor (S1087-01, Hamamatsu Photonics K. K., Japan) measured ambient temperature, relative humidity, and illumination.


Automatic counting traps were modified from a Yi-Shan trap (YST).52) The YST is designed to trap pests, and it only lures pests into the trap cylinder in one direction. An ME bait was placed inside the YST. It has been shown that a specific ratio of ME to an insecticide can effectively lure and kill OFFs.13) In this study, the ME bait comprised of a mix of 99% ME (technical grade [TG] 99%; Bayer Crop Science AG, Germany) and 90% naled (TG 90%; AMVAC Chemical Corp., U.S.A.) at a weight ratio of 18:1. In the YST pest traps, sugarcane fiberboard (4.5 × 4.5 × 0.9 cm) was used as the bait carrier, and each carrier adsorbed about 12 ml of the ME and naled mixture to reach saturation. A pest counting device, a set of light sources (i.e., six different colored LEDs), and a control device were attached to the YST to develop a capture system that combined both visual and olfactory cues, thereby enhancing the effectiveness of pest luring. Figure 3(a)–(d) show the trap from side, bottom, top, and overall views, respectively. The trap was also controlled by the Octopus II device, and pest count data were stored in the database in the back-end for further analysis. The counting mechanism of the trap will be introduced later.

The LED control process was as follows. First, the gateway assigned a numerical value from 0 to 6 to each weekday (Monday, Tuesday, Wednesday, Thursday, and Friday) and weekend (Saturday and Sunday). Each numerical value was appended with the node identification (ID) number and also served as a corresponding control signal for activating each colored LED inside the trap. Then, the gateway set a time tag for every day in a week and sent it to the node. According to the time tag, the node controlled a pin in the LED control circuit with either a high or low voltage. This control signal was sent from the node to the LED control circuit to activate a single selected LED. The intensities of various types of LED lights have been inconsistent in many studies. This study used LEDs with different emission spectra, but the intensities of the LEDs were held constant to find the most effective spectra to attract OFFs. A variable resistor was used to adjust the intensity of each LED. In the back-end, a database was installed in the server. The data received by a gateway were further transmitted to the database through either a wired network (e.g., internet) or a wireless communication network (e.g., Global System for Mobile Communications (GSM)). GSM was adopted for the data transmission process when the orchard experiments were conducted in this study several years ago. Nowadays, however, an improved wireless communication system is available, i.e., fourth generation (4G) mobile telecommunications technology, and it is easy to integrate a 4G module with the proposed IoT-based pest monitoring system. Users could browse the sensing data retrieved from the database via the internet.
To accurately evaluate the effectiveness of the LEDs, all the six different colored LED lights used in the proposed IoT-based pest monitoring system were adjusted to emit at the same light intensity. Another important issue in the field experiments was to eliminate the impact of the traps deployed in different locations on attracting OFFs. Such a location dependency problem could be solved by changing the locations of the deployed traps. In this study, the location of a deployed trap rotated every day during the experiments.
A flow chart for counting the captured OFFs is shown in Fig. 4. The first two stage boxes in the flow chart depict the control of the TURN-On and TURN-Off of the six LEDs installed in the automatic counting trap, simulating the regularly changing deployment for the traps. The next two decision boxes and other execution boxes focus on detecting and counting the flies lured into the trap, as well as measuring environmental parameters. As mentioned in the previous study,17) two sets of infrared photo-interrupters were used to detect OFFs entering the trap, and a double-counting mechanism was developed for counting the captured male flies. In this mechanism, the reading for paired photo-interrupters (denoted as IR1 and IR2) was “1” if a fly crawled across either of the two photo-interrupters. Once the reading for both IR1 and IR2 was “1”, the pest count increased by one. Such a double-counting mechanism can effectively avoid mis-counting when flies crawl back to the entrance of the pest trap. The double-counting algorithm and the illustration of the double-counting mechanism can be seen in previous studies.17),34)

The whole monitoring process is described as follows. First, the infrared sensors were triggered when an OFF entered the trap, and the core processor of the Octopus II counted the captured OFF. Environmental parameters, including temperature, relative humidity, and illumination, were also measured by the sensors. Second, environmental data and the data of fly counts were transmitted to the gateway via a wireless module using the ZigBee protocol. Because the experimental site was far from the laboratory, a long-distance transmission module was required. This study adopted a long-distance transmission module (Fastrack Supreme 20, Wavecom elektronik AG, Switzerland), based on second generation telecommunications technology, and the module was connected to the gateway. With this module, the gateway sent the sensed data, packed using a short message service (SMS), to a server. In addition, the gateway collected data sent from the wireless sensor nodes every 30 minutes. A computer (PowerEdge C6100, Dell, Inc., U.S.A.) was used as the server. It was also equipped with a long-distance transmission module and served as a transceiver for data and control commands. Finally, the server received the data from the gateway and stored them in a MySQL database (ver. 4.6.0, MySQL). Users were able to obtain monitoring information from the database. The test results showed that the packet transmission and receiving rate of the proposed IoT-based pest monitoring system was close to 100%.
3. Visual cues for oriental fruit flies
Six commercial LEDs (T10 9W SMD, Guangzhou Yida Car Accessories Co., Ltd., China) with different colors (red, yellow, green, blue, purple, and white with visible light) were selected for the study. Insects and humans respond differently to colors, so it was necessary to re-determine and calibrate the emission spectra of the selected commercial LEDs before the experiments. After the experiments were completed, the experimental data were analyzed using a statistical method to find the LEDs with the best effect on attracting OFFs.
3.1. Spectrum identification.
The spectral irradiance is the power (energy per unit time) received by the surface for a particular wavelength (e.g., wavelength λ) of light, and it can be expressed using the following equation:
| \begin{equation}
F(\lambda) = \frac{\varPhi E}{\lambda},
\end{equation}
| [1] |
where F(λ) is the spectral irradiance in terms of photon flux Φ, energy of a given photon E, and the wavelength of the given photon λ. The photon flux Φ is an important irradiance-related concept, because it represents how much light actually comes into contact with the device placed on the surface of the earth, and therefore indicates how many electrons can be generated for the current flow. The photon flux Φ denotes the amount of photons hitting the surface of a measurement module in a given time, which can be expressed as
| \begin{equation}
\varPhi = \frac{\text{$\#$ of photons}}{\text{surface ($m^{2}$)}},
\end{equation}
| [2] |
where Φ is defined as the amount of photons per second per square meter. Based on Eqs. [1] and [2], the power coming from all photons received from a particular wavelength per second can be computed using the amount of photons with the wavelength hitting a surface multiplied by the energy of the photons and divided by the wavelength. The result gives an idea of how much power can be derived from the wavelength.
Note that the retina in the compound eyes of a fly has photoreceptor cells, and that photons of different wavelengths hit the photoreceptor cells to generate different nerve impulses, so the visual cues for flies are different from those for humans, and it is necessary to calibrate the number of photons. Insects are attracted or repelled by different wavelength of lights, so their behavior in response to light varies. Vargas et al. (1991) indicated that a yellow fruit-mimicking sphere was more attractive to both sexes of OFFs than other colored spheres.22) Cornelius et al. (2000) conducted field cage experiments.4) They found that the odor of the Citrus sinensis (L.) puree was attractive to female OFFs and that the number of the attracted flies trapped by a combination of yellow sticky spheres with ammonia-based olfactory cues was higher than that attracted by the spheres or by olfactory cues alone. Alyokhin et al. (2000) suggested that sticky Ladd traps with hydrolyzed liquid protein can effectively increase the number of the captured OFFs.3) The sensitivity of OFFs to the spectra of colored LEDs, related to the average of the electrophysiological signals of the seven photoreceptor cells of the OFFs,25) was first examined.
The emission spectra of the LEDs were examined using a spectrometer (S2000, Ocean Optics Inc.) at ae temperature of 25 °C and relative humidity of 90%, and the results were compared with a reflectance standard called the Spectralon diffuse white standard (Labsphere, Inc.). The total time for testing the emission spectra was 0.1 second and each test was conducted five times. The emission spectrum and relative intensity of each LED are shown in Fig. 5. The emission spectra of the red, yellow, green, and blue LEDs showed a single peak. The center wavelengths of these LEDs were located at 633.69, 597.63, 523.96, and 464.83 nm, and with spectral widths of 18.09, 14.61, 29.47, and 21.23 nm, respectively. Both the purple and white LEDs showed double peaks. The center wavelengths of the purple LED were 451.43 and 647.81 nm, with spectral widths of 23.41 and 56.45 nm, respectively. The center wavelengths of the white LED were located at 450.41 and 551.54 nm, with spectral widths of 19.87 and 95.89 nm, respectively. Comparing these results with the report of Wu et al. (2007),25) some of the selected LEDs may have potential to attract more OFFs after combining with an ME bait.

A previous study examined the spectral sensitivities of the photoreceptors in the compound eyes of OFFs in the laboratory tests.25) They concluded that ultraviolet and green stimuli (spectra: 300–380 nm and 500–570 nm) enhanced the attractiveness of a colored paper to OFFs, and blue stimuli (380–500 nm) diminished the attractiveness. However, results for different color stimuli remain untested in the field. As mentioned earlier, some spectra of the six selected colored LEDs fell within the range of the spectral sensitivities of the photoreceptors of OFF eyes. Therefore, this study conducted a series of long-term field experiments to examine the complementary capturing strategy that combined visual and olfactory cues to capture OFFs. In addition to using ME bait, seven arrangements that consisted of six colored LEDs and the absence of an LED (i.e., only the ME bait was used) were tested for capturing OFFs. The six colored LEDs used in this study were white (450 ± 20 nm and 550 ± 96 nm), purple (450 ± 23 nm and 648 ± 56 nm), blue (465 ± 21 nm), green (524 ± 29 nm), yellow (598 ± 15 nm), and red (634 ± 18 nm).
3.2. Quantum flux calibration.
Radiant power density (also known as radiant quantum flux density) is the power per unit area of the light either emitted by an object or received on a surface and is determined using both the photon flux (the amount of photons passing through a given area in a given time) and the amount of photons for each given wavelength/energy (taken into account using spectral irradiance). The equation for radiant power density H is given by
| \begin{equation}
H = \int_{0}^{\infty}F(\lambda)d\lambda,
\end{equation}
| [3] |
where F(λ) is the spectral irradiance and dλ is an infinitesimally small interval of wavelengths. The radiant power density on a surface can be obtained by summing up all the energy contributions from all the photons passing through a surface based on their particular wavelengths. The idea of radiant quantum power density can also be used to describe the spectrum of light radiated by a given object, as well as the spectrum of light that reaches a surface.
After spectrum identification, it is still necessary to determine whether OFFs can be lured by specific wavelengths instead of being attracted by different quantum flux intensities emitted from colored LEDs. Note that the light intensity (measured in watts per meter squared, or power per unit area) decreases with distance from the source. Radiant power density (measured in the same units) can be determined either through the source’s surface or through the receiving surface. In this study, the intensities of different colored LEDs were maintained at the same level during tests, which meant that the quantum flux emitted by each LED should be calibrated before the traps were deployed in an orchard. The luminous intensity of an LED was spherical, so a stepper motor controller (SC300, Zolix Instruments Co. Ltd., China) with a motorized rotation stage (RAK-200, Zolix Instruments Co. Ltd., China), and a quantum sensor (LI-250A and LI-190SA, LI-COR, Inc., U.S.A.) were used to measure the quantum flux of the selected LEDs in a spherical coordinate system. Then, the results were used to plot a 3D profile figure of emission spectra for each LED expressed using the radial distance, polar angle, and azimuth angle (i.e., radius [r], theta [θ], and phi [φ]). A variable resistor was utilized to calibrate the quantum flux of each LED, so the emitted quantum flux of the LED was as similar as possible in all directions. The maximum value of the quantum flux emitted from each of the LEDs was set as 0.09 µmol/m2 s at a distance of 0.23 m, as indicated in Fig. 6. A photo of actual calibration process is shown in Fig. 7. This study also used a level meter to help an LED maintain its position during the calibration. In addition, the LED must be located at the center of the sphere, so a laser pen was used to adjust its intensity by emitting laser beams onto the focus of the biaxial center. The calibrations were conducted in a darkroom where the quantum value was equal to zero. The tested LED operated at 12 V DC was placed at the center of the sphere, and the quantum sensor was located at the zenith (φ = 0°) on the vertical axis. Equipped with a stepper motor driver, an SC300 controller was used to control the one-to-three axis translations, the rotation stages (Zolix motion manager stages software), and an RS232 interface. The quantum flux of each LED was then calibrated by adjusting the variable resistor. When the maximum quantum flux (i.e., 0.09 µmol/m2 s obtained at a distance of 0.23 m) of each colored LED was reached, their corresponding resistance values were recorded at the same time.

Table 1 lists the resistor values required for adjusting the six colored LEDs to the same maximum quantum flux of 0.09 µmol/m2 s at a distance of 0.23 m. Taking a yellow LED as an example, a resistor of 30.3 Ω was required for adjusting its emitted quantum flux to the preset maximum value. These resistors were also installed in an LED control panel placed inside the pest traps as the LED intensity controller (as shown in Fig. 2). All of the variable resistors adjusted the quantum flux according to Table 1, so the six colored LEDs emitted at the same luminous intensity level from all divergent angles to eliminate the impact of inconsistent luminous intensities on capturing the OFFs.
Table 1. Resistor values required for adjusting each colored LED to the same quantum flux
| Color of LED |
Resistor (Ω) |
| White |
704.2 |
| Purple |
334.3 |
| Blue |
768.2 |
| Green |
700.4 |
| Yellow |
30.3 |
| Red |
40.5 |
After the required resistor values were determined, the quantum flux was measured from all the selected divergent angles for each LED. In this process, the X-axis (θ) was rotated by ±180° and the Y-axis (ϕ) was rotated from −30° to 90° using the RAK-200 rotation stage controlled by the SC300 controller. The sensing results for all selected divergent angles for each LED, measured using a quantum sensor, were recorded. The luminous intensity of an LED with the same quantum flux was measured with an increment of 10 degrees, and each test was repeated two times. Figure 8 shows the 3D profile graphs for the test results of the quantum flux emitted by each selected LED. In the figure, the darker color indicates a higher quantum value at the same latitude in the northern hemisphere, and in the southern hemisphere the darker color suggests a lower quantum value. Note that each tested LED was placed at the center of the 3D spherical profile graph. The quantum flux values measured from different divergent angles with the same latitudes were also projected onto flux contours on the horizontal plane, as shown in the subfigures of Fig. 8. Careful inspection of these contours revealed that the maximum quantum flux of all the six colored LEDs, measured at a radius of 0.23 m, was 0.09 µmol/m2 s, which was as expected.

It was also found that the quantum flux measured from different divergent angles with the same latitude might be slightly different. A one-way analysis of variance (ANOVA; performed using GraphPad Prism software v.5.0 [2011; GraphPad Prism, U.S.A.]) was applied to compare the means of the quantum flux measured from different divergent angles and determine whether any of these means were statistically significantly different from each other. The analysis results for all six colored LEDs with respect to each of the selected divergent angles are plotted and shown in Fig. 9. No statistical difference was found among the quantum flux of the six colored LEDs. Nor was the difference statistically significant in the quantum flux of each global sphere (F = 16; df = 5; p < 0.0001). These test results excluded the variations of the emission intensity as a factor influencing the attractiveness of the different colored LEDs.
4. Materials and methods
After the quantum flux calibration, long-term field experiments were conducted to determine which visual stimuli (i.e., a colored LED) might boost the attractiveness to male flies in addition to employing an olfactory stimulus (i.e., ME).
4.1. Determination of deployment distance among traps.
The deployment distance among different traps should be taken into consideration to avoid the mutual interference or light-mixing effect of the LEDs in the experiments. This study therefore adopted a preset quantum value, the maximum quantum flux value of 0.09 µmol/m2 s measured at a distance of 0.23 m away from LEDs, as the reference. Because all selected colored LEDs emitted visible light, their wavelengths were all greater than 380 nm. The quantum energy of any of the six colored LEDs selected in this study was higher than that of visible light with a wavelength of 380 nm. Therefore, the quantum energy of visible light with a wavelength of 380 nm and a quantum flux of 0.09 µmol/m2 s served as the reference to calculate the distance between any two traps deployed in an orchard, and then whether the distance was a proper distance was determined. In addition, the intensity of an LED was inversely proportional to the square of the distance from the light source to a field point (i.e., a measurement point). Such a rule can also be used to determine the proper distance between the deployed pest traps.
The quantum energy of a light source is denoted by E (W/m2) and given by
| \begin{equation}
E = n \times \frac{h \times c}{\lambda},
\end{equation}
| [4] |
where h is the Planck constant (h = 6.62 × 10⁻³⁴ J·s), c is the speed of light (c = 3 × 10⁸ m/s), λ is the wavelength (nm), and n is the quantum flux (µmol/(m2 s)). As described later for the field deployment, the shortest distance between two pest traps was set as 6.9 meters, so the radiant emittance emitted from one LED (i.e., the source point) to the location of another LED (denoted as the field point) was about 2.7 × 10⁻³ W/m2. In this case, the quantum flux value at the field point would decay to 8.68 × 10⁻³ µmol/m2 s, which was a very small value (almost approaching zero). Therefore, if the distance between any two deployed pest traps was greater than 6.9 m, it would be a suitable and proper deployment distance.
4.2. Field deployment.
The experimental site was a wax apple (Syzygium samarangense) orchard located at Kaohsiung District Agricultural Research and Extension Station (KDARES; N22°42′29.12′′, E120°31′52.18′′, altitude: 38 m) in Southern Taiwan, managed by the Council of Agriculture under the Executive Yuan in Taiwan. The relative deployment locations of all YST pest traps and the gateway in the automatic monitoring system are illustrated in Fig. 10. A total of seven pest traps and one gateway were deployed in the orchard. The effective distance of an ME lure for OFFs was up to 36 m.53) However, there seemed no significant differences in the numbers of flies caught between the baits placed 5 m apart or 30–50 m apart in field treatments with an ME dosage similar to that used in this study.54) Given that the shortest distance between the traps in this study was 6.9 m, and the longest one was 13 m, the inference caused by the ME lures was ignored. The influence of colored LEDs between the traps was also ignored because the quantum flux value of the LEDs was almost zero. Note that the colored LEDs inside the traps were switched to TURN-On one by one in a week during the experiments. Solar panels served as the power supply to all devices in the proposed monitoring system. Luminous photos of physical settings of the YST pest traps deployed at KDARES are shown in Fig. 11.

The field experiments were conducted with an experimental group and a control group. There were seven traps in total, each with one of the six colored LEDs or without an LED. For the experimental group, the LED was either set as TURN-On or TURN-Off, except for the control group, in which LEDs were always set as TURN-Off. The LED was set as TURN-On in three experimental conditions: at night, during the day, and for the whole day. To eliminate the location dependency on capturing the OFFs, the location of each deployed trap rotated every day, and all LEDs were switched to TURN-On inside each pest trap. Such an arrangement started at 9 a.m. every day to mimic the scenario of the location changing of the deployed traps. The staff of KDARES counted the number of the captured male and female flies at 8 a.m. every day during the experiments. The experimental period was between February 14 and June 26, 2015. Note that wax apple trees are often in full bloom from February to April, and the fruit generally matures from May to July in Southern Taiwan.55) The temperature in early summer (average temperature 18–30 °C) was suitable for the growth of OFFs56) and mature fruits also attract a large number of the flies, so only the data from April 20 to June 26, 2015 were analyzed.
In this study, two sets of field experiments were conducted to verify the proposed complementary strategy for capturing OFFs. In the first set of the experiments, all LEDs were turned on all day to examine the relationship between time and the capture rate. Then, different colored LEDs were combined with an ME bait to lure OFFs. Specifically, seven arrangements (i.e., six colored LEDs [white, purple, blue, green, yellow, and red] and the absence of LEDs) were used to examine the spectral sensitivities for attracting OFFs. A one-way ANOVA test was utilized to analyze the fly counts under different arrangements. According to the experimental results, the trap (ME bait included) with green, yellow, or red LEDs yielded the strongest capturing effect; the average number of the captured flies was 6.8, 6.3, and 6.1 per day, respectively. However, no significant difference was found between the effects from the green, yellow, and red LEDs. Thus, in the second set of field tests, only the attractiveness of a green, yellow, and red LEDs was examined.
In the second set of the field experiments, three experimental arrangements were tested. In the first arrangement, the traps only contained ME bait. In the second arrangement, the traps contained both an LED (green, yellow, or red) and ME bait. In the third arrangement, the traps only contained an LED (green, yellow, or red). The second set of the field experiments endeavored to determine whether using an LED alone was the best strategy to attract OFFs, or combining an LED with ME bait yielded the best result in luring flies. A one-way ANOVA test was also utilized to analyze the fly counts in different arrangements. In addition, the relationship between the number of captured flies and environmental factors was also examined using a one-way ANOVA test.
5. Results and discussion
5.1. The attractiveness of LEDs with ME bait.
A one-way ANOVA test was performed to examine the relationship between environmental factors and the fly capture rate. A previous study also reported that the number of the trapped flies increased when the monthly average temperature was higher than 20 °C.56) The experimental results of this study showed that the capture rate of the OFFs increased after rain started. Figure 12 shows the number of the trapped flies and environmental parameters from May 27 to June 5, 2015. May 27, 28, and 31 were rainy days. The average of temperature (Temp.) (°C), relative humidity (Humd.) (%), and cumulative and the average numbers of trapped flies collected from May 27 to June 5, 2015 are listed in Table 2. The average temperatures on May 29 and 30, as well as June 1, 2, and 3 were very similar, so the relationship between the number of the trapped flies and the relative humidity could be examined. It was found that relative humidity and the number of captured OFFs were negatively correlated (correlation coefficient r between −0.75 and −0.83), indicating that the number of the trapped flies increased after heavy rain. The increase in the emergence rate of the OFFs might contribute to the phenomenon.

Table 2. Experimental data of the field test from May 27 to June 5, 2015
| Date |
Environmental
parameters |
Cumulative number of trapped flies |
Temp.
(°C) |
Humd.
(%) |
Green
LED + ME |
Yellow
LED + ME |
Red
LED + ME |
ME
without
LED |
Blue
LED + ME |
White
LED + ME |
Purple
LED + ME |
| 5/27 |
24.9 |
92.7 |
8 |
9 |
13 |
7 |
1 |
1 |
1 |
| 5/28 |
26.3 |
89.7 |
12 |
16 |
17 |
11 |
6 |
3 |
4 |
| 5/29 |
29.1 |
81.2 |
20 |
23 |
31 |
13 |
10 |
4 |
5 |
| 5/30 |
29.3 |
80.5 |
20 |
23 |
31 |
13 |
10 |
4 |
5 |
| 5/31 |
25.8 |
93.4 |
20 |
23 |
31 |
13 |
10 |
4 |
5 |
| 6/1 |
28.6 |
70.2 |
44 |
41 |
44 |
31 |
25 |
9 |
13 |
| 6/2 |
29.7 |
62.4 |
48 |
55 |
47 |
34 |
27 |
14 |
15 |
| 6/3 |
30.6 |
58.2 |
56 |
56 |
51 |
41 |
28 |
17 |
15 |
| 6/4 |
24.8 |
75.6 |
64 |
59 |
51 |
45 |
28 |
18 |
16 |
| 6/5 |
25.4 |
73.0 |
72 |
61 |
52 |
47 |
28 |
19 |
17 |
| AVG |
|
|
7.2 |
6.1 |
5.2 |
4.7 |
2.8 |
1.9 |
1.7 |
| SD |
|
|
6.7 |
6.2 |
5.8 |
5.3 |
4.6 |
1.9 |
2.4 |
In the first set of field experiments, the spectral sensitivities of capturing OFFs were examined using seven arrangements in which ME bait was paired with one of six colored LEDs (white, purple, blue, green, yellow, and red) or functioned alone. As an illustration, Fig. 13 shows the number of the trapped flies when an ME bait was combined with a red or a blue LED on May 27, 2015. The experimental results indicated that it was possible to capture OFFs throughout the day. Moreover, as indicated in Figs. 5 and 9, there was a significant spectrum difference between the red LED and blue LED. The fly capture rate was better when a red LED was employed, and such a result was very similar to the reports of lab tests.25) Note that the number of the captured flies during the night was not equal to zero, though the number of the flies was higher during the daytime. Meanwhile, a blue LED yielded a poor capture rate, and this capture rate was even lower than the rate of combining the LED with ME bait. Similar capture results were found on other days during the experiments. These results demonstrated the possibility of pairing a red LED with ME bait to improve fly capturing efficiency. In addition, some of the colored LEDs (e.g., blue LEDs) with less effective capture results may be considered as an expelling strategy for the OFFs.

The experimental results also showed that a trap that contained green, yellow, or red LEDs paired with ME bait may capture more flies, compared with a trap with blue, purple, or while LEDs combined with ME bait, or a trap only employing ME bait. The total number of flies captured by the trap equipped with a green LED was significantly higher than that captured by the trap with a purple LED (difference of 55 flies). Thus, using a visual cue to increase the capture rate of OFFs seems feasible.
A one-way ANOVA test was also performed to further investigate the effect of different colored LEDs on capturing OFFs. Figure 14 shows the average capturing effectiveness when different colored LEDs were paired with ME bait from February 20 to June 26, 2015. The average number of captured flies was between 6.1 and 6.8 per day when ME bait was combined with green, yellow, or red LEDs, and the average number of captured flies was between 2.2 and 4.1 per day when ME bait was paired with white, purple, blue LEDs, or no LED. The average difference in the number of caught flies per day varied between 1 and 2.7. The capturing effect of ME bait accompanied with green, yellow, and red LEDs was stronger than that with white, purple, blue LEDs, or no LED, when the ME bait was present (p < 0.05). No significant difference (F = 30; df = 6; p > 0.05) was found between green, yellow, or red LEDs. Based on these results, several spectral cues may be related to the capturing effect. Using ME bait, the green, yellow, and red LEDs showed the strongest capturing effect, indicating that the chromatic stimulation of the spectra between 500 and 570 nm and between 580 and 650 nm contained crucial cues in attracting OFFs. In addition, the broadest spectrum was found when white or purple LEDs were paired with ME bait, but the capturing effect of such arrangements on attracting OFFs seemed weak, and their attraction effect was similar to the effect of a trap containing a blue LED or a trap containing ME bait alone. Thus, it is reasonable to assume that the capturing effect decreases due to a negative cue in the spectrum between 450 and 490 nm.

In the second set of the experiments, three experimental arrangements were examined. For the first arrangement, the trap only contained ME bait. For the second arrangement, the trap contained both ME bait and LEDs (green, yellow, or red). For the third arrangement, the trap contained LEDs (green, yellow, or red) alone. All seven traps were deployed from June 1 to June 26, 2015. Figure 15 shows the number of the trapped flies and environmental parameters from June 8 to June 22, 2015. Due to a system malfunction, data from June 13, 14, 19, 20, and 21 were removed from the analysis. Until June 22, 2015, for example, there were 149 trapped flies with the first arrangement (ME bait only). For example, the cumulative number of the trapped flies when colored LEDs (green, yellow, or red) were paired with ME bait was 151, 215, and 86, respectively. When the trap employed LEDs (green, yellow, or red) alone, the cumulative numbers of trapped flies were 63, 60, and 51, respectively. Compared with olfactory lures and complementary types, the number of OFFs caught may be less if only visual lures were used. This is because pests are mainly attracted by olfactory cues, and visual attraction can be used as a secondary mechanism. Thus, the combination of LEDs and ME bait generally yielded a better capture result than other arrangements (such as using LEDs or ME bait alone). The number of the flies captured using ME bait was much closer to the number of the flies caught by combining a green LED with ME bait. When the effects of employing different colored LEDs were compared, it was found that pairing a yellow LED with ME bait yielded the best results in capturing OFFs.

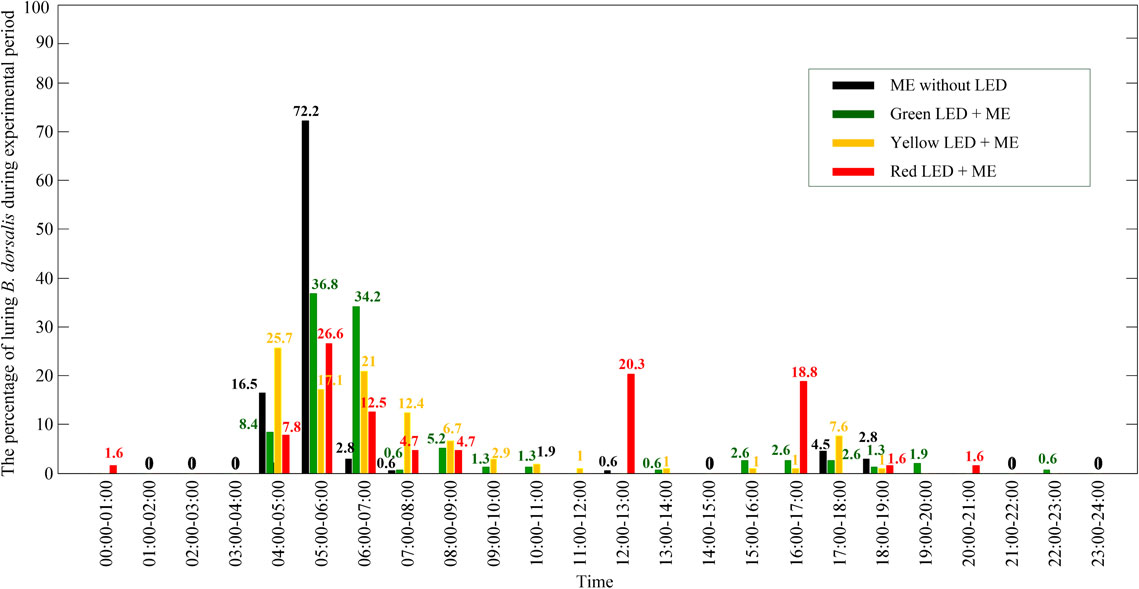
Further, hourly capture rates of OFFs were calculated to examine the performance of colored LEDs at certain times. The hourly capture rate was defined as the number of the trapped flies at each hour to the total number of trapped flies during the experimental period. Figure 16 showed the hourly capture rates for traps containing both ME bait and LEDs (green, yellow, or red) or employing ME bait alone. The time of sunrise from May 27 to June 22 was close to 5:30 a.m. It was found that traps containing LEDs with three colors (green, yellow, or red) and ME bait attracted more OFFs, compared with using ME bait alone. For trapping flies without employing any LED (i.e., only ME was included), the sum of hourly capture percentage was about 88.7%, occurring in the early morning from 4 to 6 a.m., and the trap was also able to continue to lure the flies between 4 and 7 p.m. at a percentage of 7.3%. This was because OFFs are especially active at sunrise and is active again at sunset.17) Additionally, the hourly capture percentage for employing green, yellow, or red LEDs combined with ME bait, and adopting ME bait alone (without an LED present) at different time points was analyzed. It was found that LEDs of the three colors can attract flies throughout the day. The sums of hourly capture rates combined with ME bait with green, yellow, and red LEDs were 85.2%, 82.9%, and 56.3% from 4 to 9 p.m., respectively. The high hourly capture rates fell between 4 and 9 a.m., but the traps still lured OFFs from 4 to 7 p.m. The hourly capture percentages during that time period (from 4 to 7 p.m.) for green, yellow, and red LEDs were 6.5%, 9.6%, and 20.4%. Among the three colored LEDs, the red LED was able to attract the OFFs before dawn, in the early morning, at noon, and in the evening. With ME bait, about 20.3% of OFFs were lured by the red LED from 12 to 1 p.m., and 18.8% were attracted from 4 to 5 p.m. Thus, the OFFs did not have a preference over a certain spectrum at different time points within the day. Based on such quantitative information of pest populations from the complementary cue mechanism and automatic counting trap, farmers will be able to effectively conduct an IPM program on their land to control pest damage during different cultivation stages of agricultural crops. Therefore, with the proposed OFF capturing method, not only will the efficiency of trapping the fruit flies increase, but pesticide uses and pest population damage will also be reduced. The sustainability of the agroecological system is therefore enhanced.
6. Conclusion
This study proposed a complementary capturing strategy that combines visual and olfactory cues to capture Bactrocera dorsalis (Hendel) (Diptera: Tephritidae). An IoT-based pest monitoring system was developed and deployed in an orchard for long-term pest monitoring. The monitoring system included front-end sensing devices and a back-end database. The front-end sensing devices automatically measured not only the number of the captured male OFFs but also the environmental parameters including air temperature, relative humidity, and illumination. Then, two sets of field experiments with different arrangements of LEDs with different colors and the chemical attractant were conducted to examine the attractiveness of the trap. The experimental data were analyzed by one-way ANOVA models to find the relationship between the number of the captured flies and the use of colored LEDs and an ME bait.
In the first set of field experiments, the capturing effect of the automatic counting trap that paired a colored LED with an ME bait on attracting the OFF was investigated. A total of seven arrangements, including the combinations of an ME bait and six colored LEDs (white (450 ± 20 nm and 550 ± 96 nm), purple (450 ± 23 nm and 648 ± 56 nm), blue (465 ± 21 nm), green (524 ± 29 nm), yellow (598 ± 15 nm), and red (634 ± 18 nm)) or the absence of an LED, were designed to determine the best capturing combination of the LED and the ME bait. A cross-comparison was also conducted using the second set of field experiments. It is found that with the ME bait, the capturing rate for the red LED is significantly higher than that for the white, purple, blue LED, and no LED (only the ME is present), but no significant capturing difference is found among the green, yellow, and red LED. Thus, the higher capturing results of the combinations of the green/yellow/red LED and ME bait indicate that the chromatic stimulation of the spectra between 500 and 570 nm and between 580 and 650 nm contain crucial cues to attract OFFs. Moreover, with the ME bait, the white and purple LED yield the broadest spectrum, but the capturing results for these LEDs are very similar to the effect brought by the blue LED or the effect caused solely by the ME bait (i.e., no LED is employed). Thus, it is reasonable to assume that a negative cue that reduces the capturing effect is in the spectrum between 450 and 490 nm. The results also show that with the complementary capturing strategy (both visual and olfactory cues) the number of the captured OFFs is higher than that using a visual or an olfactory cue alone.
More cross comparisons were made based on the data obtained from the second set of the capturing experiments. It is found that with a green, yellow, or red LED, the cumulative number of the captured OFFs is higher during the daytime, but it is still possible to capture the flies at night by using the three colored LEDs. All experimental results indicate that the proposed complementary capturing strategy has great potential to increase the number of captured OFFs in orchards.
In the future, more thorough controlled studies will be conducted. Different combinations of attractants and light, various pest species, female fly attractants, experiment replication, less expensive LED replacements, and the effects on the interference of ME baits will be considered to improve the validity of complementary use of visual and olfactory cues for OFFs. Given that the cost of employing LEDs may become an issue, a cost-benefit analysis of employing a trap with an LED attractant will be performed in the future to examine the damage reduction associated with pest outbreaks and increasing productivity of agricultural products.
Apart from the aforementioned research findings, the use of an IoT-based pest monitoring system, such as the one adopted in this study, shows the possibility of automatic pest management. In fact, many researchers have devoted themselves to developing various “smart traps” that generally involve an IoT-based framework, and sensing and imaging technologies to automatically collect and transmit monitoring data in a real-time manner.57) The collected data can be analyzed using artificial intelligence techniques to establish different models for fly behavior or outbreaks. With an accurate combination of visual and olfactory cues, the automatic monitoring system used in this study will become an effective tool to agricultural pest management, given its advantages of efficiently capturing OFFs while saving labor and time, providing accurate information regarding the increase of pest populations, and enabling long-term monitoring data collection in real time.
Acknowledgements
This work was supported financially in part by the Ministry of Science and Technology and the Council of Agriculture of the Executive Yuan, Taiwan, under grant numbers: MOST 109-2321-B-002-043, MOST 109-2811-B-002-521, MOST 109-2221-E-002-060-MY3, MOST 110-2321-B-002-013, and 110AS-1.6.5-ST-a1. The authors would like to thank Prof. Ping-Lang Yen in Department of Biomechatronics Engineering, National Taiwan University, and the members of their research team for their valuable suggestions and contributions to this work.
Notes
Edited by Naoko NISHIZAWA, M.J.A.
Correspondence should be addressed to: J.-A. Jiang, Department of Biomechatronics Engineering, National Taiwan University, No. 1, Sec. 4, Roosevelt Rd., Taipei 10617, Taiwan (e-mail: jajiang@ntu.edu.tw); J.-C. Wang, Department of Computer Science, National Taipei University of Education, No. 134, Sec. 2, Heping E. Rd., Da-an District, Taipei 10671, Taiwan (e-mail: jcwang@mail.ntue.edu.tw).
Footnotes
Equal contribution.
References
- 1) Okuyama, T., Yang, E.C., Chen, C.P., Lin, T.S., Chuang, C.L. and Jinag, J.A. (2011) Using automated monitoring systems to uncover pest population dynamics in agricultural fields. Agric. Syst. 104, 666–670.
- 2) Jang, E.B. and Light, D.M. (1996) Olfactory semiochemicals of tephritids. In Fruit Fly Pests: A World Assessment of Their Biology and Management (eds. McPheron, B.A. and Steck, G.J.). St. Lucie Press, Delray Beach, Florida, USA, pp. 73–90.
- 3) Alyokhin, A.V., Messing, R.H. and Duan, J.J. (2000) Visual and olfactory stimuli and fruit maturity affect trap captures of oriental fruit flies (Diptera: Tephritidae). J. Econ. Entomol. 93, 644–649.
- 4) Cornelius, M.L., Nergel, L., Duan, J.J. and Messing, R.H. (2000) Responses of female oriental fruit flies (Diptera: Tephritidae) to protein and host fruit odors in field cage and open field tests. Environ. Entomol. 29, 14–19.
- 5) Nor, S.M., Mohamed, S., Sajili, M.H. and Ngah, N. (2018) Ovipositional behavior preference of Oriental Fruit Fly, Bactrocera dorsalis Hendel (Diptera: Tephritidae) on different host fruits. J. Agrobiotech. 9, 173–181.
- 6) Liquido, N.J., McQuate, G.T., Birnbaum, A.L., Hanlin, M.A., Nakamichi, K.A., Inskeep, J.R. et al. (2017) A review of recorded host plants of Oriental Fruit Fly, Bactrocera dorsalis (Hendel) (Diptera: Tephritidae), version 3.0. Available online at USDA Compendium of Fruit Fly Host Information (CoFFHI), https://coffhi.cphst.org/.
- 7) Metcalf, R.L. and Metcalf, E.R. (1992) Fruit flies of the family Tephritidae. In Plant Kairomones in Insect Ecology and Control (eds. Metcalf, R.L. and Metcalf, E.R.). Chapman and Hall, New York, USA, pp. 109–152.
- 8) Ye, H. and Liu, J.H. (2005) Population dynamics of the oriental fruit fly, Bactrocera dorsalis (Diptera: Tephritidae) in the Kunming area, south western China. Insect Sci. 12, 387–392.
- 9) Zeng, Y., Reddy, G.V.P., Li, Z., Qin, Y., Wang, Y., Pan, X. et al. (2019) Global distribution and invasion pattern of oriental fruit fly, Bactrocera dorsalis (Diptera: Tephritidae). J. Appl. Entomol. 143, 165–176.
- 10) Follett, P.A. and Armstrong, J.W. (2004) Revised irradiation doses to control melon fly, Mediterranean fruit fly, and Oriental fruit fly (Diptera: Tephritidae) and a generic dose for Tephritid fruit flies. J. Econ. Entomol. 97, 1254–1262.
- 11) Jin, T., Zeng, L., Lu, Y.Y. and Liang, G.W. (2011) Insecticide resistance of the oriental fruit fly, Bactrocera dorsalis (Hendel) (Diptera: Tephritidae), in mainland China. Pest Manag. Sci. 67, 370–376.
- 12) Nakamori, H., Nishimura, M. and Kakinohana, H. (1991) Eradication of the oriental fruit fly, Dacus dorsalis Hendel (Diptera: Tephiritidae), from Miyako and Yaeyama Islands by the male annihilation method. In Fruit Flies in the Tropics (Proceedings of the First International Symposium, 14–16 March 1988, Kuala Lumpur, Malaysia) (eds. Vijaysegaran, S. and Ibrahim, A.G.). Malaysian Agricultural Research and Development Institute (MARDI), Seri Kembangan, Selangor, Malaysia, pp. 220–231.
- 13) Koyama, T., Teruya, T. and Tanaka, K. (1984) Eradication of the oriental fruit fly (Diptera: Tephritidae) from the Okinawa islands by a male annihilation method. J. Econ. Entomol. 77, 468–472.
- 14) Chen, P.H., Wu, W.J. and Hsu, J.C. (2019) Detection of male oriental fruit fly (Diptera: Tephritidae) susceptibility to naled- and fipronil-intoxicated methyl eugenol. J. Econ. Entomol. 112, 316–323.
- 15) Pan, Z.P., Lu, Y.Y., Zeng, L. and Zeng, X.N. (2008) Development of resistance to trichlorophon, alphamethrin, and abamectin in laboratory populations of the oriental fruit fly, Bactrocera dorsalis (Hendel) (Diptera: Tephritidae). Acta Ecol. Sin. 51, 609–617.
- 16) Lin, Y.Y., Jin, T., Zeng, L. and Lu, Y.Y. (2014) Toxicities of three insecticides to Bactrocera dorsalis (Hendel) adults with different adult density, age and gender. J. Econ. Entomol. 36, 737–743.
- 17) Jiang, J.A., Tseng, C.L., Lu, F.M., Yang, E.C., Wu, Z.S., Chen, C.P. et al. (2008) A GSM-based remote wireless automatic monitoring system for field information: A case study for ecological monitoring of the oriental fruit fly, Bactrocera dorsalis (Hendel). Comput. Electron. Agric. 62, 243–259.
- 18) Jiang, J.A., Lin, T.S., Yang, E.C., Tseng, C.L., Chen, C.P., Yen, C.W. et al. (2013) Application of a web-based remote agro-ecological monitoring system for observing spatial distribution and dynamics of Bactrocera dorsalis in fruit orchards. Precis. Agric. 14, 323–342.
- 19) Chuang, C.L., Yang, E.C., Tseng, C.L., Chen, C.P., Lien, G.S. and Jiang, J.A. (2014) Toward anticipating pest responses to fruit farms: revealing factors influencing the population dynamics of the oriental fruit fly via automatic field monitoring. Comput. Electron. Agric. 109, 148–161.
- 20) Katsoyannos, B.I. (1989) Response to shape, size and color. In World Crop Pests, Vol. 3A, Fruit Flies, their Biology, Natural Enemies and Control (eds. Robinson, A.S. and Hooper, G.). Elsevier, Amsterdam, The Netherlands, pp. 307–324.
- 21) Roessler, Y. (1989) Insecticidal bait and cover sprays. In World Crop Pests, Vol. 3B, Fruit Flies, their Biology, Natural Enemies and Control (eds. Robinson, A.S. and Hooper, G.). Elsevier, Amsterdam, The Netherlands, pp. 329–336.
- 22) Vargas, R.I., Stark, J.D. and Prokopy, R.J. (1991) Response of oriental fruit fly (Diptera: Tephritidae) and associated parasitoids (Hymenoptera: Braconidae) to different-color spheres. J. Econ. Entomol. 84, 1503–1507.
- 23) Yang, E.C., Lee, D.W. and Wu, W.Y. (2003) Action spectra of phototactic responses of the flea beetle, Phyllotreta striolata. Physiol. Entomol. 28, 362–367.
- 24) Hoel, D.F., Butler, J.F., Fawaz, E.Y., Watany, N., El-Hossary, S.S. and Villinski, J. (2007) Response of phlebotomine sand flies to light-emitting diode-modified light traps in southern Egypt. J. Vector Ecol. 32, 302–308.
- 25) Wu, W.Y., Chen, Y.B. and Yang, E.C. (2007) Chromatic cues to trap the oriental fruit fly, Bactrocera dorsalis. J. Insect Physiol. 53, 509–516.
- 26) Pickens, L.G., Miller, R.W. and Campbell, L.E. (1975) Bait-light combinations evaluated as attractants for house flies and stable flies (Diptera: Muscidae). J. Med. Entomol. 11, 749–751.
- 27) Müller, G.C., Hogsette, J.A., Kline, D.L., Beier, J.C., Revay, E.E. and Xue, R.D. (2015) Response of the sand fly Phlebotomus papatasi to visual, physical and chemical attraction features in the field. Acta Trop. 141, 32–36.
- 28) Prokopy, R.J., Green, T.A. and Vargas, R.I. (1990) Dacus dorsalis flies can learn to find and accept host fruit. J. Insect Behav. 3, 663–672.
- 29) Jang, E.B. and Light, D.M. (1991) Behavioral responses of female oriental fruit flies to the odor of papayas at three ripeness stages in a laboratory flight tunnel (Diptera: Tephritidae). J. Insect Behav. 4, 751–762.
- 30) Elijah, O., Orikumhi, I., Rahman, T.A., Babale, S.A. and Orakwue, S.I. (2017) Enabling smart agriculture in Nigeria: Application of IoT and data analytics. In IEEE 3rd International Conference on Electro-Technology for National Development (NIGERCON), Owerri, Nigeria, 2017, pp. 762–766.
- 31) Wolfert, S., Ge, L., Verdouw, C. and Bogaardt, M.J. (2017) Big data in smart farming—A review. Agric. Syst. 153, 69–80.
- 32) Elijah, O., Rahman, T.A., Orikumhi, I., Leow, C.Y. and Hindia, M.H.D.N. (2018) An overview of internet of things (IoT) and data analytics in agriculture: Benefits and challenges. IEEE Internet Things J. 5, 3758–3773.
- 33) Khanna, A. and Kaur, S. (2019) Evolution of Internet of Things (IoT) and its significant impact in the field of Precision Agriculture. Comput. Electron. Agric. 157, 218–231.
- 34) Liao, M.S., Chuang, C.L., Lin, T.S., Chen, C.P., Zheng, X.Y., Chen, P.T. et al. (2012) Development of an autonomous early warning system for Bactrocera dorsalis (Hendel) outbreaks in remote fruit orchards. Comput. Electron. Agric. 88, 1–12.
- 35) Jiang, J.A., Wang, C.H., Chen, C.H., Liao, M.S., Su, Y.L., Yang, E.C. et al. (2016) A WSN-based automatic monitoring system for the foraging behavior of honey bees and environmental factors of beehive. Comput. Electron. Agric. 126, 304–318.
- 36) Jiang, J.A., Wang, C.H., Liao, M.S., Zheng, X.Y., Liu, J.H., Chuang, C.L. et al. (2016) A wireless sensor network-based monitoring system with dynamic convergecast tree algorithm for precision cultivation management in orchid greenhouses. Precis. Agric. 17, 766–785.
- 37) Liao, M.S., Chen, S.F., Chou, C.Y., Chen, H.Y., Yeh, S.H., Chang, Y.C. et al. (2017) On precisely relating the growth of Phalaenopsis leaves to greenhouse environmental factors by using an IoT-based monitoring system. Comput. Electron. Agric. 136, 125–139.
- 38) García-Lesta, D., Cabello, D., Ferro, E., López, P. and Brea, V.M. (2017) Wireless sensor network with perpetual motes for terrestrial snail activity monitoring. IEEE Sens. J. 17, 5008–5015.
- 39) Xu, J., Gu, B. and Tian, G. (2022) Review of agricultural IoT technology. Artif. Intell. Agric. 6, 10–22.
- 40) Viani, F., Bertolli, M., Salucci, M. and Polo, A. (2017) Low-cost wireless monitoring and decision support for water saving in agriculture. IEEE Sens. J. 17, 4299–4309.
- 41) Zhang, P., Zhang, Q., Liu, F., Li, J., Cao, N. and Song, C. (2017) The construction of the integration of water and fertilizer smart water saving irrigation system based on big data. In IEEE International Conference on Computational Science and Engineering (CSE) and IEEE International Conference on Embedded and Ubiquitous Computing (EUC), Guangzhou, China, 2017, pp. 392–397.
- 42) Rajapaksha, T.T., Alexander, A., Fernando, L., Than, A. and Nguyen, H.L. (2022) Real-time weather monitoring and IoT-based palmtop device for smart agriculture. SN Comput. Sci. 3, 91.
- 43) Na, A., Isaac, W., Varshney, S. and Khan, E. (2016) An IoT based system for remote monitoring of soil characteristics. In International Conference on Information Technology (InCITe) - The Next Generation IT Summit on the Theme - Internet of Things: Connect your Worlds, Noida, India, 2016, pp. 316–320.
- 44) Lee, H., Moon, A., Moon, K. and Lee, Y. (2017) Disease and pest prediction IoT system in orchard: A preliminary study. In Ninth International Conference on Ubiquitous and Future Networks (ICUFN), Milan, Italy, pp. 525–527.
- 45) Giri, A., Dutta, S. and Neogy, S. (2016) Enabling agricultural automation to optimize utilization of water fertilizer and insecticides by implementing Internet of Things (IoT). In International Conference on Information Technology (InCITe) - The Next Generation IT Summit on the Theme - Internet of Things: Connect your Worlds, Noida, India, 2016, pp. 125–131.
- 46) Goldshtein, E., Cohen, Y., Hetzroni, A., Gazit, Y., Timar, D., Rosenfeld, L. et al. (2017) Development of an automatic monitoring trap for Mediterranean fruit fly (Ceratitis capitata) to optimize control applications frequency. Comput. Electron. Agric. 139, 115–125.
- 47) Shaked, B., Amore, A., Ioannou, C., Valdés, F., Alorda, B., Papanastasiou, S. et al. (2018) Electronic traps for detection and population monitoring of adult fruit flies (Diptera: Tephritidae). J. Appl. Entomol. 142, 43–51.
- 48) Lima, M.C.F., Damascena de Almeida Leandro, M.E., Valero, C., Coronel, L.C.P. and Bazzo, C.O.G. (2020) Automatic detection and monitoring of insect pests—A review. Agriculture 10, 161.
- 49) Huang, R., Yao, T., Zhan, C., Zhang, G. and Zheng, Y. (2021) A motor-driven and computer vision-based intelligent e-trap for monitoring citrus flies. Agriculture 11, 460.
- 50) Ascolese, R., Gargiulo, S., Pace, R., Nappa, P., Griffo, R., Nugnes, F. et al. (2022) E-traps: A valuable monitoring tool to be improved. EPPO Bull. 52, 175–184.
- 51) Sheu, J.P., Chang, C.J., Sun, C.Y. and Hu, W.K. (2008) WSNTB: A testbed for heterogeneous wireless sensor networks. In Proceedings of the 2008 First IEEE International Conference on Ubi-Media Computing, 31 July–1 August 2008, Lanzhou, China, pp. 338–343.
- 52) Chuang, Y.Y. and Hou, R.F. (2008) Field tests and evaluation of the attract-and-kill effectiveness of improved long-lasting, high-efficiency traps coated in different colors against the oriental fruit fly, Bactrocera dorsalis (Hendel). Formos. Entomol. 28, 259–276 (in Chinese with English abstract).
- 53) Manoukis, N.C., Siderhurst, M. and Jang, E.B. (2015) Field estimates of attraction of Ceratitis capitata to trimedlure and Bactrocera dorsalis (Diptera: Tephritidae) to methyl eugenol in varying environments. Environ. Entomol. 44, 695–703.
- 54) Chen, C.C., Dong, Y.J., Wen, H.C., Chung, Y.Y., Yang, T.C. and Hou, K.Y. (2010) Field evaluation of the trapping efficiency of a pest formulation of methyl eugenol for the oriental fruit fly. Formos. Entomol. 30, 65–76 (in Chinese with English abstract).
- 55) Wang, D.N., Shu, Z.H. and Sheen, T.F. (1994) Wax apple production in Taiwan. Chron. Hortic. 35, 11–12.
- 56) Chen, P., Ye, H. and Liu, J. (2006) Population dynamics of Bactrocera dorsalis (Diptera: Tephritidae) and analysis of the factors influencing the population in Ruili, Yunnan Province, China. Acta Ecol. Sin. 26, 2801–2808.
- 57) Lello, F., Dida, M., Mkiramweni, M., Matiko, J., Akol, R., Nsabagwa, M. et al. (2023) Fruit fly automatic detection and monitoring techniques: A review. Smart Agric. Technol. 5, 100294.
Non-standard abbreviation list
4Gfourth generation
ANOVAanalysis of variance
GSMGlobal System for Mobile Communications
IoTinternet of things
IPMintegrated pest management
KDARESKaohsiung District Agricultural Research and Extension Station
LEDlight-emitting diode
MEmethyl eugenol
OFForiental fruit fly
SMSshort message service
YSTYi-Shan trap


