Abstract
Six months after the explosion of TEPCO’s Fukushima Dai-ichi nuclear power plant, radioactive silver (110mAg), was detected in concentrations of 3754 Bq/kg in Nephila clavata (the orb-web spider; Joro-gumo in Japanese) collected at Nimaibashi, Iitate village in Fukushima Prefecture, whereas 110mAg in the soil was 43.1 Bq/kg. A survey of 35 faunal species in the terrestrial environment during the 3.5 years after the accident showed that most of Anthropoda had two orders higher 110mAg in their tissues than soils, although silver is not an essential element for their life. However, tracing of the activity of 110mAg detected in spider Atypus karschi collected regularly at a fixed location showed that it declined much faster than the physical half-life. These results suggest that 110mAg was at once biologically concentrated by faunal species, especially Arthropoda, through food chain. The factors affecting the subsequent rapid decline of 110mAg concentration in faunal species are discussed.
Introduction
After the Great East Japan Earthquake and resulting Tsunami on March 11, 2011, a sequential meltdown of the nuclear fuels occurred at the Fukushima Dai-ichi nuclear power plant (NPP) of Tokyo Electric Power Company (TEPCO), following the discharge of enormous amounts of radioactive materials into the environment. The main components were 131I, 133I, 134Cs and 137Cs, whose total amounts were estimated to be 1.5 × 10¹⁷ Bq for 131I, 1.2 × 10¹⁶ Bq for 137Cs, and also 6.3 × 10¹⁷ Bq in iodine equivalent.1) Roughly half of the discharged activity had precipitated in soils and entered inland waters, where it was incorporated into flora and fauna in the terrestrial environment.2) Among a number of attempts to reveal the scale and distribution of the fallout, our group also started to survey local and biological contamination with the radioactivity in the vicinity of the TEPCO’s NPP. On Sept. 20, 2011, we visited one of the heavily contaminated area, Iitate village in Fukushima Prefecture, where had already been declared to be the “planned evacuation zone”. It was a stormy day with heavy rain of typhoon and we had to abandon our original plan to collect vegetation samples, instead we collected the orb-web spider Nephila clavata (Joro-gumo in Japanese), which nested in abundance in a bamboo forest. Our initial conjecture was that the spiders might be contaminated with radioactive cesium reflecting contamination of the food chain. Unexpectedly, however, germanium-semiconductor analysis in the laboratory of the N. clavata specimens showed a sharp peak (657.8 keV) of 110mAg distinct from the 137Cs peak (661.7 keV). This was the beginning to recognize marked biological concentration of 110mAg in the field fauna during this accident, which was publicized preliminary.3)
In fact, radioactive silver, 110mAg (half-life: 249.95 days), first attracted attention as the atomic weapon detritus, whose distinct biological accumulation was detected in the digestive tissues of a marine crustacean and mussels, barnacles, and fishes from the Pacific Ocean due to the repeated test explosions at Entwetok Atoll, Bikini Atoll etc., from 1946 to 1963.4),5) 110mAg had also been detected as a minor radioactive nuclide contained in wastewater from NPPs, however, the Chernobyl accident on April 26, 1986 caused its discharge in a large amount into the environment. For example, in Cumbria, northwestern England located ∼2000 km from Chernobyl, all vegetation in 18 varietal soils sampled in May 1986 was contaminated with 110mAg with concentrations ranging from 190 to 480 Bq/kg of dryweight (DW).6) Many studies were conducted on the metabolism of 110mAg in the fallout of the accident by aquatic biota especially in oceans.7)–9) Studies on cattle such as oxen, lambs and sheep revealed that distinct accumulation of 110mAg was rather restricted to liver with the biological half-life of 35 days in the case of sheep.6),10)–12) In contrast to these studies, contamination of terrestrial wild fauna involving small insects and animals remained very scarce.
Even in the accident at TEPCO’s NPP, studies on the contamination of fauna were mostly restricted to cattle. After the accident, 110mAg was detected in the liver of cattle at a concentration of 177 ± 176 Bq/kg,13) and a 3-month supply of clean hay as fodder to the contaminated cattle failed to decrease its contents in liver significantly.14) In contrast, no published studies exist on the dynamics of 110mAg in small faunal species comprising the food chain in terrestrial environments. Therefore, we conducted successive surveillance of 110mAg in spiders as well as several small animals and insects during our visits to Fukushima once a month until November 2014. The obtained results confirmed the reproducible accumulation of 110mAg in small faunal species. Here, we describe the contamination of 35 of these species by 110mAg and 137Cs (or 134Cs) fallout and the fates of those radionuclides in the bodies of the orb-web spider N. clavata and the ground spider Atypus karschi in the 3.5 years after the NPP accident.
Materials and methods
Sampling of fauna species and soils.
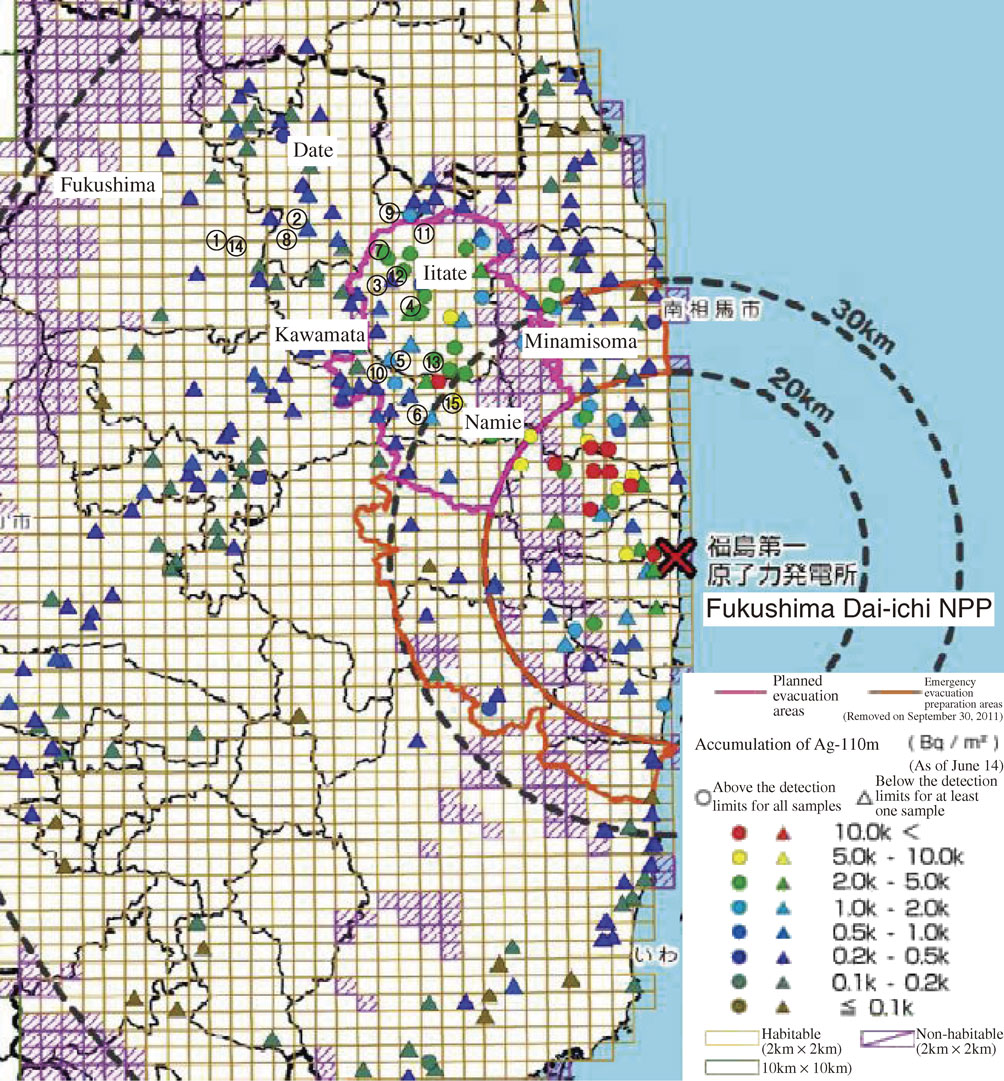
From Sept. 20, 2011 until Nov. 3, 2014, we collected 35 faunal species from Benten-yama and Hanami-yama in Fukushima city, Oguni, Miyuki-yama and Ryozen in Date city, Tsushima and Akougi in Namie town, Yamakiya in Kawamata town and Nimaibashi, Iitoi, Hiso, Maeda, Sasu, Usuishi and Nagadoro in Iitate village in Fukushima Prefecture (Fig. 1). The sampling sites were located more than 30 km from Fukushima Dai-ichi NPP. Most of the collected species were separately stored in plastic 100-mL cups to avoid their preying on each other. Names of all collected species are listed in Table 3. The collected fauna were starved at room temperature for ∼3 weeks in the U8-cups, which were stored in desiccators. During the starvation process, some of the fauna excreted feces and urine before their death. Starvation was necessary to allow measurement of the true radioactivity in the body tissues of the collected fauna, after they had excreted residual, non-metabolized contamination in their feces and urine. For some of the fauna, the radioactivity in the desiccated feces was also measured.
Our visit to the Hiso on Oct. 13, 2013 coincided with the pregnancy phase of N. clavata females. We collected 85 of the pregnant spiders, separately storing them in U8-cups. These spiders were starved under dark conditions until some of them had spun webs and shed their egg sacs into the cups. Spider bodies, excrement (feces + urine), web thread, and egg sacs were separately collected and their radioactivity was measured. We also collected soil from the sites where N. clavata and A. karschi had been sampled. Surface soils were collected from an area of 10 × 10 × 2 cm. A vertical depth of 2 cm was chosen because >95% of nuclear fallout accumulates within a vertical depth of 2 cm from the soil surface.15),16)
Measurement of radioactivity.
The detection of the discharged 110mAg in the atmospheric dust from the TEPCO’s NPP was first recognized by several institutions from March to May in 2011,17)–19) and its total amount was estimated to be 4.04–6.41 × 10¹⁵ Bq in the cores of Units 1–3 of the NPP.20) The Ministry of Education, Culture, Sports, Science and Technology, Japan, published a rough distribution map of 110mAg in soils on Oct. 31, 2011 (Fig. 1),21) and its distribution in surface soils in a wide area around the power plant22)–24) as well as the vertical distribution profile in Fukushima soils16) were described a year later the accident.
The aerial dose (µSv/h) was measured in the contaminated fields at a height of 1 m from the sampling sites using an Aloka γ-survey meter (TCS-172; Hitachi-Aloka, Tokyo, Japan). In the laboratory, all materials were analyzed on germanium-semiconductor detectors (GEM type and GMX type, Seiko EG&G, Tokyo, Japan). The counting time was set at 220,000 s. 110mAg, 137Cs, and 134Cs activities were determined using the γ-ray detector, detecting peaks at 884.7, 661.7, and 604.7 keV, respectively. Multiple number of animals in each sample (Table 3) was put together in a cup and measured. Therefore no statistical errors were expressed in Tables. The concentration of the measured radioactivity was expressed as Bq/kgDW. Radioactivity in snakes, slugs, and tadpoles, all of which had high water content, and melted during starvation process was measured without desiccation of the specimens and expressed as Bq/kgFW, where FW is the fresh weight.
Imaging analysis.
N. clavata specimens were gently flattened between paper towels, allowed to air-dry completely, and then exposed to BAS imaging plates (IP-plate; FujiFilm, Tokyo, Japan). An image of the vertical distribution of the radioactivity in the soil profile was obtained by exposing the vertical soil layer collected in a lunchbox (13 × 7.5 × 6 cm) to an IP-plate. In both cases, polyethylene film was placed between the sample and the IP-plate to avoid chemical- or water-related disturbances of the sensitivity of the IP-plate to the samples. After ∼1 month of exposure, the IP-plates were scanned using an Image-analyzer (FLA-5000; FujiFilm). The feces of lizards and other fauna were observed by digital microscopy (KEYENCE VH-6300).
Results
Detection of 110mAg in N. clavata.
Figure 2 shows the γ-radiation from N. clavata (sample no. 3 in Table 3) detected by Ge-semiconductor analysis. Energy peaks corresponding to 137Cs (661.7 keV), 110mAg (657.8 keV), and three other peaks characteristic of 110mAg (884.7, 937.5, and 1384 keV) were obtained from the same sample. The radioactivity ratio of 110mAg/134Cs/137Cs was 1/1.12/1.50.
Concentration of radioactivity in N. clavata and A. karschi.
We collected N. clavata and surface soils from three different locations in Fukushima Prefecture and calculated the radioactivity concentration ratios, defined as (110mAg Bq/kg N. clavata)/(110mAg Bq/kg soil). A similar ratio was calculated for 137Cs. As shown in Table 1, the radioactivity concentration ratios were 27.8, 74.5, and 87.3 for 110mAg and 0.036, 0.078, and 0.071 for 137Cs at Oguni, Benten-yama, and Nimaibashi, respectively. These data were then used to calculate the radioactivity concentration ratios of 110mAg to 137Cs, defined as (110mAg Bq/kg spider/110mAg Bq/kg soil)/(137Cs Bq/kg spider/137Cs Bq/kg soil). The values were 774, 960, and 1234, at Oguni, Benten-yama, and Nimaibashi, respectively.
Table 1. Radioactivity concentration ratio between soil and
Nephila clavata or
Atypus karschi. To calculate the concentration ratio, the spider’s radioactivity, as shown in
Table 3b, was divided by the corresponding soil radioactivity data shown in
Table 6. The results obtained using the
134Cs and
137Cs data were almost the same (data not shown)
| Species |
Sampling place
(Sample no. in Table 3) |
Ratio of the radioactivity concentrations:
Spider (Bq/kg)/Soil (Bq/kg) |
110mAg : 137Cs ratio
(a)/(b) |
| 110mAg (a) |
137Cs (b) |
| Nephila clavata |
| |
Oguni (2) |
27.8 |
0.036 |
774 |
| |
Benten-yama (1) |
74.5 |
0.078 |
960 |
| |
Nimaibashi (3) |
87.3 |
0.071 |
1234 |
| Atypus karschi |
| |
Benten-yama (16) |
448 |
1.30 |
344 |
| |
Iitoi (14) |
166 |
0.45 |
369 |
We also measured the radioactivity concentration ratio in A. karschi living only on the soil surface as a ground spider, which would have received 110mAg directly from the soil-based food chain, while N. clavata resides in aerial webs mainly depending on flying preys. As shown in Table 1, the concentration ratios of 110mAg and 137Cs in A. karschi in samples collected at Benten-yama and Iitoi were 448 and 166, and 1.30 and 0.45, respectively, corresponding to 110mAg to 137Cs radioactivity concentration ratios of 344 and 369 (Table 1). Thus, in both spider species, the concentration ratio of radioactive 110mAg was two–three orders higher than that of 137Cs.
Distribution of radionuclides in the body, thread, excrement, and egg sac of N. clavata.
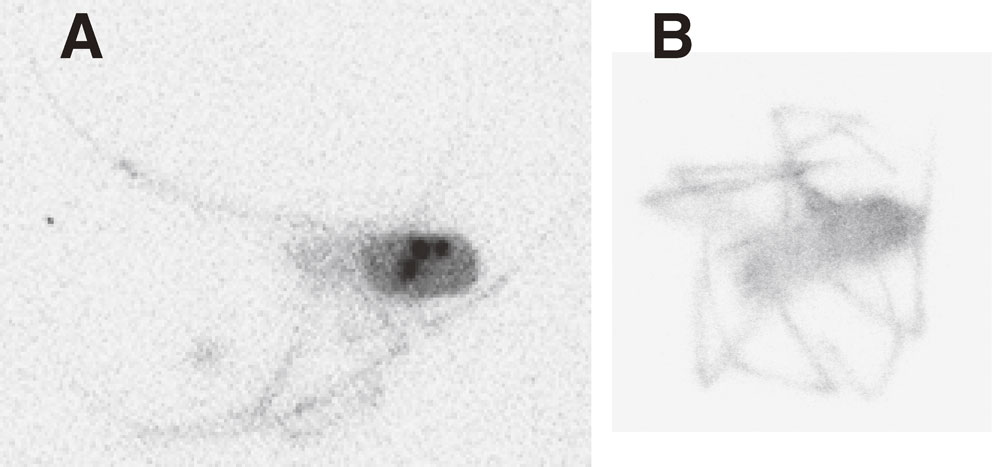
Figure 3 shows the lifestyle of the female N. clavata spiders in the U8-cups. All N. clavata collected from Hiso on Oct. 13, 2013 were pregnant. During starvation in the U8-cups incubated at room temperature, one N. clavata delivered one egg sac containing many larval spiders (Fig. 3a). The egg sac was covered with a silky thread and hung on the web strung across the cup interior (Fig. 3d). Table 2 shows that the spider’s body and excrement contained equivalent concentrations of 110mAg, whereas the concentration in the egg sacs was more than twofold higher. Web silk did not contain 110mAg. However, the concentration of 137Cs (and 134Cs) in the spiders’ body and thread was nearly the same. Cesium might be incorporated as a contaminant into thread, replacing potassium. Spider excrement contained 4.5 times more 137Cs (and 134Cs) than measured in the spider body. Concentrated radioactivity was observed possibly at the midgut gland of N. clavata, while with lower concentrations of radioactivity in other body parts (Fig. 4).
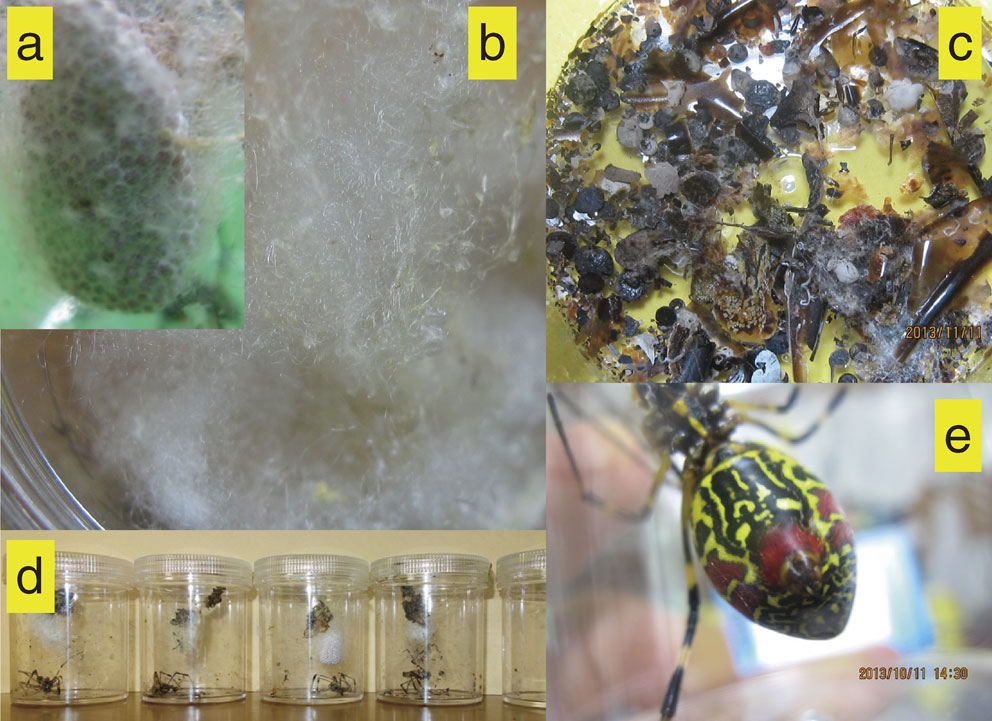
Table 2. Distribution of radionuclides derived from
Nephila clavata into four parts. It was sampled at Hiso on Oct. 13, 2013 (sample no. 9 in Table 3). See the culture conditions of
N. clavata in the U8-cup in the Materials and methods. Figures of each part are shown in
Fig. 3
| N. clavata |
Radioactivity (Bq/kg) |
| 110mAg |
134Cs |
137Cs |
| Whole body |
78.5 |
546 |
1339 |
| Excrement (feces + urine) |
70.1 |
2480 |
6040 |
| Thread |
n.d. |
756 |
1330 |
| Egg sacs |
150 |
155 |
395 |
n.d.: not detected.
Figure 5 shows the trend in the radionuclide contents of N. clavata over the sampling period. Although the dates and sites of N. clavata collection differed, the concentration of 110mAg in the spiders clearly decreased rapidly within 3.5 years after the NPP accident, except in sample no. 11, which still had a detectable amount of 110mAg and a very high amount of 137Cs (and 134Cs). This sample was collected at Tsushima, where aerial doses were higher (8.2 µSv/h) than those (1.3–4.6 µSv/h) at other sampling sites (Table 3a).
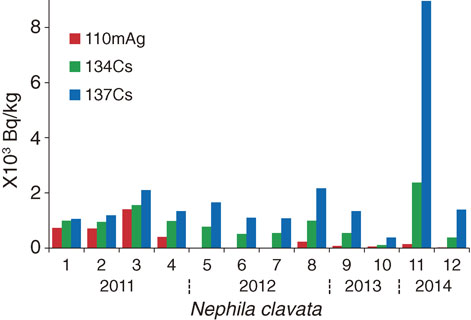
Table 3a. Radioactivity of faunal species collected from Sept. 20, 2011 to Nov. 3, 2014 at the sampling sites. Indicated number of animals in each sample was put together in a cup and measured
Sample
number |
Faunal species |
Number of
measured
samples |
Radioactivity
(Bq/kgDW) |
Date of
sampling |
Sampling
place |
Aerial
dose
(µSv/h) |
134Cs
/137Cs |
110mAg
/137Cs |
| 110mAg |
134Cs |
137Cs |
| 1 |
Nephila clavata (silk spider) |
5 |
731 |
989 |
1052 |
2011/9/20 |
Benten-yama |
3.5 |
0.94 |
0.70 |
| 2 |
Nephila clavata (silk spider) |
6 |
707 |
949 |
1180 |
2011/10/18 |
Oguni |
2.1 |
0.80 |
0.60 |
| 3 |
Nephila clavata (silk spider) |
6 |
1398 |
1559 |
2096 |
2011/11/9 |
Nimaibashi |
3.2 |
0.74 |
0.67 |
| 4 |
Nephila clavata (silk spider) |
10 |
400 |
980 |
1340 |
2011/11/9 |
Benten-yama |
4.3 |
0.73 |
0.30 |
| 5 |
Nephila clavata (silk spider) |
5 |
n.d. |
772 |
1653 |
2012/7/11 |
Hiso |
4.3 |
0.47 |
n.d. |
| 6 |
Nephila clavata (silk spider) |
4 |
n.d. |
512 |
1093 |
2012/7/11 |
Hiso |
4.6 |
0.47 |
n.d. |
| 7 |
Nephila clavata (silk spider) |
6 |
n.d. |
538 |
1077 |
2012/7/11 |
Hiso |
4.4 |
0.50 |
n.d. |
| 8 |
Nephila clavata (silk spider) |
3 |
226 |
993 |
2163 |
2012/7/11 |
Oguni |
1.3 |
0.46 |
0.10 |
| 9 |
Nephila clavata (silk spider) |
35 |
78.5 |
546 |
1339 |
2013/10/13 |
Hiso |
4.5 |
0.41 |
0.059 |
| 10 |
Nephila clavata (silk spider) |
14 |
48.4 |
107 |
385 |
2013/11/5 |
Hiso |
3.5 |
0.28 |
0.13 |
| 11 |
Nephila clavata (silk spider) |
4 |
139 |
2369 |
8965 |
2014/10/13 |
Tsushima |
8.2 |
0.26 |
0.016 |
| 12 |
Nephila clavata (silk spider) |
8 |
18.2 |
378 |
1395 |
2014/10/13 |
Hiso |
3.1 |
0.27 |
0.013 |
| 13 |
Araneus ventricosus (Onigumo) |
2 |
162 |
424 |
508 |
2011/11/9 |
Benten-yama |
2.3 |
0.83 |
0.32 |
| 14 |
Atypus karschi (ground spider) |
8 |
3211 |
6346 |
8016 |
2011/10/18 |
Iitoi |
5.4 |
0.79 |
0.40 |
| 15 |
Atypus karschi (ground spider) |
12 |
618 |
1912 |
3169 |
2012/5/5 |
Iitoi |
4.5 |
0.60 |
0.20 |
| 16 |
Atypus karschi (ground spider) |
10 |
2866 |
11464 |
17445 |
2012/5/1 |
Benten-yama |
4.5 |
0.66 |
0.16 |
| 17 |
Atypus karschi (ground spider) |
13 |
232 |
1383 |
2932 |
2013/6/5 |
Iitoi |
3.7 |
0.47 |
0.079 |
| 18 |
Atypus karschi (ground spider) |
4 |
n.d. |
360 |
1206 |
2014/10/13 |
Iitoi |
2.7 |
0.30 |
n.d. |
| 19 |
Atypus karschi (ground spider) |
4 |
86.8 |
513 |
1800 |
2014/11/2 |
Maeda |
3.1 |
0.29 |
0.048 |
| 20 |
Atypus karschi (ground spider) |
4 |
n.d. |
436 |
686 |
2014/11/2 |
Iitoi |
2.9 |
0.64 |
n.d. |
| 21 |
Argiope amoena (Koganegumo) |
10 |
140 |
174 |
436 |
2012/9/27 |
Miyuki-yama |
4.6 |
0.40 |
0.32 |
| 22 |
Spider (Unknown) |
1 |
182 |
1218 |
2506 |
2012/9/16 |
Hiso |
4.2 |
0.49 |
0.073 |
| 23 |
Doricus herensis (Seaka-gomimushi) |
6 |
491 |
1006 |
1271 |
2012/3/30 |
Benten-yama |
2.5 |
0.79 |
0.39 |
| 24 |
Armadillidium vulgare (pill bug) |
23 |
2099 |
8073 |
10759 |
2011/11/9 |
Iitoi |
2.7 |
0.75 |
0.20 |
| 25 |
Armadillidium vulgare (pill bug) |
25 |
3906 |
26734 |
34842 |
2011/11/9 |
Benten-yama |
3.0 |
0.77 |
0.11 |
| 26 |
Aphaenogaster famelica (ant) |
20 |
n.d. |
11360 |
14768 |
2011/11/9 |
Maeda |
4.2 |
0.77 |
n.d. |
| 27 |
Aphaenogaster famelica (ant) |
10 |
n.d. |
6233 |
7672 |
2011/11/10 |
Benten-yama |
2.8 |
0.81 |
n.d. |
| 28 |
Aphaenogaster famelica (ant) |
32 |
317 |
871 |
1271 |
2012/6/16 |
Ryozen |
2.1 |
0.69 |
0.25 |
| 29 |
Oligochaeta (earthworm) |
1 |
20.8 |
357 |
476 |
2011/11/9 |
Benten-yama |
3.8 |
0.75 |
0.044 |
| 30 |
Euhadra (snail: Maimai) |
43 |
3118 |
11466 |
14778 |
2012/7/12 |
Yamakiya |
5.1 |
0.78 |
0.21 |
| 31 |
Bufo japonicus formosus (frog: Hikigaeru) |
1 |
426 |
5709 |
12130 |
2012/6/15 |
Iitoi |
5.5 |
0.47 |
0.035 |
| 32 |
Rana rugosa (frog: Tsuchigaeru) |
5 |
206 |
17785 |
23544 |
2012/3/30 |
Iitoi |
4.5 |
0.76 |
0.0087 |
| 33 |
Frog (unknown) |
1 |
53 |
6519 |
18544 |
2013/6/5 |
Hiso |
3.5 |
0.35 |
0.0029 |
| 34 |
Frog (unknown) |
1 |
74.6 |
2584 |
7671 |
2013/11/10 |
Hiso |
3.7 |
0.34 |
0.010 |
| 35 |
Lacertidae (lizard) |
4 |
n.d. |
11500 |
14700 |
2011/10/18 |
Iitoi |
5.1 |
0.78 |
n.d. |
| 36 |
Lacertidae (lizard) |
3 |
n.d. |
3300 |
4900 |
2012/9/27 |
Iitoi |
4.5 |
0.67 |
n.d. |
| 37 |
Lacertidae (lizard) |
1 |
n.d. |
431 |
1338 |
2014/10/13 |
Iitoi |
2.7 |
0.32 |
n.d. |
| 38 |
Elaphe climacophora (snake)‡ |
1 |
18.2 |
274 |
504 |
2012/7/11 |
Oguni |
2.2 |
0.54 |
0.036 |
| 39 |
Patanga japonica (locust) |
8 |
25.7 |
816 |
829 |
2011/10/18 |
Nimaibashi |
3.5 |
0.98 |
0.031 |
| 40 |
Patanga japonica (locust) |
4 |
n.d. |
111 |
251 |
2013/4/30 |
Oguni |
2.3 |
0.44 |
n.d. |
| 41 |
Diestrammena apicalis (Kamadouma) |
4 |
65 |
1348 |
2563 |
2011/11/9 |
Benten-yama |
2.2 |
0.53 |
0.025 |
| 42 |
Thereuonema tuberculata (millipede: Geji) |
3 |
578 |
1724 |
2550 |
2011/11/9 |
Benten-yama |
2.0 |
0.68 |
0.227 |
| 43 |
Meghimatium bilineatum (slug)‡ |
5 |
165 |
2833 |
5095 |
2012/9/27 |
Oguni |
3.4 |
0.56 |
0.032 |
| 44 |
Meghimatium bilineatum (slug)‡ |
6 |
233 |
6856 |
13272 |
2012/7/11 |
Benten-yama |
3.3 |
0.52 |
0.018 |
| 45 |
Allomylina dichotoma (female)(beetle) |
1 |
n.d. |
845 |
1445 |
2012/7/12 |
Benten-yama |
1.4 |
0.58 |
n.d. |
| 46 |
Allomylina dichotoma (male)(beetle) |
1 |
n.d. |
580 |
1007 |
2012/7/12 |
Benten-yama |
1.3 |
0.58 |
n.d. |
| 47 |
Cerambycidae (longicorn: Kamikiri) |
1 |
n.d. |
70.1 |
105 |
2012/8/16 |
Benten-yama |
1.2 |
0.67 |
n.d. |
| 48 |
Graptopsaltria nigrofuscata (Aburazemi) |
10 |
n.d. |
699 |
1196 |
2012/8/17 |
Benten-yama |
1.5 |
0.58 |
n.d. |
| 49 |
Pentatoma japonica (Kamemushi) |
4 |
n.d. |
129 |
207 |
2012/6/15 |
Maeda |
4.0 |
0.62 |
n.d. |
| 50 |
Vespa mandarinia (hornet: Suzumebachi) |
4 |
273 |
8206 |
11320 |
2011/11/9 |
Iitoi |
4.5 |
0.72 |
0.024 |
| 51 |
Apis cerana japonica Rad (honeybee) |
7 |
n.d. |
354 |
805 |
2013/6/5 |
Sasu |
1.2 |
0.44 |
n.d. |
| 52 |
Rhopalocera (butterfly: Unknown) |
10 |
n.d. |
91 |
250 |
2013/6/5 |
Usuishi |
2.1 |
0.36 |
n.d. |
| 53 |
Rhopalocera (butterfly: Monshirocyo) |
5 |
n.d. |
2418 |
3300 |
2011/11/10 |
Sasu |
2.5 |
0.73 |
n.d. |
| 54 |
Anotogaster sieboldii (dragonfly) |
5 |
838 |
7980 |
18800 |
2012/8/17 |
Hiso |
4.5 |
0.42 |
0.045 |
| 55 |
Sympetrum croceolum (dragonfly) |
6 |
180 |
637 |
1490 |
2012/6/15 |
Sasu |
2.5 |
0.43 |
0.12 |
| 56 |
Sympetrum frequens (dragonfly) |
4 |
610 |
2755 |
3487 |
2011/9/20 |
Iitoi |
5.2 |
0.79 |
0.17 |
| 57 |
Palaemon paucidens (river shrimp) |
35 |
81.7 |
746 |
2387 |
2014/5/30 |
Nagadoro |
6.2 |
0.31 |
0.034 |
| 58 |
Geothelphusa dehaani (crab: Sawagani) |
3 |
162 |
172 |
230 |
2012/3/30 |
Hanami-yama |
1.8 |
0.75 |
0.70 |
| 59 |
Geothelphusa dehaani (crab: Sawagani) |
3 |
185 |
10800 |
30600 |
2014/5/30 |
Akougi |
8.0 |
0.35 |
0.0060 |
| 60 |
Geothelphusa dehaani (crab: Sawagani) |
5 |
664 |
5450 |
14100 |
2013/7/8 |
Hiso |
5.5 |
0.39 |
0.047 |
| 61 |
Bellamya quadrata histrica (Tanishi) |
12 |
10.2 |
246 |
483 |
2012/6/15 |
Benten-yama |
1.0 |
0.51 |
0.021 |
| 62 |
Cybister japonicus (Gengoro) |
8 |
46.7 |
142 |
257 |
2012/8/17 |
Benten-yama |
1.2 |
0.55 |
0.18 |
| 63 |
tadpole‡ |
86 |
n.d. |
63.4 |
147.1 |
2013/6/5 |
Iitoi |
3.0 |
0.43 |
n.d. |
| 64 |
Cynops pyrrhogaster (Akaharaimori) |
2 |
n.d. |
484 |
1760 |
2014/10/13 |
Sasu |
0.8 |
0.28 |
n.d. |
| 65 |
Epimorpha (centipede: Mukade) |
1 |
425 |
883 |
3289 |
2014/11/3 |
Akougi |
6.9 |
0.27 |
0.13 |
‡: measured without desiccation and expressed as Bq/kgFW. n.d.: not detected, not determined.
Table 3a shows the original 110mAg, 134Cs, and 137Cs data obtained at the faunal sampling times between Sept. 20, 2011 and Nov. 3, 2014, and Table 3b presents the decay-corrected data of Table 3a with reference to March 15, 2011, when the NPP discharged gaseous materials and the plume spread to the northwest. The γ-ray peak patterns of most of the faunal samples collected in 2011–2012 were similar to that of N. clavata (Fig. 2, Table 3a). As shown in the column “110mAg Bq/kg” of Table 3b, silk spiders (sample no. 11), ground spiders (14, 16), pill bugs (24, 25), snails (30), dragonflies (54), crabs (60) and centipede (65) contained more than 5000 Bq/kg, whereas silk spiders (1, 2, 3, 4), ground spiders (15, 17, 19), other spiders (21, 22), the beetle Seaka-gomimushi (23), ants (28), frogs (34), millipedes (42), slugs (44), dragonflies (56), and river shrimp (57) contained 1000–5000 110mAg Bq/kg. In contrast, 110mAg was not detectable in lizards, locusts, beetles, longicorn beetles, honeybees, butterflies, tadpoles, and newts, although 137Cs (or 134Cs) was detected in all of them. Table 3b also shows that ground spiders, pill bugs, ants, snails, frogs, lizards, slugs, hornets, crabs, and dragonflies contained more than 10,000 137Cs Bq/kg. The 110mAg/137Cs ratios of silk spiders, Argiope amoena, Seaka-gomimushi, millipedes, river shrimp, crabs, and the diving beetle Gengoro were above 1.0. Note that all of those species are members of Arthropoda.
Table 3b. Decay corrected data of
Table 3a. All data of
Table 3a was corrected following physical half-life of each nuclide to the date Mar. 15, 2011
Sample
number |
Faunal species |
Bq/kgDW |
110mAg/137Cs |
| 110mAg |
134Cs |
137Cs |
| 1 |
Nephila clavata (silk spider) |
*1640 |
1293 |
1072 |
†1.5 |
| 2 |
Nephila clavata (silk spider) |
*1559 |
1286 |
1201 |
†1.3 |
| 3 |
Nephila clavata (silk spider) |
*3754 |
2163 |
2144 |
†1.8 |
| 4 |
Nephila clavata (silk spider) |
*1074 |
1360 |
1370 |
0.78 |
| 5 |
Nephila clavata (silk spider) |
n.d. |
1524 |
1709 |
n.d. |
| 6 |
Nephila clavata (silk spider) |
n.d. |
1011 |
1130 |
n.d. |
| 7 |
Nephila clavata (silk spider) |
n.d. |
878 |
1129 |
n.d. |
| 8 |
Nephila clavata (silk spider) |
986 |
1618 |
2237 |
0.44 |
| 9 |
Nephila clavata (silk spider) |
n.d. |
878 |
1129 |
n.d. |
| 10 |
Nephila clavata (silk spider) |
495 |
259 |
409 |
†1.2 |
| 11 |
Nephila clavata (silk spider) |
**5167 |
7852 |
9734 |
0.53 |
| 12 |
Nephila clavata (silk spider) |
677 |
1253 |
1515 |
0.45 |
| 13 |
Araneus ventricosus (Onigumo) |
344 |
544 |
517 |
0.67 |
| 14 |
Atypus karschi (ground spider) |
**6811 |
8142 |
8154 |
0.84 |
| 15 |
Atypus karschi (ground spider) |
*1955 |
2800 |
3253 |
0.61 |
| 16 |
Atypus karschi (ground spider) |
**9852 |
17261 |
#17942 |
0.55 |
| 17 |
Atypus karschi (ground spider) |
*2089 |
2863 |
3082 |
0.68 |
| 18 |
Atypus karschi (ground spider) |
n.d. |
1193 |
1309 |
n.d. |
| 19 |
Atypus karschi (ground spider) |
*3832 |
1800 |
1960 |
2.0 |
| 20 |
Atypus karschi (ground spider) |
n.d. |
1630 |
784 |
n.d. |
| 21 |
Argiope amoena (Koganegumo) |
*1260 |
360 |
458 |
†2.8 |
| 22 |
Spider (Unknown) |
*1639 |
2523 |
2634 |
0.62 |
| 23 |
Doricus herensis (Seaka · gomimushi) |
*1469 |
1447 |
1303 |
†1.1 |
| 24 |
Armadillidium vulgare (pill bug) |
**5482 |
11097 |
#10997 |
0.50 |
| 25 |
Armadillidium vulgare (pill bug) |
**13998 |
40812 |
#35869 |
0.39 |
| 26 |
Aphaenogaster famelica (ant) |
n.d. |
14942 |
#15049 |
n.d. |
| 27 |
Aphaenogaster famelica (ant) |
n.d. |
9214 |
7831 |
n.d. |
| 28 |
Aphaenogaster famelica (ant) |
*1234 |
1366 |
1311 |
0.94 |
| 29 |
Oligochaeta (earthworm) |
46 |
464 |
485 |
0.095 |
| 30 |
Euhadra (snail: Maimai) |
**14504 |
19084 |
#15304 |
0.95 |
| 31 |
Bufo japonicas (frog: Hikigaeru) |
*5517 |
13341 |
#12858 |
0.43 |
| 32 |
Rana rugosa (frog: Tsuchigaeru) |
650 |
26026 |
#24957 |
0.026 |
| 33 |
Frog (unknown) |
778 |
15878 |
#19713 |
0.039 |
| 34 |
Frog (unknown) |
*1095 |
6294 |
8155 |
0.13 |
| 35 |
Lacertidae (lizard) |
n.d. |
13949 |
#14926 |
n.d. |
| 36 |
Lacertidae (lizard) |
n.d. |
5507 |
5320 |
n.d. |
| 37 |
Lacertidae (lizard) |
n.d. |
1429 |
1452 |
n.d. |
| 38 |
Elaphe climacophora (snake)‡ |
85.8 |
458 |
522 |
0.16 |
| 39 |
Patanga japonica (locust) |
57.6 |
1066 |
844 |
0.068 |
| 40 |
Patanga japonica (locust) |
n.d. |
236 |
264 |
n.d. |
| 41 |
Diestrammena apicalis (Kamadouma) |
382 |
2424 |
2668 |
0.14 |
| 42 |
Thereuonema tuberculata (millipede: Geji) |
*3329 |
3080 |
2654 |
†1.3 |
| 43 |
Meghimatium bilineatum (slug)‡ |
932 |
5029 |
5300 |
0.18 |
| 44 |
Meghimatium bilineatum (slug)‡ |
*1130 |
11570 |
#13758 |
0.082 |
| 45 |
Allomylina dichotoma (female beetle) |
n.d. |
1413 |
1497 |
n.d. |
| 46 |
Allomylina dichotoma (male beetle) |
n.d. |
970 |
1043 |
n.d. |
| 47 |
Cerambycidae (longicorn) |
n.d. |
117 |
109 |
n.d. |
| 48 |
Graptopsaltria nigrofuscata (Aburazemi) |
n.d. |
1503 |
1239 |
n.d. |
| 49 |
Pentatoma japonica (Kamemushi) |
n.d. |
236 |
216 |
n.d. |
| 50 |
Vespa mandarinia (hornet: Suzumebachi) |
649 |
10933 |
#11545 |
0.056 |
| 51 |
Apis cerana japonica Rad (honeybee) |
n.d. |
789 |
851 |
n.d. |
| 52 |
Rhopalocera (butterfly: Unknown) |
n.d. |
206 |
264 |
n.d. |
| 53 |
Rhopalocera (butterfly: Monshirocyo) |
n.d. |
4324 |
3434 |
n.d. |
| 54 |
Anotogaster sieboldii (dragonfly) |
**8177 |
16979 |
#19774 |
0.41 |
| 55 |
Sympetrum croceolum (dragonfly) |
849 |
1065 |
1543 |
0.55 |
| 56 |
Sympetrum frequens (dragonfly) |
*3465 |
4899 |
3628 |
0.96 |
| 57 |
Palaemon paucidens (river shrimp) |
*2688 |
2375 |
2585 |
†1.0 |
| 58 |
Geothelphusa dehaani (crab: Sawagani) |
970 |
311 |
240 |
†4.0 |
| 59 |
Geothelphusa dehaani (crab: Sawagani) |
4625 |
31384 |
32926 |
0.14 |
| 60 |
Geothelphusa dehaani (crab: Sawagani) |
**11039 |
13825 |
#15084 |
0.73 |
| 61 |
Bellamya quadrata histrica (Tanishi) |
58.8 |
439 |
503 |
0.12 |
| 62 |
Cybister japonicus (Gengoro) |
274 |
255 |
268 |
†1.0 |
| 63 |
tadpole‡ |
n.d. |
135 |
155 |
n.d. |
| 64 |
Cynops pyrrhogaster (newt: Akaharaimori) |
n.d. |
484 |
1760 |
n.d. |
| 65 |
Epimorpha (centipede: Mukade) |
**18782 |
3099 |
3595 |
†5.2 |
*: 1000–5000 110mAg Bq/kg. **: >5000 110mAg Bq/kg. #: >10000 137Cs Bq/kg. †: >1.0 of 110mAg/137Cs. ‡: expressed as Bq/kgFW. n.d.: not detected, not determined.
The feces of some of the fauna were collected and the radioactivity content was measured. As shown in Table 4, earthworms, lizards, Seaka-gomimushi, and dragonflies (Akiakane) concentrated 110mAg in their feces, based on feces/soil radioactivity ratios of 15, 746, 45, and 101, respectively. The feces of earthworms, ground spiders, and lizards also contained 137Cs (feces/soil ratios of 18, 19, and 4.3, respectively). The 110mAg/137Cs ratios in the feces of lizards and dragonflies were 0.23 and 0.46, respectively, which were two orders of magnitude higher than in any of the contaminated soils examined (see 110mAg/137Cs in Table 6). Thus, lizards and dragonflies concentrated large amounts of 110mAg, which they ingested via the soil-based food chain.
Table 4.
110mAg/
137Cs radioactivity ratio in the feces of some of the studied faunal species and the radioactivity concentration ratio for their feces vs. soil. All data are calculated after decay correction to the date Mar. 15, 2011
Feces secreted
from fauna |
Radioactivity (Bq/kg) |
110mAg/137Cs |
Sampling date |
Radioactivity ratio feces/soil |
| 110mAg |
134Cs |
137Cs |
110mAg |
134Cs |
137Cs |
| earthworm (1) |
536 |
163000 |
267000 |
0.0020 |
2013/2/22 |
15 |
9.0 |
13 |
| earthworm (2) |
n.d. |
569000 |
593000 |
n.d. |
2011/10/18 |
n.d. |
15 |
18 |
| Atypus karschi |
n.d. |
271000 |
337000 |
n.d. |
2011/10/18 |
n.d. |
17 |
19 |
| lizard |
17700 |
58300 |
77100 |
0.23 |
2011/10/18 |
746 |
4.0 |
4.3 |
| Seaka gomimushi |
1460 |
20900 |
23500 |
0.062 |
2011/11/30 |
45 |
0.79 |
1.3 |
| dragonfly |
2510 |
4230 |
5420 |
0.46 |
2011/11/9 |
101 |
0.27 |
0.30 |
| locust |
n.d. |
4480 |
4840 |
n.d. |
2011/11/9 |
n.d. |
0.17 |
0.17 |
n.d.: not detected, not determined. Earthworm (2), Atypus karschi and lizard correspond to no. 29, no. 14 and no. 35 in Table 3, respectively. Other specimens are different from those listed in Table 3.
A. karschi was collected as the representative spider to monitor radionuclide accumulation in spider bodies in the area of Iitoi, Iitate village, from Oct. 18, 2011 to Oct. 13, 2014. As an inhabitant of the surface soil, A. karschi was assumed to more directly reflect soil radionuclides available through the food chain than N. clavata, which mostly resides in aerial webs. The fixed sampling site, where the aerial rate of radioactivity accumulation was 5.37 µSv/h on the first sampling date, Oct. 18, 2011, but had decreased to 2.75 µSv/h on the fourth sampling date, Oct. 13, 2014. As shown in Table 5, during the 6 months from Oct. 18, 2011 to May 5, 2012, the radioactivity of 110mAg, 134Cs, and 137Cs decayed from 3211 to 618 Bq/kg, 6346 to 1912 Bq/kg, and 8016 to 3169 Bq/kg, respectively. If each radionuclide found in A. karschi on Oct. 18, 2011 had decayed following its physical half-life, then the values on May 5, 2012 should have been 1859, 5294, and 7916 Bq/kg, respectively. However, the detected radioactivity was far less. Moreover, on Oct. 13, 2014, 110mAg was no longer detected in A. karschi, although 137Cs and 134Cs were still present in large amounts.
Table 5. Concentration of radionuclides in
Atypus karschi during the 3.5 years after the NPP disaster. Sampling was carried out on Oct. 18, 2011, May 5, 2012, June 5, 2013, and Oct. 13, 2014 that correspond to the sample nos. 14, 15, 17 and 18 in
Table 3a, respectively, at the fixed observation site in Iitoi. Parentheses indicate the calculated data based on the assumption that the radioactivity in the samples collected on the first sampling date (Oct. 18, 2011) decayed following the physical half-life of each radionuclide
| Date of sampling |
Radionuclides (Bq/kg) |
| 110mAg |
134Cs |
137Cs |
| 2011/10/18 |
3211 |
6346 |
8016 |
| 2012/5/5 |
618 (1859) |
1912 (5294) |
3169 (7916) |
| 2013/6/5 |
232 (742) |
1383 (3909) |
2932 (7754) |
| 2014/10/13 |
0 (144) |
360 (2184) |
1206 (7469) |
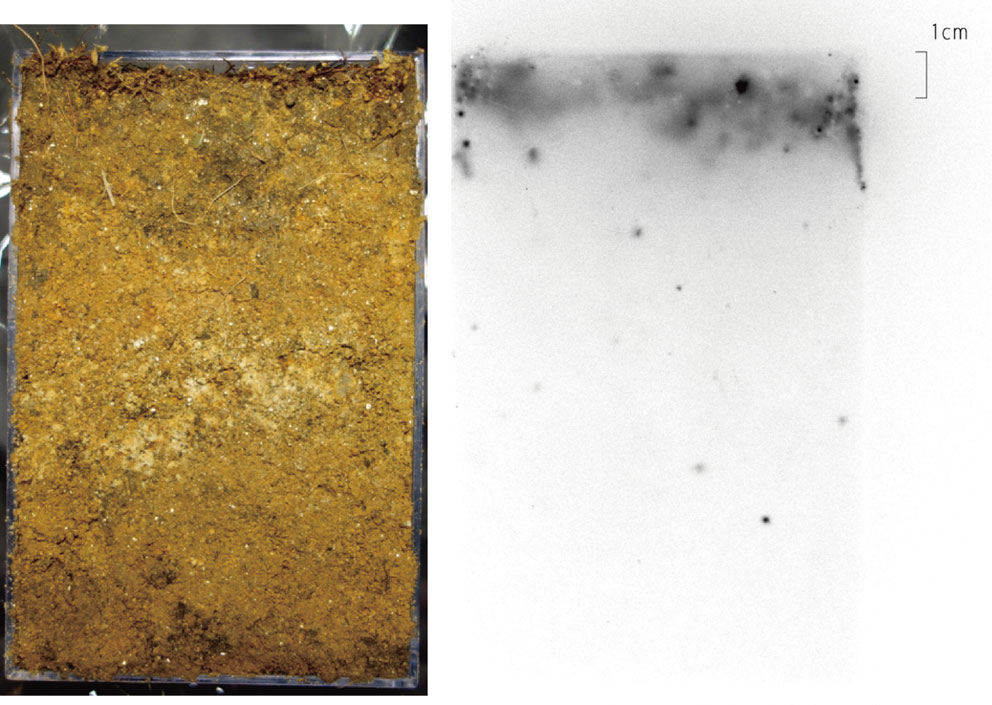
In contrast, the γ-ray traces of all surveyed soils showed very low peaks for 110mAg. 110mAg was detected in soils at concentrations between 22 and 238 Bq/kg (Table 6). For example, the radioactivity ratio of 110mAg/134Cs/137Cs in Nimaibashi soil collected on the same day as N. clavata was 1/675/703, which was very different from that of N. clavata (1/1.12/1.50. See Results). The radioactivity ratio of 110mAg/137Cs was between 0.0014 and 0.0023. These values were almost the same as those of the riverbed sediments of the four sampling locations of Nitta River (0.0016–0.0036), Takanokura Dam (0.008) of the Nitta River, and Tetsuzen Dam (0.01) of Ota River.16) These sampling places are located in Minamisoma city, Fukushima Prefecture and to the northwest from Fukushima Dai-ichi NPP. The almost constant 110mAg/137Cs ratios in those soils suggested that our research area (100 km × 60 km) was contaminated with 110mAg and 137Cs (and 134Cs) all at once shortly after the release of huge amount of radioactivity on March 15, 2011, with contamination occurring by precipitation. Figure 6 shows the autoradiograph of the forest soil profile at Tsushima. Radioactivity is distributed within 2 cm of the top soil, which includes a litter layer of ∼1 cm at the surface.
Table 6. Concentration of soil radioactivity and the
110mAg/
137Cs ratio. All data was corrected following physical half-life of each nuclide to the date Mar. 15, 2011
| |
Soils |
Radioactivity (Bq/kg) in soils |
110mAg/137Cs |
| 110mAg |
134Cs |
137Cs |
| 1 |
Oguni |
56 |
32000 |
33400 |
0.0017 |
| 2 |
Hanami-yama |
42 |
25600 |
26500 |
0.0016 |
| 3 |
Benten-yama |
22 |
12900 |
13800 |
0.0016 |
| 4 |
Tsushima |
238 |
105900 |
108000 |
0.0022 |
| 5 |
Iitoi |
41 |
17200 |
18100 |
0.0023 |
| 6 |
Nimaibashi |
43 |
29100 |
30300 |
0.0014 |
| 7 |
Hiso |
37 |
18200 |
21300 |
0.0017 |
Discussion
During our field research on the contamination of flora in Ibaraki,25) and Fukushima,26) we coincidentally detected large amounts of 110mAg in the spider N. clavata (Fig. 2). This finding was subsequently confirmed in other faunal species. Among the many species surveyed (Table 3a), those belonging to Arthropoda contained more 110mAg and had a higher radioactivity ratio (110mAg/137Cs > 1) than faunal species from other phyla, when decay was corrected to the date of release of these radioactivity, March 15, 2011 (Table 3b). In contrast, 110mAg concentrations in soils were very low, along with the 110mAg/137Cs ratio in soils (0.0014–0.0023) (Table 6) compared to the concentrations of these two radionuclides in all faunal species in which 110mAg were detected (Table 3b).
In both spider species (N. clavata and A. karschi), the radioactivity concentration ratio of 110mAg was three orders of magnitude higher than that of 137Cs (Table 1). The most plausible explanation for this unexpected result is that 137Cs was more rapidly bound to soil clay minerals, especially mica15) or illite,27) than 110mAg, resulting in less 137Cs available to flora and/or fauna in the soil. Indeed, the 137Cs content of most of the vegetables and rice in Fukushima Prefecture has decreased very quickly in the 3 years since the NPP accident.28) Alternatively, the Ag-transporter activity of both spiders may be much higher than their Cs-transporter activity, resulting in the more efficient uptake of 110mAg. Otherwise, as mentioned later the binding activity of 110mAg to hemocyanin in lymph fluid in both spiders may be very strong, thus 110mAg may be more slowly metabolized than radioactive Cs to be excreted. Another explanation is that 110mAg is more quickly turned over through the food chain to spiders in terrestrial environments than 137Cs. To confirm the latter three possibilities will require advanced biochemical and molecular biological works on mineral (Ag and/or Cs) transporters in flora and fauna.
Although we could not segregate the radioactivity sources in the labeling image of N. clavata and thus unable to localize 110mAg and 137Cs (or 134Cs) anatomically, the image shown in Fig. 4 suggests that 110mAg is circulated in the lymph fluid, thus binding to hemocyanin, the O2 carrier protein that also plays an important role in metal transport and distribution in decapod crustaceans.29) The trunk, head, and legs of N. clavata, as depicted in Fig. 4B, were probably labeled mainly with radioactive Cs. Autoradiographs (BAS-images) of many small animals collected from the contaminated field were taken by one of the authors (S. Mori) and published online.30),31) The muscles of frog and snake are very strongly labeled with radioactive Cs.32) These observations are consistent with the very low 110mAg/137Cs ratio of those fauna (see the 110mAg/137Cs ratio of snake no. 38 and frog nos. 32–34 in Table 3a).
The fact that the concentration of 110mAg in the egg sac of N. clavata (Fig. 3a) was more than twice that of the spider’s body (Table 2) suggests that 110mAg was transferred from the female spider to the egg sac. Because one egg sac incubates hundreds of larval spiders, separating them from the fragile sac after it was crushed was difficult (Fig. 3a). Thus, the portion of 110mAg transferred from female spiders to its larvae could not be determined.
In Arthropoda and Mollusca that inhabit the sea, such as crab, octopus, and squid, etc., 110mAg was suggested to replace copper in the active center of hemocyanin. It is reported that the regeneration of holohemocyanin by the combination of apoprotein with added cuprous chloride was inhibited by Ag+,33) although this has yet to be proven more directly using 110mAg. The same may be true in the case of land fauna species living in freshwater, such as river shrimp, crab, and diving beetle Gengoro, whose 110mAg contents and 110mAg/137Cs ratios were relatively high (Table 3). The amount of 110mAg concentrated by phytoplankton or zooplankton may be a determining factor, as both would serve as the primary source of 110mAg in the food chain of freshwater ecosystems. It was interesting that snail (sample no. 30 in Table 3) belonging to Mollusca had also relatively high 110mAg content and 110mAg/137Cs ratio.
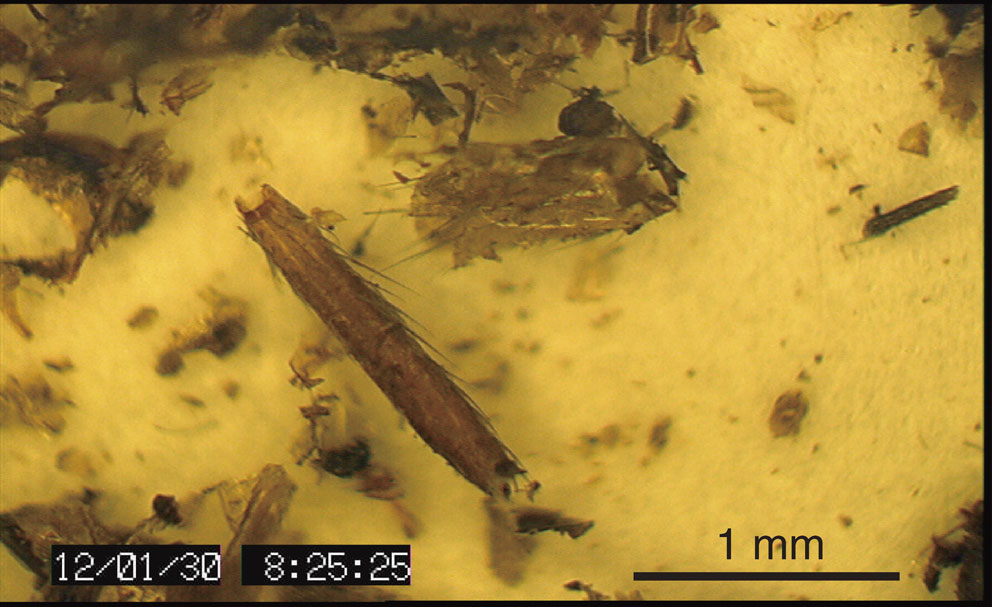
110mAg was not detectable in lizards, locusts, beetles, longicorn beetles, honeybees, butterflies, tadpoles, and newts, which may have been due to very low Ag-transporter activity in the digestive organs of these species. The lizards were collected at the same fixed point where we also collected the ground spider A. karschi annually. As shown in Fig. 7, a major component of lizard feces comprised fragmented A. karschi. This spider highly concentrated 110mAg in its body (sample nos. 14–20 in Table 3a), whereas the lizard did not (sample nos. 35–37 in Table 3a). This high amount of 110mAg in the feces of lizards suggests that the lizards excreted highly concentrated 110mAg without absorption of the radionuclide from the digested A. karschi. Thus, lizards may have very low intestinal Ag-transporter activity. A. karschi, however, almost completely absorbed 110mAg into its body from unknown foods because no detectable 110mAg was found in the feces of this spider (Table 4).
The radioactivity image of the soil profile (Fig. 6) agrees with the results of Lepage et al.16) (see Figs. 5, 7 and 8 in their recent report). Although we could not differentiate 110mAg from 137Cs and 134Cs in the image, the three radionuclides seemed to have co-localized in the topsoil within a depth of 2 cm. Silver tends to concentrate in the surface litter plus humus horizon, suggesting that it mixes with organic matter. Increased acidity facilitates the removal of Ag from this horizon, whereas at a pH above 4, Ag is relatively immobile.34) If we define “the residence half time for 110mAg in soil” as the time required for one-half of an acute 110mAg deposit to pass through the soil layer of interest, the residence half time resulting from the migration velocity of Ag+ within the 5-cm soil top layer would be 33 ± 3 years.12) Therefore, the vertical migration of 110mAg may be highly dependent on the soil type.
This study shows that faunal concentrations of 110mAg released during the Fukushima Dai-ichi NPP accident are decreasing more rapidly than the physical half-life of the radionuclide in the contaminated terrestrial environment of Fukushima (Fig. 5, Table 5). Due to the Chernobyl and Fukushima disasters, the precise physicochemical dynamics of radioactive Cs with soil minerals have received considerable attention from soil scientists around the world.15),27) However, studies on the biological dynamics of radioactive Cs in the “soil sphere” are lacking. Clarification of not only the physicochemical dynamics of soil minerals, but also the biological dynamics of 110mAg in the “soil sphere”, will likely provide the information needed to explain why faunal concentrations of 110mAg released by the Fukushima Dai-ichi NPP meltdown are decreasing faster through the food chain than predicted by their physical half-life.
Acknowledgments
We thank Prof. Naoko K. Nishizawa (Ishikawa Prefectural University) for critical reading of this manuscript, and Prof. Tomoko Nakanishi (The University of Tokyo) for supplying the facilities for radioisotope studies by S.M., and Mr. Masamichi Kagaya for assisting the sampling of faunal species and soils at Namie town. We are deeply indebted to the Aichi Steel Corporation for financial funding of this study.
References
- 1) Tanaka, S. (2012) Accident at the Fukushima Dai-ichi Nuclear power station of TEPCO. — Outline & lessons learned —. Proc. Jpn. Acad., Ser. B 88, 471–484.
- 2) MEXT (2011) Extension Site of the Distribution Map for Radiation Dose at http://ramap.jmc.or.jp/map/eng/, last accessed, Jan. 30, 2015.
- 3) Mori, S. (2011) http://moribin.blog114.fc2.com/blog-entry-1306.html, last accessed, Jan. 30, 2015 (in Japanese).
- 4) Seymour, A.H. (1963) Radioactivity of marine organisms from Guam, Palau and the Gulf of Siam, 1958–1959. In Radioecology (eds. Schultz, V. and Klement, A.W., Jr.). Reinhold, New York, pp. 151–157.
- 5) Folsom, T.R., Grismore, R. and Young, D.R. (1970) Long-lived γ-ray emitting nuclide silver-108m found in Pacific marine organisms and used for dating. Nature 227, 941–943.
- 6) Beresford, N.A. (1989) The transfer of Ag-110m to sheep tissues. Sci. Total Environ. 85, 81–90.
- 7) Boccolini, A., Gentilli, A., Guidi, P., Sabbatini, V. and Toso, A. (1988) Observations of silver-110m in the marine mollusc Pinna noblis. J. Environ. Radioact. 6, 191–193.
- 8) Boisson, F., Hutchinis, D.A., Fowler, S.W., Fisher, N.S. and Teyssie, J.-L. (1997) Influence of temperature on the accumulation and retention of 11 radio nuclides by the marine alga Fucus vesiculosus (L.). Mar. Pollut. Bull. 35, 313–321.
- 9) Zalewska, T. and Saniewski, M. (2011) Bioaccumulation of gamma emitting radionuclide in red algae from the Baltic Sea under laboratory conditions. Oceanologia 53, 631–650.
- 10) Jones, G.D., Forsyth, P.D. and Appleby, P.G. (1986) Observation of Ag-110m in Chernobyl fallout. Nature 322, 313.
- 11) Martin, C.J., Heaton, B. and Thompson, J. (1989) Cesium-137, 134Cs and 110mAg in lambs grazing pasture in NE Scotland contaminated by Chernobyl fallout. Health Phys. 56, 459–464.
- 12) Handl, J., Kallweit, E., Henning, M. and Szwec, L. (2000) On the long-term behaviour of 110mAg in the soil-plant system and its transfer from feed to pig. J. Environ. Radioact. 48, 159–170.
- 13) Fukuda, T., Kino, Y., Abe, Y., Yamashiro, H., Kuwahara, Y., Nihei, H., Sano, Y., Irisawa, A., Shimura, T., Fukumoto, M., Shinoda, H., Obata, Y., Saigusa, S., Sekine, T., Isogai, E. and Fukumoto, M. (2013) Distribution of artificial radionuclides in abandoned cattle in the evacuation zone of the Fukushima Daiichi Nuclear Power Plant. PLoS ONE 8, e54312.
- 14) Ito, N. (2012) Conquest of the effects on agricultural products by the disaster of Fukushima No. 1 Nuclear Power Plant (NPP) — Studies on the active use of the contaminated livestock within 20 km area from NPP. Journal of the Japan Veterinary Medical Association 65, 645–652 (in Japanese).
- 15) Ogasawara, S., Nakao, A. and Yanai, J. (2013) Radiocesium interception potential (RIP) of smectic and kaolin reference minerals containing illite (micaceous mineral) as impurity. Soil Sci. Plant Nutr. 59, 852–857.
- 16) Lepage, H., Evrard, O., Onda, Y., Patin, J., Chartin, C., Lefèvre, I., Bonté, P. and Ayrault, S. (2014) Environmental mobility of 110mAg: lessons learnt from Fukushima accident (Japan) and potential use for tracking the dispersion of contamination within coastal catchments. J. Environ. Radioact. 130, 44–55.
- 17) KEK (2011) http://legacy.kek.jp/quake/radmonitor/GeMonitor6.html, last accessed, Jan. 30, 2015 (in Japanese).
- 18) RIKEN (2011) http://www.radiochem.org/kinkyu/49.pdf, last accessed, Jan. 30, 2015.
- 19) UNSCEAR (2011) http://www.unscear.org/docs/reports/2013/UNSCEAR_2013A_B-1_CTBTO_particulates_air_2014-07.xlsx, last accessed, Jan. 30, 2015.
- 20) Povinec, P.P. (2013) Fukushima Dai-ichi Nuclear Power Plant. In Fukushima Accident: Radioactivity Impact on the Environment (eds. Povinec, P.P., Hirose, K. and Aoyama, M.). Elsevier, Amsterdam, pp. 31–54.
- 21) MEXT (2011) Preparation of Distribution Map of Radiation Doses, etc. (Maps of Concentration of Tellurium 129m and Silver 110m in Soil) by MEXT at http://radioactivity.nsr.go.jp/en/contents/5000/4168/24/1750_1031e_2.pdf, last accessed, Jan. 30, 2015.
- 22) Watanabe, T., Tsuchiya, N., Oura, Y., Inoue, C., Hirano, N., Yamada, R., Yamasaki, S., Okamoto, A., Nara, F.W. and Nunohara, K. (2012) Distribution of artificial radionuclides (110mAg, 129Te, 134Cs, 137Cs) in surface soils from Miyagi Prefecture, northeast Japan, following the 2011 Fukushima Dai-ichi nuclear power plant accident. Geochem. J. 46, 279–285.
- 23) Tazoe, H., Hosoda, M., Sorimachi, A., Nakata, A., Yoshida, M.A., Tokonami, S. and Yamada, M. (2012) Radioactive pollution from Fukushima Daiichi Nuclear Power Plant in the terrestrial environment. Radiat. Prot. Dosimetry 152, 198–203.
- 24) Petit, G.L., Douysset, G., Ducros, G., Gross, P., Achim, P., Monport, M., Raymond, P., Pontillon, Y., Jutier, C., Blanchard, X., Taffary, T. and Moulin, C. (2014) Analysis of radionuclide releases from the Fukushima Dai-Ichi Nuclear Power Plant Accident. Part I. Pure Appl. Geophys. 171, 629–644.
- 25) Mori, S., Hirato, A., Tanoi, K., Takeda, K., Yamakawa, T. and Nakanishi, H. (2012) Radioactive cesium flow in Rhus vernicifera. Soil Sci. Plant Nutr. 58, 611–617.
- 26) Nakanishi, H., Tanaka, H., Takeda, K., Tanoi, K., Hirose, A., Nagasaka, S., Yamakawa, T. and Mori, S. (2014) Radioactive cesium distribution in bamboo (Phyllostachy reticulate (Rupr) K. Koch) shoots after the TEPCO Fukushima Daiichi Nuclear Power Plant disaster. Soil Sci. Plant Nutr. 60, 801–808.
- 27) Vandebroek, L., Hees, M.V., Delvaux, B., Spaargaren, O. and Thiry, Y. (2012) Relevance of radio cesium interception potential (RIP) on a worldwide scale to assess soil vulnerability to 137Cs contamination. J. Environ. Radioact. 104, 87–93.
- 28) Monitoring information by Fukushima Prefecture available at http://www.new-fukushima.jp/monitoring/en/, last accessed, Jan. 30, 2015.
- 29) Rtal, A., Nonnotte, L. and Truchot, J.P. (1996) Detoxification of exogenous copper by binding to hemolymph proteins in the shore crab, Carcinus maenas. Aquat. Toxicol. 36, 239–252.
- 30) Mori, S. (2013) http://moribin.blog114.fc2.com/blog-entry-1631.html, last accessed, Jan. 30, 2015 (in Japanese).
- 31) Mori, S. (2014) http://moribin.blog114.fc2.com/blog-entry-1907.html, last accessed, Jan. 30, 2015 (in Japanese).
- 32) Mori, S. (2014) Reconstruction of the destroyed agriculture with evolution of agricultural sciences. Trends in the Science 19 (7), 56–59 (in Japanese).
- 33) Moore, C.H., Henderson, R.W. and Nichol, L.W. (1968) An examination of the polymerization behavior of Jasus lalandii haemocyanin and its relation to the allosteric binding of oxygen. Biochemistry 7, 4075–4085.
- 34) Boyle, R.W. (1968) The geochemistry of silver and its deposits. Geological Survey of Canada Bulletin 160, Geological Survey of Canada, Ottawa.