Abstract
Substantial progress in research on the recession of coastal cliffs composed of soft materials has been made in recent years and data with higher accuracy have been accumulated. This paper provides the state of the art review in the recession studies and highlights two new findings obtained from the reanalysis of existing data. The review topics are: episodic and localized nature of cliff recession; the development of cliffline; the relationship between cliff height and recession rate; mechanisms of cliff toe erosion by waves; a fundamental equation for wave-induced toe erosion; factors controlling toe erosion; and slope instabilities and mass movements. The findings are presented on (1) the temporal change in cliffline recession mode and (2) the effect of beach sediment at the cliff base on the cliff erosion.
1. Introduction
Rocky coast landforms, usually characterized by steep sea cliffs, are categorized into two: shore platforms and plunging cliffs (Fig. 1). Shore platforms are subdivided into two types:1) sloping (Type A) and horizontal (Type B). Type-A platforms have a gently descending erosion surface extending from the base of a sea cliff to beneath sea level without a noticeable topographic break. Type-B platforms on the other hand have a horizontal or sub-horizontal erosion surface in front of a sea cliff and the erosion surface terminates seawards in a marked scarp. In locations without these platforms, plunging cliffs occur which are precipitous slopes that plunge far below sea level as a vertical or semi-vertical face.
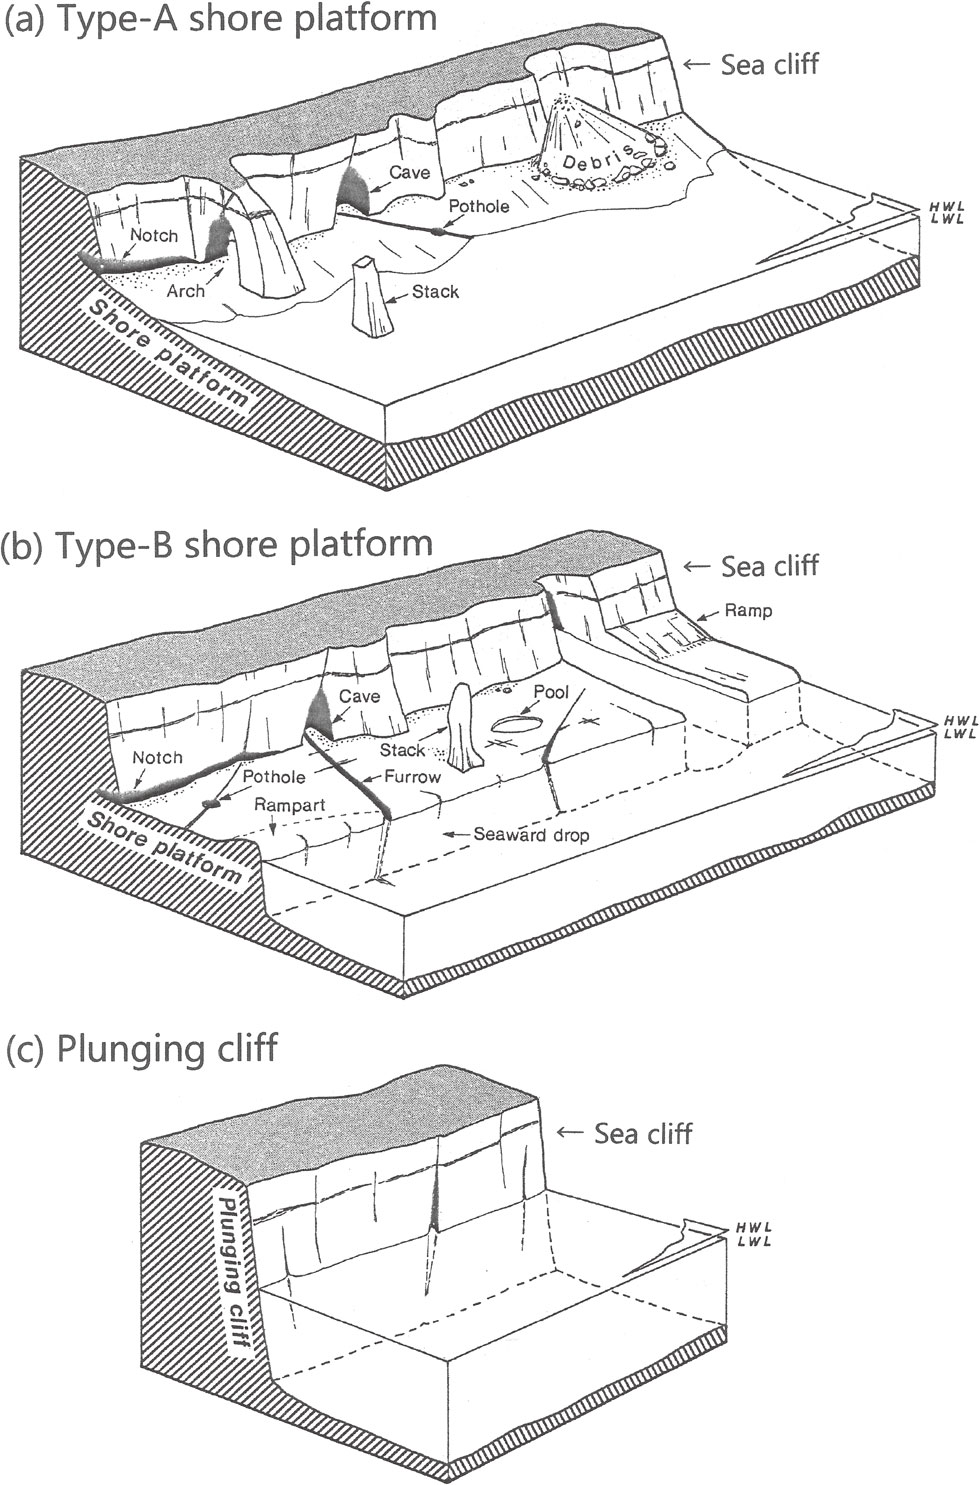
Cutting back of a sea cliff by wave action is responsible for the growth of the two types of shore platforms, whereas no appreciable recession occur on plunging cliffs.2) The cliff recession is essential for the rocky coast evolution. The recession of cliffs composed of soft rocks (uniaxial compressive strength: ≲5 MPa) accompanies the development of Type-A platforms. Shore platforms of this type will be hereafter referred to as ‘shore platforms’ or simply as ‘platforms’, unless otherwise stated. The recession rate of soft rock cliffs is on the order of 10−2 to 100 m/y,3) one or two orders of magnitude greater than that of cliffs at Type-B platforms. Such rapid cliff recession has attracted considerable attention not only from coastal geomorphologists, geologists and geographers but also from civil engineers, planners and environmental scientists working on rocky coasts.
The multiple factors that control the recession of soft rock cliffs and the relationships between the factors are diagrammed in Fig. 2. The water level greatly controls the elevation of wave attack. When waves erode the toe of a cliff, the overall cliff angle and stress increase to augment cliff instability. At the culmination mass movement occurs, which results in cliff recession and major morphological change. The debris supplied from mass movement usually forms talus at the cliff base, the landward margin of shore platforms. The talus deposit protects the cliff toe from erosion until it is transported alongshore and/or offshore by the action of waves and currents; the talus deposit also constitutes a part of the beach sediment that otherwise has been derived from nearby rivers, eroding beaches and/or cliffs. Beach sediment at the cliff toe works as abrasive tools to accelerate cliff erosion or as a protective cover to halt it. Morphologies immediately in front of the cliff and nearshore bottom topography control the sizes of waves that reach the toe of the cliff. When the talus deposit is removed, the cliff base is again exposed to waves to suffer erosion, which results in cliff instability and finally leads to mass movement: cliff recession resumes.

A thorough understanding of contemporary cliff recession processes under a stationary sea-level condition is considered to be crucial before we consider the rocky coast evolution under the influence of a possible global sea-level rise in the near future. For this purpose the present article will provide a state of the art review on studies of present-day recession processes on soft-rock cliffed coasts and highlight some new findings obtained here from the reanalysis of data previously published.
2. Episodic and localized nature of soft-rock cliff recession
Cliff recession distances have been documented using a variety of techniques,2) of which the most common is to measure receding distances of a cliff top (or edge) on sequential aerial photographs and historic maps. Recently airborne and terrestrial LiDAR (Light Detection And Ranging) techniques have been applied to measure cliff-face changes.4)–8) Average recession rates are determined by dividing the measured distances by the length of the time interval.
On the north shore of Long Island, New York, a hurricane on September 14, 1944 cut back a bluff composed of glacial deposits by a horizontal distance of over 12 m in a single day.9) This retreat provides a striking contrast to the 80-year average which is 0.5 m/y for this coast.10) Similar examples can be found for locations along the California coast.11) During storms in January 1983, waves removed about 14 m of the bluff top in one section of Miocene mudstone-siltstone cliffs at Santa Cruz, which had receded at an average rate of 0.2 m/y from 1931 to 1982. Near Capitola, 10 km east of Santa Cruz, a sea cliff having the same geology was cut back 1.5 to 3 m over night by a storm, while the long-term average recession rate including this site is only 0.3 m/y. These studies demonstrate that a very short-term erosion magnitude makes the long-term average rate unreliable.
The Holderness coastline, located in the northeast of England, is 60 km long and composed of glacial clays (till). This is known as one of the most rapidly receding cliffed coasts in Europe.12) At Easington, situated at the southern end of this coastal stretch, Richards and Lorriman13) have examined spatial and temporal variations in cliff recession rate, during the period of 16 years from 1966 to 1982 at 90 sites with an interval of 3.3 m along a 300-m long cliffline. The alongshore variation in recession rate for four sub-periods (3–5 years) is respectively presented in four diagrams, which show that recession rates in each sub-period are highly variable because some specific sites having receded extremely rapidly in one sub-period were cut back very slowly in the others. A diagram illustrating the spatial variation in the rates averaged over the 16 years shows that the variability is much smaller than that seen in the sub-periods,13) suggesting a tendency toward parallel retreat of the cliffline with increasing time span.
A cliff recession study on wider spatial and longer temporal scales has been performed by Brooks and Spencer14) on the Suffolk coast, England, where soft cliffs composed mainly of weakly consolidated Plio-Pleistocene marine sediment are exposed. Recession measurements were carried out, on transects with a 10-m interval, in five subsections along an 11-km long, north-south oriented coastline from Covehithe to Dunwich. Recession rates for a long term (1883–2008) and those for six intermediate time spans ranging from 11 to 40 years were presented in terms of box-whisker plots for each of the five subsections. The results indicated that (1) the average long-term erosion rate at Covehithe, 3.5 m/y, gradually decreased towards the south and it dropped to approximately 1.0 m/y at Dunwich, and (2) there were considerable temporal and/or spatial variations in erosion rates in each subsection for the intermediate time spans.14)
Another example of research with similar spatio-temporal scales can be taken from the East Sussex coast in England. Using topographical data covering a long period, 128 years from 1873 to 2001, Dornbusch et al.15) have examined the recession of chalk cliffs for a 26-km long coastal stretch between Black Rock and Belle Tout, and presented alongshore variations in recession distance. Of particular interest to the author is that there is a 1.5-km long coastal stretch receding at a markedly high rate of 0.62 m/y (1873–2001), more than double the rate in the remaining sections of their study area (Dornbusch et al., 2008, Table 1).15) So, an attempt will be made here to elucidate the temporal and special variations in cliff retreat along this 1.5-km stretch. The stretch is located in the eastern part of the Seven Sisters coast, a WNW–ESE oriented, 4-km section between just east of Cuckmere Haven and Birling Gap (Fig. 3). The Seven Sisters form a series of chalk cliffs with peak altitudes ranging from 44 m (Flat Hill) to 79 m (Haven Brow) and with the lowest height of 14 m (Birling Gap). The cliffs are mainly composed of Seaford Chalk Formation on which Newhaven Chalk resides capping the highest hills. Uniform chalk units, Cuckmere Beds of Seaford Formation, are exposed to the lower part of the cliffs except at the western end of the Seven Sisters.15) Vertical joint sets prevailing in the cliff yield vertical cliff collapses.16) The western half of the Seven Sisters shows an almost linear cliffline, while the eastern half is reentrant (Fig. 3). The cliffline intersects dry valleys descending the dip of chalk strata, and the dry valleys have been truncated due to active cliff erosion and left hanging.17) The material forming cliffs just below the valley floor is composed of weak, frost shattered chalk.15) Except for these particular sites at the mouth of dry valleys, the remaining cliff sections are considered to have a similar hardness owing to the same lithology. Shore platforms well develop along the Seven Sisters coast, but the size of beaches at the cliff base changes temporally and spatially. A wave rose diagram18) shows that the dominant direction of incident storm waves to the Seven Sisters coast is between WSW and SW (Fig. 3): the eastward longshore transport prevails on this coast. The mean tidal range is 4.9 m.17)

The 1.5-km section almost corresponds to the reentering portion including Birling Gap; so it is called here ‘Birling Gap section’ (Fig. 3). Mean annual cliff retreat rates in this section were calculated on each transect (50-m interval) from data of Dornbusch et al. (2008, Fig. 2a)15) for various time spans from 1873. Figure 4 plots alongshore variations in the rates for five time periods. The top diagram shows a considerably large scatter for 26 years from 1873 to 1899, the shortest period of time. Reading this figure downwards, it is found that data scatter becomes smaller as the time span lengthens. This implies that the cliffline in the Birling Gap section tends to have receded keeping a similar plan shape to the present coastline when considering a longer time span. The values for the space-averaged recession rate, $\bar{R}$, and its standard deviation, σ, are put beside each graph in Fig. 4. The variation coefficient, $\sigma /\bar{R}$, is plotted against the length of time interval, τ, for the Birling Gap section (Fig. 5); other available data are also plotted, which are taken from two receding cliffs on the Pacific coast of Japan, Byobugaura and Okuma, both composed of Neogene sedimentary rocks19) and from a till cliff located at Easington, Holderness, England (the result of analysis20) of the original data of Richards and Lorriman13)). All these coasts have no significant alongshore variation both in wave characteristics and cliff materials. Figure 5 illustrates that the value of $\sigma /\bar{R}$ decreases with increasing τ for the four coasts, although the $\sigma /\bar{R}$-decreasing trend is different for these sites. The spatial variation in recession rates becomes smaller as the interval of time increases, which means that parallel recession of the cliffline will occur over a long period on a coast with little alongshore variation in waves and lithology. On such a coast a spot left uneroded will recede sooner or later. An important problem, especially for engineers and planners,16) is to predict when, where and how the next recession will occur.

3. Cliffline development
Numerical modeling on the long-term evolution of rocky coastlines has recently been carried out by Limber and Murray,21) Limber et al.22) and Carpenters et al.23) Common to these studies is that the modeling has incorporated the beach width or volume at the cliff base considering that such beach characteristics can represent the effect of beach sediment that may increase erosion working as an abrasive or halt it acting as an obstacle.
Assuming that sediment deposition at the foot of a cliff always enhance erosion irrespective of its amount, the cliffline indentation in the Birling Gap section (Fig. 3) will be explored here. The axis of Birling Gap syncline (heavy dashed line in Fig. 3) plunges west.16) Supposing that the Birling Gap dry valley had followed the syncline axis before the cliff reached the present location, the dry valley must have been situated on the seaward extended axis, depicted by a thin dashed line in Fig. 3. It would be reasonable to consider that a dry valley between Went Hill and Bailey’s Hill can be extended as shown by a dotted line in Fig. 3. Then, the intersecting point, A, of the two extended valley lines is located about 610 m offshore of the present cliff at the mouth of the dry valley between the Went and Bailey’s Hills. As discussed above, parallel recession of the cliffline must have taken place for a long term. As the cliffline was approaching A, the cliff resistance in its western portion must have much reduced due to merging of two particular sites having fractured, weaker chalk, resulting in the formation of a reentrant there. With growing indentation, beach sediment was prone to deposit at the cliff base. Deposition would also have been expedited because this indented portion is situated downdrift of the littoral transport system of the Seven Sisters coast, as described before. Sediment at the cliff base must have promoted cliff toe erosion working as abrasive tools, so that the degree of the indentation has augmented alongshore and the present-day plan shape has gradually formed. A graph of Dornbusch et al. (2008, Fig. 6)15) illustrating temporal changes in beach width during 128 years from 1873 to 2001 indicates that more stable and wider beaches developed in the Birling Gap section compared with the other areas.

If a constant value of 0.6 m/y is applicable as a long-term recession rate for the period over 100 years (the bottom diagram in Fig. 4), then the time required for the development of the recurved coastline can be estimated at about 1,000 years (610 m/0.6 my−1 = 1,016 y). It is envisaged that the presence of the two linear fracture zones having intersected offshore 1,000 years ago played a crucial role in the formation of the present-day coastline indentation, and the indentation has developed under the following positive feedback relationship: the lithological weakness triggered the formation of reentrant in the cliffline, which in turn facilitated deposition of beach sediment, which allowed waves to use the sediment particles as an abrasive to accelerate erosion, which enlarged the reentering part alongshore, and so on.
The top diagram in Fig. 4 demonstrates a considerable spatial variability in the recession rate for the shortest time span; the remaining four diagrams indicate that the recession rate reduces towards the both ends of the 1.5-km section. This is probably due to a smaller amount of beach sediment there workable as abrasive tools. The result for the longest term (the bottom diagram) shows that the central 1-km section has a similar recession rate, 0.6–0.7 m/y, in spite of the presence of the two particular locations having weaker cliff material. This suggests that (1) such localized weakness in cliff resistance exerts no marked influence on a general cliffline configuration; looking very locally, however, the coastline indentation is appreciable at a place very near Birling Gap,24) and (2) abrasive force of sediment-laden waves has no significant alongshore variation within this 1-km section.
4. Cliff height vs. recession rate
If a cliffline with similar lithology but varying height is subjected to the same wave conditions alongshore, then the higher cliffs supply a larger amount of debris to the cliff base for a given toe erosion by waves. Cliff undercutting is halted until the debris is removed by wave and current action. More time is needed for the removal of larger debris masses. This leads to the concept that higher cliffs have smaller recession rates than lower cliffs.25) However, this cliff-height vs. recession-rate relationship does not appear to hold when we consider long-term cliff retreat. If a cliffline with similar lithology is exposed to wave action with little alongshore variation, then the cliffline has a tendency toward parallel retreat with increasing time span as suggested by Fig. 5: the cliff height is likely to have no relation to long-term recession rates. Three of the four coasts in Fig. 5 have a cliff with varying height, ranging from 10 to 60 m for Byobugaura, from 28 to 35 m for Okuma and from 14 to 45 m for the Birling Gap section, but the remaining coast, Easington, has an almost constant height, 8 m.
The concept that higher cliffs recede more slowly than lower cliffs may be valid in a short interval of time as seen at Covehithe, Suffolk, England:26) during the well-known 1953 storm surge occurred on the North Sea a glacial sand cliff 12 m high was eroded 12 m overnight, whereas a cliff 3 m high was cut back 27 m. A little longer-term case can be taken from Sertung, Krakatau Island, Indonesia:27) cliffs made of pyroclastic deposits receded at a maximum rate of 3 m/month where the cliff height was 5.7 m and at 1.4 m/month where it was 9.7 m, during the monsoon season between 1981 and 1982.
5. Mechanisms of cliff toe erosion by waves
Two forces are deeply involved in the erosional process: the assailing force of waves and the resisting force of rocks. It should be mentioned that waves always exert their assailing force on the face of a cliff, irrespective of their magnitude, whenever they act on the cliff. Erosion occurs only when the wave assailing force surpasses the rock resisting force.
5.1 Wave assailing force.
The assailing force of waves at the toe of a cliff exerts two kinds of action on its face — hydraulic and mechanical. Waves do not exert any dynamic force on the cliff without hydraulic action: this action is crucial. The hydraulic action consists of compression, tension and shearing, these actions almost simultaneously occurring on the cliff face upon wave assault. Compressive action is the force acting perpendicular to the cliff and is closely related to the assailing force around the still-water level for the case of breaking waves occurring just in front of the cliff.28) Tension is the force acting on the cliff when waves recede; this action may facilitate plucking or quarrying. Shearing occurs when waves throw up masses of water along the cliff face, immediately after waves hit the cliff, giving rise to a tangential stress on it.
Upon wave action, explosive force may be produced on some occasions in visible joint- or fault-associated openings in a rock mass owing to compressed air within such discontinuities. The explosive force acts to grow the interstices wider and deeper by a known process, ‘wedge action’. Yamamoto et al.29) have attempted through a laboratory experiment to examine wave pressure rise in a vertical crevice on a model cliff, the result being summarised in Sunamura.3) The rise in pressure in a horizontal opening has been assessed theoretically.30) Laboratory work by Wolters and Müller31) has indicated a high possibility of crack growth owing to pressure pulses propagating interstices.
Incessant compressive action of waves on a sea cliff generates reciprocating stresses in it; this long-lasting cyclic loading to a rock mass would generate crack initiation and propagation, leading to strength reduction.32),33) The process, called ‘fatigue’, brings about deterioration of overall rock mass strength or facilitation of detachment of blocks, or both, depending on the rock type and structure. As the number of cyclic loading increases, the intact strength gradually decreases and finally attains a constant value known as ‘fatigue limit’. Little is known about how to evaluate the fatigue limit of a rock mass under the action of waves in the field; this is an interesting problem to be solved, but the solution may involve much difficulty.
The mechanical action arises when waves are armed with clastic sediment at a beach in front of sea cliffs; a distinctive feature of the action is wearing, grinding, or scraping of the cliff face due to friction and impact of solid materials entrapped in waves. Although abrasion has been widely recognized to be a major process operating on rocky coasts, there have been few quantitative field studies on abrasion-caused topographic changes except for Robinson,34) who had conducted instrument measurements using a Micro Erosion Meter on the Whitby coast in northeast Yorkshire, England, and found that the most intensive abrasion occurred at the cliff-beach junction. For a deeper insight into abrasion processes, it is needless to say that measuring abrasive forces and rock resistivity as well as the resultant rock-surface change is requisite. The first measurement of abrasive forces has been made on the macro-tidal coast of south Wales by Williams and Roberts.35) They have attempted to evaluate impact forces of waves armed with pebbles by use of a specially designed instrument to provide measurements of the momentum of pebbles. Unfortunately, no such attempts have been made since then.
Clastic sediment on rocky coasts acts as an abrasive to accelerate erosion or as an obstacle to decelerate it, as clearly demonstrated in a wave flume experiment.36) The role of sediment is contradictory. This depends on a dynamic balance between input wave energy and the development of the fronting beach, and the erosion intensity will be determined by a combination of the energy level at the cliff-beach junction and the amount and size of sediment mobilized there.37)
5.2 Rock resisting force.
The resisting force of rocks forming a sea cliff is determined principally by their mechanical strength, which is closely associated with lithology (rock type) and structure (discontinuities such as cracks, joints, faults, and bedding planes). The resistivity of cliff material without discontinuities, intact material, can be evaluated in terms of (1) uniaxial (unconfined) compressive strength, which will be hereafter referred to as ‘compressive strength’, (2) tensile strength and (3) shear strength or wear resistance. These strength parameters are positively correlated each other.2) The most suitable parameter for expressing the rock resisting force has not been fully investigated. One of the above three strength measures, compressive strength, a widely used index with well-established testing criteria, is probably an appropriate parameter for the resisting force of rocks.2)
Compressive strength values are obtained through the compression test by crushing rock specimens. Contrary to this, non-destructive tests are available for assessing compressive strength by use of three kinds of light, portable and economical devices: the Schmidt Hammer, the Equotip hardness tester, and a needle-type penetrometer, all of which can be used for rapid estimation of in situ rock hardness. The Schmidt Hammer has been widely employed in geomorphological research.38) There have been many conversion formulas to relate the hammer rebound value to compressive strength; hence evaluation of compressive strength from the Schmidt Hammer hardness is possible through an appropriate formula. The Equotip hardness tester has a similar principle in the measuring system to the Schmidt Hammer. Attempts have been made to examine the relationship between the Equotip reading and compressive strength39),40) and to apply this instrument to geomorphological studies.41),42) A needle-type penetrometer,43),44) a specially designed penetrometer for weak rocks, has a correlation chart between compressive strength and penetration readings given by the manufacturer.
Most sea cliffs have more or less cracks and fractures such as joints and faults. It is obvious that the presence of such discontinuities on the cliff face act to reduce the resistivity against wave assault. According to Benumof and Griggs45) who have studied the influence of rock properties and wave energy on the erosion rate of cliffs along the San Diego County coast, California, joint spacing is best correlated with the erosion rate. A problem is how to evaluate the strength reduction due to structural weakness and to represent the rock resisting force. Tsujimoto46) has attempted to solve this problem by relating the compressive strength of intact rocks to Vf/Vl, where Vf and Vl are the sonic velocities measured, respectively, in the field on a rock mass having discontinuities and in the laboratory on an intact rock specimen, and used the strength parameter, (Vf/Vl)Sc, where Sc is the compressive strength. Budetta et al.47) have proposed a similar but more comprehensive measure for the rock resisting force, JpSc, in which Jp depends on the volume of a rock mass and on joint condition factors such as the roughness and alteration of joint walls and the size of joints.
It has been well recognized that sea cliffs are placed in severe weathering environments; especially the cliff material in the inter- to supra-tidal zone is always exposed to the severest situation, which produces the most favorable condition for wave erosion.48) Weathering-induced rock strength reduction is closely related to (1) deterioration of cementing material between minerals and (2) development and extension of cracks, both induced by alternate wet-dry weathering,49) frost action,49) freeze-thaw weathering,50) salt crystallization,51)–54) and the combined action of salt and frost weathering.55),56) The strength of rocks subjected to weathering has been measured by many researchers using Schmidt Hammers (references cited in Aoki and Matsukura41)). Weathering of a coastal rock mass without discontinuities begins at the rock surface and penetrates into the interior with time, which results in the formation of strength gradient, i.e., weathering profile, with the weakest part being located at the surface forming a thin layer. For testing this thin weathered layer a Schmidt Hammer is not a suitable device; rather an Equotip hardness tester41) or a needle-type penetrometer43) is useful.
6. A basic equation for toe erosion by waves
In the last quarter of the 20th century studies such as Gelinas and Quigley,57) Sunamura,58) Dick and Zeman,59) Kamphuis60) and Mano and Suzuki61) have proposed a parameter including the wave and the rock factors to describe wave-induced cliff erosion. The studies except for Sunamura58) have introduced wave energy flux as a representative of the wave factor, while he has used wave height. As a parameter for the cliff resistance, Sunamura58) has incorporated the compressive strength and Mano and Suzuki61) have employed the modulus of elasticity (or Young’s modulus), but the other studies have included parameters with no explicit physical meanings.
Since the beginning of this century model studies on the evolution of cliffed coasts under stationary sea-level conditions have been intensively performed (e.g. Walkden and Hall,62),63) Trenhaile,64) Castedo et al.,65)–67) Limber and Murray,21) Hackney et al.,68) Kline et al.,69) Limber et al.22)). In these studies, Trenhaile64) and Kline et al.69) have employed wave height as the wave parameter, while Hackney et al.68) has used wave energy and the remaining models have applied wave energy flux. Concerning the rock parameter, Castedo et al.65)–67) and Kline et al.69) have introduced compressive strength, and the other studies have contained unknown parameters that were not physically defined. These situations imply that no generalized fundamental equation for cliff erosion has been established.
Sunamura58) has developed the following cliff erosion equation based on the result of his wave tank experiment:36)
| \begin{equation}
\mathrm{d}X/\mathrm{d}t = C\boldsymbol{{F}}
\end{equation}
| [1] |
where
X is the erosion distance,
t is the time,
F is the erosive force of waves, and
C is a proportional coefficient. Waves always exert their assailing force on the face of a cliff, irrespective of their magnitude, whenever they act on the cliff. Once the assailing force exceeds the resisting force of cliff material, then waves possess the erosive force
F to accomplish erosion. Therefore, the erosive force is defined as the force which leads to actual removal of cliff substrate. Sunamura
58) has proposed the following logarithmic function for
F considering a threshold concept:
| \begin{equation}
\boldsymbol{{F}} = \ln (F_{\text{W}}/F_{\text{R}})
\end{equation}
| [2] |
where
FW is the assailing force of waves and
FR is the resisting force of cliff-forming rocks. This relation is valid only when
FW ≥
FR. Through the selection of appropriate physical quantities for
FW and
FR,
Eq. [2] has been applied to field studies
47),70) and model calculations.
69) However, some difficulty is involved in the mathematical treatment of
Eq. [2] due to the logarithmic function, so that a simpler relation for
F has been proposed:
71)
| \begin{equation}
\boldsymbol{{F}} = (F_{\text{W}}/F_{\text{R}}) -1\quad \text{for $F_{\text{W}} \geq F_{\text{R}}$}
\end{equation}
| [3a] |
| \begin{equation}
\boldsymbol{{F}} = 0\quad\quad\quad\quad\quad\quad \text{for $F_{\text{W}} < F_{\text{R}}$}
\end{equation}
| [3b] |
As described earlier, waves exert hydraulic action, mechanical action and, on some occasions, wedge action. Almost simultaneous occurrence of these processes characterizes wave assailing force. Because waves do not exert any force on a cliff without hydraulic action, this action is essential. Considering that hydraulic action is directly related to wave energy, Sunamura28) has examined the assailing force of laboratory breaking waves, and derived the force from the kinetic energy of water particles at the crest of breaking waves against the cliff face; the result is given by Fw ∼ ρgHB (HB = the breaker height, ρ = the water density and g = the acceleration due to gravity). Supposing that the similar relation is also applicable to broken waves rushing to a cliff, the following can be written:
| \begin{equation}
F_{\text{w}} = A\rho gH_{\text{f}}
\end{equation}
| [4] |
where
Hf is the height of waves just in front of the cliff irrespective of breaking and broken waves and
A is a dimensionless coefficient. In order for
Eq. [3a] to have a physical significance, the rock resisting force
FR must have the same units as
Fw,
i.e., [F/L
2]. Assuming that
FR is linearly related to the compressive strength,
Sc, we have:
| \begin{equation}
F_{\text{R}} = BS_{\text{c}}
\end{equation}
| [5] |
where
B is a dimensionless coefficient.
Substitution of Eqs. [4] and [5] into Eq. [3a] yields:
| \begin{equation}
\boldsymbol{{F}} = (A/B)(\rho gH_{\text{f}}/S_{\text{c}}) - 1
\end{equation}
| [6] |
From
Eqs. [1] and
[6], one obtains:
| \begin{equation}
\mathrm{d}X/\mathrm{d}t = K[(\rho gH_{\text{f}}/S_{\text{c}}) -\varepsilon]
\end{equation}
| [7] |
where
K (=
AC/
B) is a coefficient with the same unit as erosion rate, [LT
−1], and ε (=
B/
A) is a dimensionless threshold value. The coefficient
K is:
| \begin{equation}
K = C/\varepsilon
\end{equation}
| [8] |
Examination of the validity of Eq. [7] and determination of the coefficients K and ε have been made by use of data selected from those of previous cliff erosion experiments19),72) using model cliffs lacking discontinuities such as cracks and fissures. The data used for these purposes were all taken from the results of erosion tests by waves having hydraulic action alone (without any effect of beach sediment). A result of a best fit of Eq. [7] with the data is demonstrated in Fig. 6, and determined K- and ε-values are also shown. Substitution of these values into Eq. [8] gives:
| \begin{equation}
C =
\begin{cases}
3.96 \times 10^{-2}\,\text{cm/h} & \text{for breaking waves}\\
3.82 \times 10^{-2}\,\text{cm/h} & \text{for broken waves}
\end{cases}
\end{equation}
| [9] |
This result with
C taking on a similar value strongly suggests that
Eq. [1] is valid, and hence
Eq. [7] can be applied to rocky coast erosion problems in the field. Actually an application of
Eq. [7] has been made to describe the development of Type-B platforms on Pacific coasts of Japan.
71)
Incidentally, for the case of ρgHf/Sc ≫ ε, i.e., ε ≈ 0, which means that no threshold is necessary to consider, then Eq. [7] approximates:
| \begin{equation}
\mathrm{d}X/\mathrm{d}t = K (\rho gH_{\text{f}}/S_{\text{c}})
\end{equation}
| [10] |
This equation may be applied to cliffed coasts composed of extremely weak material such as base-surge deposits
73) and salt marsh deposits.
74)
7. Factors controlling toe erosion
7.1 Water level.
This affects the energy level of waves at a cliff base, and includes in order of decreasing periodicity in their fluctuations: (1) global eustatic sea-level change, (2) seasonal variations in sea levels, and (3) tides including storm surges (Fig. 2). When considering sea-cliff erosion in tectonically active areas such as the circum-Pacific, crustal movements are of importance in addition to eustatic sea-level change; the combined effect is the relative sea-level change as measured on tide gauges. The influence of relative sea-level change on cliff erosion has been documented along the coast of Oregon in the Pacific Northwest.75) A marked spatial variability in cliff erosion has been produced on this 500-km long coast having a north-south orientation. The tectonic movement is associated with the subduction of oceanic plates beneath the continental North American plate. An earthquake-induced subsidence occurred in the year 1700, and has been followed by a gradual aseismic uplift. Along the southern half of the Oregon coast and near the Oregon-Washington border in the north, this tectonic uplift has exceeded the global eustatic rise in sea level during the past century, resulting in a drop in relative sea level that has largely eliminated sea-cliff erosion, although evidence remains for the large-scale erosion that followed the abrupt subsidence during the subduction earthquake 300 years ago. Along the north-central Oregon coast, the present rise in eustatic sea level exceeds the tectonic uplift, and the relative sea-level rise continues to be a factor in sea-cliff erosion, although the erosion rates are highly variable due to site-specific factors.
The seasonal occurrence of variations in monthly mean sea levels is due mainly to changes in water temperatures and densities, with additional contributions due to the geostrophic effects of offshore currents.76) At most locations, mean water levels are higher during the summer due to the warmer water. Along the west coast of North America, monthly mean sea levels have been increased by up to 20 cm during El Niño Southern Oscillation (ENSO) events, with the 1982–83 and 1997–98 ENSO events having been most dramatic.77)–82) On enclosed water bodies such as the Great Lakes, seasonal changes in water levels are experienced due to fluctuations in precipitation and evaporation that govern the inflow versus the outflow from the lakes.
The tidal or lake-level variations are frequently disturbed by meteorological factors, resulting in episodic water-level changes known as ‘storm surge’ or ‘surge’. The most important phenomenon that may accelerate sea-cliff erosion is an abnormal rise in water level caused by strong onshore winds and an abrupt reduction in atmospheric pressure. A remarkable water-level rise may occur on tidal coasts when storm surges are superimposed on high tides. The 1953 storm surge on the North Sea caused dramatic erosion of glacial-sediment cliffs at Covehithe, Suffolk, England,83) as described before. A good correspondence between erosion of bluffs composed of glacial till and surge-induced extreme water level rises superimposed on seasonal variations has been reported from the Ohio shore of Lake Erie.49)
7.2 Beach in front of a cliff.
Beaches front most eroding cliffs. Where the cliff material is so soft that only the hydraulic action of waves is sufficient to cause erosion, critical for its initiation is whether waves running up the beach are able to reach the cliff-beach junction. This is controlled by many factors: input wave characteristics (wave height and period), the beach morphology (beach width, beach level and slope) and the water-level factors discussed above.
The relationship between the width of the fronting beach and the rate of erosion of sea cliffs has been examined by Everts,84) selecting five sites along the 90-km coast of the Oceanside littoral cell, north of San Diego, California, where the beach is backed by cliffs composed of Neogene sandstones. At each site the erosion rate decreased as the beach became wider; a marked decrease occurred when the beach width exceeded 20 m, and erosion ceased altogether when it attained a width of 60 m. Dornbusch et al.15) have reported from their recession study of chalk cliffs on the East Sussex coast, England, that at Newhaven a beach width of more than 70 m was necessary to prevent storm waves from directly attacking the cliff.
The reduction or removal of the fronting beach occasionally leads to a dramatic increase in sea-cliff erosion. This occurred at a sea cliff at Pacific Manor, Pacifica on the central California coast during the 1997–98 ENSO event.85) The cliff, composed of poorly consolidated eolian and alluvial deposits, had receded at a long-term average rate of 0.25 m/y86) and experienced 14-m retreat85) during the ENSO event. This was caused by the attack of storm waves with extreme high runup levels, which reached the cliff base with less energy dissipation due to localized lowering and narrowing of the beach in front of the cliff, these corresponding to one of rip-current embayments of a cuspate shoreline formed by storm waves.
The role of the morphology and behavior of a fronting beach is further illustrated by erosion of sea cliffs cut into Pleistocene sandstones along the central Oregon coast.75),87) The beaches developed along the 24-km length of the Lincoln City littoral cell range from dissipative to nearly reflective, depending on the grain size of the beach. The coarser-grained reflective beaches are steeper sloped and respond more quickly to winter storms with larger changes in beach-profile levels than do the fine-grained, gently-sloping dissipative beaches. As a result, the reflective beach is a weaker buffer against wave attack, and the sea cliff is more susceptible to erosion compared with areas where the cliff is fronted by a dissipative beach. A further decrease in buffer protection on the reflective beach is brought about by the more pronounced development of embayments eroded by rip currents, allowing for easy landward penetration of storm waves to the toe of the sea cliff.
The height of a fronting beach can be uniquely determined by the volume of beach material if a uniform beach slope is assumed. Along the North Norfolk and Suffolk coasts, England, Lee88) has examined on the year-by-year basis the recession rate of Pleistocene soft rock cliffs in connection with the volume (above High Water Level) of the fronting beach during a period of 11 years, and provided for each coast the relationship between recession rate and beach volume, plotted with highly scattered data. An envelope of the data cluster shows that, as the sediment volume increases, the maximum recession rate (for a given sediment volume) tends to increase abruptly and decrease after the volume excesses some optimal value. A more marked trend is seen on the Suffolk coast.
Let us examine here the effect of a fronting beach on cliff toe erosion considering the wave and cliff strength factors. Bluffs composed of glacial deposits on the US shore of Lake Erie have suffered severe recession.89)–91) At five sites in the western part of the Ohio shore, Carter and Guy49) have performed a detailed study on cliff-base erosion process during five years from 1975 to 1980, which included measurements of the width of the fronting beach and accurate surveys of eroded distances conducted every two weeks and after storms to evaluate the toe erosion. The study has discussed erosion magnitude in connection with storm waves accompanying surges, water level (storm surge plus lake level) and beach width. Data acquired at Helen Drive, one of the five sites, will be used here for a quantitative examination of the effect of beach width on the cliff toe erosion by waves. The Helen Drive bluff (7 m high) is composed of weak till having a mean compressive strength of 0.26 MPa. In front of the bluff a narrow, sandy beach developed with a width varied from 0 to 9 m with time.49) Till is exposed to the nearshore bottom.92) Twenty-three erosion events took place at Helen Drive during the five years. Seven of them are selected here, which occurred under almost similar water-level conditions (including surge height), 1.4 to 1.5 m above datum: six occurred from April to August 1976 and one from May 1978 (Carter and Guy, 1988, Fig. 4).49) The reason for the selection is to preclude the influence of water level on the cliff erosion rate. The magnitude of storm surges at the seven events was in a range from 0.2 to 0.3 m. Carter and Guy49) have observed that (1) wave breaking occurred offshore at a storm and broken waves acted on the cliff, (2) mean values for storm wave height and period in the surf zone were 1 m and 6 s, respectively, (3) the largest erosion events occurred when the storm durations exceeded 10 h, and (4) sand-laden waves abraded the cliff toe. No detailed data are provided on the height of the cliff-platform junction. From the surge heights described above, 0.2–0.3 m, and photographs in Carter and Guy (1988, Figs. 3 and 11),49) it is assumed that the water depth at the cliff-platform junction took on a constant value of 0.3 m at the storm events. A further assumption is made that the storm waves always had a breaker height of 1 m, a period of 6 s, and a duration of 10 h.
Figure 7 shows the relationship between the erosion rate and the beach width at the seven events. The erosion rate is the mean value obtained by dividing the erosion distance during a single storm event by 10 h, the distance read from the diagram of Carter and Guy (1988, Fig. 4),49) and the beach width is the value at the time of storm surge occurrence, also read from the same diagram. There is clearly an optimal value for beach width giving rise to the maximum erosion rate. In order to express mathematically the erosion-rate vs. beach-width relationship, an attempt will be made to apply Eq. [7] replacing dX/dt with R (time-averaged erosion rate) and introducing the effect of beach width into K:
| \begin{equation}
R = K(W) (\rho gH_{\text{f}}/S_{\text{c}} -\varepsilon)
\end{equation}
| [11] |
where
W is the beach width and
K(
W) is described as:
| \begin{equation}
K(W) =
\begin{cases}
a(W/W_{\text{op}}) + c & \text{for $0 \leq W \leq W_{\text{op}}$}\\
b(W_{\text{c}}/W - 1) & \text{for $W_{\text{op}} < W \leq W_{\text{c}}$}
\end{cases}
\end{equation}
| [12] |
where
Wop is the optimal beach width giving the maximum erosion rate,
Wc is the critical width beyond which no erosion occurs, and
a,
b, and
c are constants with units of [L/T]. This relation is similar to that used in Limber and Murray’s model.
21)
The application of Eq. [11] requires Hf, the height of broken waves arriving at the cliff base when no beach exists. For this purpose, the following relation93) will be used:
| \begin{equation}
H_{\text{f}}/H_{\text{b}} = \exp [-35.2 l\tan\beta/T\surd(gh_{\text{b}})]
\end{equation}
| [13] |
where
Hb is the height of breaking waves,
hb is the breaking depth,
T is the wave period,
l is the horizontal distance from the wave break point to the location under consideration, and tan β is the nearshore bottom slope. The well-known relation
Hb/
hb = 0.8
94) with
Hb = 1 m yields
hb = 1.25 m. Because the bottom slope at Helen Drive is 1/80:
92) tan β = 1/80, the horizontal distance from the breaking point to the cliff base with a water depth of 0.3 m is 76 m:
l = 76 m. Using these values (
Hb = 1 m,
hb = 1.25 m, tan β = 1/80 and
l = 76 m) and
T = 6 s, we have
Hf = 0.2 m from
Eq. [13]. Broken waves with a height of 0.2 m are estimated to have acted on the cliff toe with no sand beach. The rate of erosion caused by the waves is assumed to be 0.3 cm/h, the value at
W = 0 in
Fig. 7. Substituting
R = 0.3 cm/h,
Hf = 0.2 m,
Sc = 0.26 MPa, ε = 0.004 (the experiment value for broken waves having no abrasive effect of sand — See the inset of
Fig. 6) into
Eq. [11] yields
K(
W) = 81 cm/h. Because
K(
W) =
c from
Eq. [12] for
W = 0, we have
c = 81 cm/h. The line and curve in
Fig. 7 are the results of best fitting
Eq. [11] to the data by using the above values for
Hf,
Sc, ε and
c, and by selecting
Wop = 1.25 m,
Wc = 6 m,
a = 1,139 cm/h and
b = 321 cm/h.
Equation [11], thus determined (
Fig. 7), indicates that the erosion rate abruptly increases with increasing beach width and attains its maximum; as the beach width further increases, the rate drops and finally becomes null. It is found that the fronting beach with 0 <
W ≲ 5 m works to augment erosion, while the beach with
W ≳ 5 m has a buffering effect, because the erosion rate is less than 0.3 cm/h, the rate at the time of no beach. Because
C = ε
K(
W) (from
Eq. [8]),
C in
Eq. [1] is found to be a coefficient representing the effect of beach sediment on cliff erosion.
7.3 Shore platforms at the cliff base.
The geometry and dimensions of the fronting platform may affect the wave intensity at the cliff base. Philpott95) and Kamphuis60) have considered that downcutting of the platform surface immediately in front of the cliff must have occurred prior to the cliff recession: increasing water depth at the cliff base will reduce energy dissipation of waves arriving at the cliff base to further cliff erosion. Based on extensive studies on cliffs and shores composed of cohesive materials, Hutchinson96) has also suggested that the lowering of shore platforms controls the cliff erosion. The platform downwearing has been widely observed along the till shores on the Canadian side of the lower Great Lakes.60),97)–99)
The height of a cliff-platform junction tends to increase as the strength of coastal rocks increases, as conjectured from the result of laboratory experiments on notch initiation under the action of broken waves.100) In the field, however, this height is controlled not only by the rock strength but also by multiple factors like the degree of wave exposure, tidal range, rock type and structure and the availability of sediment at the cliff foot (see Moses’ review101) and references therein). On the chalk coast of southeast England, shore platforms are of concave upward profiles with some having steeply inclined ramps at the cliff base, and the cliff-platform junction is located at about the high tide level, generally several meters above the mean platform level.101) As the chalk cliff recedes, the platform surface will be lowered with time. The lowering of chalk platforms involves various erosive processes: abrasion by waves armed with beach deposits residing on the platform, plucking of jointed blocks by hydraulic force and their removal,102) direct erosion of platform substrates due to grazing by marine organisms103) and deterioration of platform material due to frost and salt weathering especially in harsh winters.55)
Measurements of chalk platform downwearing have been carried out by use of Micro Erosion Meters104)–106) and laser scanners.107) All these studies have provided us short-term (2–3 years) information. Foote et al.106) have pointed out the importance of measuring larger-scale topographic changes such as the detachment of joint-bounded blocks at the edge of steps on the platform. Dornbusch and Robinson108) have attempted to investigate long-term chalk platform lowering on the basis of measurements of the block removal and step backwearing on the East Sussex coast, England, using air photographs taken in 1973 and recent field studies done in 2001. They converted the amount of step erosion into equivalent mean annual platform lowering rates during the period of 28 years.
7.4 Nearshore bottom topography.
The offshore bottom topography and its effect on wave refraction or wave-energy attenuation may control the assailing force of waves acting on a sea cliff. Robinson109) has examined the long-term variation in erosion rates at Dunwich soft cliffs in Suffolk, England. The average rates were 1.6 m/y from 1589 to 1753, 0.85 m/y from 1753 to 1824, 1.5 m/y from 1824 to 1884, 1.15 m/y from 1884 to 1925, but then dropping to only 0.15 m/y from 1925 to 1977. This drop can be attributed to the reduction in wave energy reaching the coast. Before the early 20th century, wave refraction over the offshore Sizewell Bank focused the wave energy on the shoreward Dunwich site, but the northward growth of the Bank during the last century produced a divergence in wave refraction and a reduction in the assailing force of the waves.
Lowering of shore platforms located offshore of rapidly receding till cliffs has been extensively studied along the Canadian shore of the lower Great Lakes,60),97)–99),110) where till bottoms are covered with a sparse veneer of sand. These studies have been conducted with a view that nearshore lowering will reduce the dissipation of wave energy reaching the cliff toe, which in turn will expedite cliff erosion.
7.5 Talus.
The presence of talus is a major controlling factor for toe erosion, because talus can protect the foot of the cliff from wave attack until it is removed by waves and currents. Knowledge on the residence time of the talus is necessary for predictive studies of cliff recession. In the Lincoln City littoral cell on the mid-Oregon coast, USA, the life time of talus at the base of a cliff fronted by a dissipative beach is much longer than where a steeper reflective beach is found.75) The talus remains for several years to decades when protected by a dissipative beach because of the less-active, low-intensity infragravity dominated swash, resulting in a slow recession of the cliff; on the other hand, when a more-reflective beach develops, dominated by swash with a strong incident-wave component, the talus is rapidly removed yielding higher cliff-recession rates. On the chalk coasts in southeast England most cliff failures yield small amounts of debris, less than 1,000 m3 in volume, which may be removed in a few weeks or months.17) Moses and Robinson102) have stated that the debris caused by medium-scale failures (1,000–10,000 m3) of chalk cliffs may be removed for months, and implied that decades of erosion are required for the removal of debris supplied from larger-scale failures (10,000–50,000 m3). Lageat et al.111) have reported from a chalk coast at Petites Dalles south of St-Valéry-en-Caux in Seine-Maritime, France that the debris of 7,947 m3 had been completely swept away in eight months. Thus, data on the size of talus and/or the time required for the removal have been accumulated in some locations, but more accurate data, preferably together with those of marine agents are needed for the establishment of an empirical predictive relation for the residence time.
8. Slope instabilities and mass movement
Cliff undercutting by waves results in slope instabilities, eventually leading to intermittent mass movement. Such movement can be occasionally destructive to coastal properties. For example, the initial movement of the Miocene mudstone cliff in the Jump-Off Joe area on the Oregon coast resulted in the loss of a dozen homes during the 1940s.112),113) In 1982 approval was given to construct a condominium on this unstable site, and movement once again destroyed the structure before it could be inhabited. Such a serious problem threatening coastal communities has been reported from many locations in California.114)
A variety of terms are used for mass movement phenomena. ‘Landslide’ is a general term, which may be further classified into four types of mass movement: falls, topples, flows and slides. These types depend mainly on lithological factors such as geological structures, stratigraphic features, and geotechnical properties. Hybrid types exist between two or more of these failure modes.
Falls denote movement of a rock mass that travels most of the distance through the air as a freely-falling body, but mass movement occurring along an almost vertical failure plane is also categorized into this mode, also referring to as a vertical failure type.115) This type is frequently found on chalk cliffed coasts facing the English Channel,16),115),116) where the presence of a notch at the cliff base is not necessarily a crucial factor for this failure type. An example of deep-notch development responsible for the vertical failure can be taken from Eocene sandstone cliffs on the southern California coast.117)
Topples differ from falls in that little free-fall movement takes place because rotation of a block around a fixed hinge dominates the motion. Topples are most common on precipitous, sometimes overhanging, cliffs composed of vertically-jointed hard rocks like those found on the Liassic coasts of South Wales.118),119) Even on soft rock cliffs if vertical joint systems develop, toppling may occur as seen at Varkara, Kerala, India120) and Rio Grande do Nord State, northeastern Brazil.121)
Flows move with increasing velocity towards the surface of the moving body; no block movement is present due to differential shearing within the body. Flows occurring on some coasts cut into soft clayey materials with fluidized potential are called mudflows, and are frequently initiated by mudslides. The sliding mass may disintegrate during its movement — the flow component increases, resulting in the generation of mudflows in the latter phase of the event. However, the distinction between mudslides and mudflows is not easy in the field. These two failure modes contribute significantly to the recession of cliffs in soft materials such as clay,122) mudstone123) and till.124)
Slides are shearing displacements occurring on a distinct slip surface, and the sliding mass exhibits block movement. There are two major movements: planar slides (also called ‘translational slides’) and rotational slides (‘slumps’). The former has an almost linear sliding surface, whereas the latter is along a circular plane. Planar sliding with a high-angle failure plane may be found on till cliffs,125) chalk cliffs126),127) and Pliocene mudstone cliffs.2) Rotational slides can be categorized into ‘shallow-seated’ and ‘deep-seated’ slides, depending on the depth of the sliding surface. Shallow-seated slides are observed on till cliffs of the Holderness coast in England,12),128) near Kilkeel in Northern Ireland,125) along the Lake Michigan129) and along the Canadian shore of the lower Great Lakes.130),131) Deep-seated slides frequently occur on the London Clay cliffs in the UK.132)
Aside from the wave factor, the most common controlling factors for the occurrence of mass movement are rainfall and groundwater. Rainfall results in gully erosion,133),134) slumping135) and vertical failure.136) The latter factor, groundwater, is closely related to fluctuations of (1) water table,131),137) (2) seepage138) and (3) porewater pressure.139),140) Frost (or freeze-thaw) action is common in the mid- to high-latitude regions, which promotes downslope movement of cliff-face materials.96) In tectonically active areas, earthquakes sometimes trigger mass movement.114),141) Vegetation factors such as the growth of tree roots within joints may induce cliff failure.141)
Most mass movement phenomena have occurred during the action of storm waves which facilitates cliff undercutting, or during and immediately after a long spell of wet weather. Other cliff failures, however, have occurred suddenly and unexpectedly during normal weather conditions, as seen from an event at Scarborough on the east coast of England.142) The event began in the morning of June 4, 1993, with shallow-seated rotational slides on a 60-m high till cliff where the toe had been protected by a sea wall. The sliding lasted for several days, leading to the gradual collapse of a four-star hotel.
Whatever the cause, mass movement acts to render the cliff face profile more stable — a more gently sloping profile develops. Simultaneously, debris masses are supplied to the base of the cliff. Waves remove the debris, undercutting the base so that the overall cliff profile once again becomes steep and unstable, and mass movement ensues. As seen in this recurrence, a cyclic change between steep and gentle profiles occurs during the cliff-recession process. This indicates that similar cliff profiles will recur with a certain time interval. A possible recurrence period for the parallel profile is estimated at 10 years for the Taito-misaki cliff cut into Pleistocene mudstone on the Pacific coast of Japan,1) and a similar value may be obtained from the similarity of cliff profiles at glacial till bluffs at the Ohio/Pennsylvania border.91) A recurrence interval of about 40 years has been reported from the London Clay cliff at Warden Point on the Isle of Sheppey, England,96) 10–40 years from chalk cliffs in England,16) 25–50 years from chalk cliffs in France143) and less than 30 years from Neogene sandstone cliffs in many places along the Oceanside coast in southern California.84) The recurrence period is a site-specific value reflecting the relationships among various factors involved in the recession process of soft rock cliffs.
9. Concluding remarks
The objective of this paper has been to review the status of our understanding of the recession processes of soft rock coasts, and to present two new findings: the temporal change in cliffline recession mode (Fig. 5) and the effect of sediment on the fronting beach on the cliff erosion (Fig. 7). The processes of cliff recession are considerably complex owing to multiple factors highly variable in space and/or time, and are characterized by the recurrence system. It should be emphasized that the driving force of the system is wave action that will remove the debris at the cliff base and then resume cliff erosion. Without cliff erosion by waves, no cyclic recession will occur.
Profile

Tsuguo Sunamura, born in Tokyo in 1941, graduated from the Geoscience Department, Tokyo Kyoiku University (now the University of Tsukuba) in 1964, and worked at Nippon Tetrapod Company as a coastal engineer until 1967. Sunamura received M.Sc. in Civil Engineering from the Graduate School of Engineering at the University of Tokyo in 1969, and Ph.D. in Coastal Engineering from the university in 1972. He started his research career as a research associate at the Coastal Engineering Laboratory, University of Tokyo in 1972 and moved to the Institute of Geoscience, University of Tsukuba in 1978 where he worked as an associate professor (1978–1987) and as a professor (1987–1996). He then moved to the Graduate School of Earth and Space Sciences, Osaka University and retired in 2004. His major research topic is morphodynamics of beaches and coasts.
Acknowledgment
I thank Professor Kiyoshi Horikawa, a member of the Japan Academy, for recommending me to write this review article.
References
- 1) Sunamura, T. (1983) Processes of sea cliff and platform erosion. In Handbook of Coastal Processes and Erosion (ed. Komar, P.D.). CRC Press, Boca Raton, Florida, pp. 233–265.
- 2) Sunamura, T. (1992) Geomorphology of Rocky Coasts. Wiley, Chichester.
- 3) Sunamura, T. (1994) Rock control in coastal geomorphic processes. Trans. Japan. Geomorph. Union 15, 253–272.
- 4) Adams, J.C. and Chandler, J.H. (2002) Evaluation of LiDAR and medium scale photogrammetry for detecting soft-cliff coastal change. Photogrammetric Record 17, 405–418.
- 5) Collins, B.D. and Sitar, N. (2008) Processes of coastal bluff erosion in weakly lithified sands, Pacifica, California, USA. Geomorphology 97, 483–501.
- 6) Hobbs, P., Gibson, S., Jones, L., Poulton, C., Jenkins, G., Pearson, S. and Freeborough, K. (2010) Monitoring coastal change using terrestrial LiDAR. In Elevation Models for Geoscience (eds. Fleming, C., Marsh, S.H. and Giles, J.R.A.). Geol. Soc. Spec. Publ. 345, Geological Society, London, pp. 117–127.
- 7) Young, A.P., Guza, R.T., Flick, R.E., O’Reilly, W.C. and Gutierrez, R. (2009) Rain, waves, and short-term evolution of composite seacliffs in southern California. Marine Geology 267, 1–7.
- 8) Young, A.P., Olsen, M.J., Driscoll, N., Flick, R.E., Gutierrez, R., Guza, R.T. and Kuesster, F. (2010) Comparison of airborne and terrestrial lidar estimates of seacliff erosion in Southern California. Photogramm. Eng. Remote Sensing 76, 421–427.
- 9) Davies, D.S., Axelrod, E.W. and O’Conner, J.S. (1972) Erosion of the north shore of Long Island. Tech. Rep. Marine Sci. Res. Center, State University of New York, Stony Brook 18, 1–101.
- 10) Bokuniewicz, H. and Tanski, J. (1980) Managing localized erosion of coastal bluffs. Proc. Coastal Zone '80, Amer. Soc. Civil Engs., 1883–1898.
- 11) Griggs, G. and Savoy, L. (1985) Sea cliff erosion. In Living with the California Coast (eds. Griggs, G. and Savoy, L.). Duke University Press, Durham, North Carolina, pp. 29–34.
- 12) Quinn, J.D., Philip, L.K. and Murphy, W. (2009) Understanding the recession of the Holderness Coast, east Yorkshire, UK: a new presentation of temporal and spatial patterns. Quart. Jour. Eng. Geol. Hydrogeol. 42, 165–178.
- 13) Richards, K.S. and Lorriman, N.R. (1987) Basal erosion and mass movement. In Slope Stability (eds. Anderson, M.G. and Richards, K.S.). Wiley, Chichester, pp. 331–357.
- 14) Brooks, S.M. and Spencer, T. (2010) Temporal and spatial variations in recession rates and sediment release from soft rock cliffs, Suffolk coast, UK. Geomorphology 124, 26–41.
- 15) Dornbusch, U., Robinson, D.A., Moses, C.A. and Williams, R.B.G. (2008) Temporal and spatial variations of chalk cliff retreat in East Sussex, 1873 to 2001. Marine Geology 249, 271–282.
- 16) Mortimore, R.N., Lawrence, J., Pope, D., Duperret, A. and Genter, A. (2004) Coastal cliff geohazards in weak rock: the UK Chalk cliffs of Sussex. In Coastal Chalk Cliff Instability (eds. Mortimore, R.N. and Duperret, A.). Eng. Geol. Spec. Publ. 20, Geological Society, London, pp. 3–31.
- 17) Williams, R.B.G., Robinson, D.A., Dornbusch, U., Foote, Y.L.M., Moses, C.A. and Saddleton, P.R. (2004) A sturzstrom-like cliff fall on the Chalk coast of Sussex, UK. In Coastal Chalk Cliff Instability (eds. Mortimore, R.N. and Duperret, A.). Eng. Geol. Spec. Publ. 20, Geological Society, London, pp. 89–97.
- 18) Mitchell, S.B. and Pope, D.J. (2004) Prediction of nearshore wave energy distribution by analysis of numerical wave model output: East Sussex coastline, UK. In Coastal Chalk Cliff Instability (eds. Mortimore, R.N. and Duperret, A.). Eng. Geol. Spec. Publ. 20, Geological Society, London, pp. 99–107.
- 19) Sunamura, T. (1973) Coastal cliff erosion due to waves — field investigations and laboratory experiments. Jour. Fac. Eng., University of Tokyo 32, 1–86.
- 20) Komar, P.D. and Sunamura, T. (2015) Morphology of erosional and accretionary coasts. In International Compendium of Coastal Engineering (eds. Sato, S. and Isobe, M.). World Scientific, Singapore, pp. 153–195.
- 21) Limber, P.W. and Murray, A.B. (2012) Beach and sea-cliff dynamics as a driver of long-term rocky coastline evolution and stability. Geology 39, 1147–1150.
- 22) Limber, P.W., Murray, A.B., Adams, P.N. and Goldstein, E.B. (2014) Unravelling the dynamics that scale cross-shore headland relief on rocky coastlines, part 1: Model development. Jour. Geophys. Res. Earth Surface 119, 854–873.
- 23) Carpenters, N.E., Dickson, M.E., Walkden, M., Nicholls, R.J. and Powrie, W. (2015) Lithological controls on soft cliff planshape evolution under high and low sediment availability. Earth Surface Processes Landforms 40, 840–852.
- 24) McGlashan, D.J., Duck, R.W. and Reid, C.T. (2008) Unstable boundaries on a cliffed coast: geomorphology and British laws. Jour. Coastal Res. 24, 181–188.
- 25) Sparks, B.W. (1986) Geomorphology. 3rd ed., Longman, London.
- 26) Williams, W.W. (1956) An east coast survey: some recent changes in the coast of East Anglia. Geogr. Jour. 12, 317–334.
- 27) Suwardi, A. and Rosengren, N.J. (1983) Coastal changes on Anak Krakatau and Sertung Island. Proc. Workshop Krakatau Sunda Strait. (cited in Bird and Rosengren135)).
- 28) Sunamura, T. (2010) Vertical distribution of assailing force of breaking waves on a steep laboratory cliff. Trans. Japan. Geomorph. Union 31, 271–282.
- 29) Yamamoto, K., Sunamura, T. and Uda, T. (1990) Experimental study on pressure rise in rock fissure due to wave action. Proc. Coastal Eng., Japan Soc. Civil Engrs. 37, 314–318 (in Japanese).
- 30) Peregrine, D.H. and Kalliadasis, S. (1996) Filling flows, cliff erosion and cleaning flow. Jour. Fluid Mech. 310, 365–374.
- 31) Wolters, G. and Müller, G. (2004) The propagation of wave impact induced pressure into cracks and fissures. In Coastal Chalk Cliff Instability (eds. Mortimore, R.N. and Duperret, A.). Eng. Geol. Spec. Publ. 20, Geological Society, London, pp. 121–130.
- 32) Brossard, J. and Duperret, A. (2004) Coastal chalk cliff erosion: experimental investigation on the role of marine factors. In Coastal Chalk Cliff Instability (eds. Mortimore, R.N. and Duperret, A.). Eng. Geol. Spec. Publ. 20, Geological Society, London, pp. 109–120.
- 33) Adams, P.N., Storlazzi, C.D. and Anderson, R.S. (2005) Nearshore wave-induced cyclical flexing of sea cliffs. Jour. Geophys. Res. 110, F02002.
- 34) Robinson, L.A. (1977) Marine erosive processes at the cliff foot. Marine Geology 23, 256–271.
- 35) Williams, A.T. and Roberts, G.T. (1995) The measurement of pebble impacts and wave action on shore platforms and beaches: the swash force transducer (swashometer). Marine Geology 129, 136–143.
- 36) Sunamura, T. (1976) Feedback relationship in wave erosion of laboratory rocky coast. Jour. Geology 84, 427–437.
- 37) Sunamura, T. (1982) A wave tank experiment on the erosional mechanism at a cliff base. Earth Surface Processes Landforms 7, 333–343.
- 38) Goudie, A.S. (2006) The Schmidt Hammer in geomorphological research. Progress Phys. Geography 30, 703–718.
- 39) Verwaal, W. and Mulder, A. (1993) Estimating rock strength with the Equotip hardness tester. Int. Jour. Rock Mech. Mining Sci. & Geomech. Abstr. 30, 659–662.
- 40) Aoki, H. and Matsukura, Y. (2008) Estimating the unconfined compressive strength of intact rocks from Equotip hardness. Bull. Eng. Geol. Environ. 67, 23–29.
- 41) Aoki, H. and Matsukura, Y. (2007) A new technique for non-destructive field measurement of rock-surface strength: an application of the Equotip hardness tester to weathering studies. Earth Surface Processes Landforms 32, 1759–1769.
- 42) Viles, H., Goudie, A., Grab, S. and Lalley, J. (2011) The use of the Schmidt Hammer and Equotip rock hardness assessment in geomorphology and heritage science: a comparative analysis. Earth Surface Processes Landforms 36, 320–333.
- 43) Suzuki, T. and Hachinohe, S. (1995) Weathering rates of bedrock forming marine terraces in Boso Peninsula, Japan. Trans. Japan. Geomorph. Union 16, 93–113.
- 44) Ngan-Tillard, D.J.M., Verwaal, W., Mulder, A., Engin, H.K. and Ulusay, R. (2011) Application of the needle penetration test to a calcarenite, Maastricht, the Netherlands. Eng. Geology 123, 214–224.
- 45) Benumof, B.T. and Griggs, G.B. (1999) The dependence of seacliff erosion rates on cliff material properties and physical processes: San Diego County, California. Shore Beach 67 (4), 29–41.
- 46) Tsujimoto, H. (1987) Dynamic conditions for shore platform initiation. Sci. Rep. Inst. Geosci., University of Tsukuba 8A, 45–93.
- 47) Budetta, P., Galietta, G. and Santo, A. (2000) A methodology for the study of the relation between coastal cliff erosion and the mechanical strength of soil and rock masses. Eng. Geology 56, 243–256.
- 48) Sunamura, T. and Aoki, H. (2011) Application of an S-shaped curve model to the temporal development of tafoni of salt-weathering origin. Earth Surface Processes Landforms 36, 1624–1631.
- 49) Carter, C.H. and Guy, D.E. Jr. (1988) Coastal erosion: processes, timing and magnitudes at the bluff toe. Marine Geology 84, 1–17.
- 50) Bernatchez, P. and Dubois, J.-M.M. (2008) Seasonal quantification of coastal processes and cliff erosion on fine sediment shorelines in a cold temperate climate, north shore of the St. Lawrence maritime estuary, Québec. Jour. Coastal Res. 24, 169–180.
- 51) Johannessen, C.L., Feiereisen, J.J. and Wells, A.N. (1982) Weathering of ocean cliffs by salt expansion in a mid-latitude coastal environment. Shore Beach 50, 26–34.
- 52) Mottershead, D.N. (1989) Rates and patterns of bedrock denudation by coastal salt spray weathering: a seven-year record. Earth Surface Processes Landforms 14, 383–398.
- 53) Takahashi, K., Suzuki, T. and Matsukura, Y. (1994) Erosion rates of sandstone used for a masonry bridge pier in the coastal spray zone. In Rock Weathering and Landform Evolution (eds. Robinson, D.A. and Williams, R.B.G.). Wiley, Chichester, pp. 175–192.
- 54) Lawrence, J.A., Mortimore, R.N., Stone, K.J. and Busby, J.P. (2013) Sea saltwater weakening of chalk and the impact on cliff instability. Geomorphology 191, 14–22.
- 55) Robinson, D.A. and Jerwood, L.C. (1987) Sub-aerial weathering of chalk shore platforms during harsh winters in southeast England. Marine Geology 77, 1–14.
- 56) Jerwood, L.C., Robinson, D.A. and Williams, R.B.G. (1990) Experimental frost and salt weathering of chalk — II. Earth Surface Processes Landforms 15, 699–708.
- 57) Gelinas, P.J. and Quigley, R.M. (1973) The influence of geology on erosion rates along the north shore of Lake Erie. Proc. 16th Conf. Great Lakes Res. 421–430.
- 58) Sunamura, T. (1977) A relationship between wave-induced cliff erosion and erosive force of waves. Jour. Geology 85, 613–618.
- 59) Dick, T.M. and Zeman, A.J. (1983) Coastal processes on soft shores. Proc. Can. Coastal Conf., National Res. Council Canada, 19–35.
- 60) Kamphuis, J.W. (1987) Recession rate of glacial till bluffs. Jour. Waterway Port Coastal Ocean Eng. 113, 60–73.
- 61) Mano, A. and Suzuki, S. (1998) A dimensionless parameter describing sea cliff erosion. Proc. 26th Int. Conf. Coastal Eng., Amer. Soc. Civil Engrs., 2520–2533.
- 62) Walkden, M.J.A. and Hall, J.W. (2005) A predictive mesoscale model of the erosion and profile development of soft rock shores. Coastal Eng. 52, 535–563.
- 63) Walkden, M.J.A. and Hall, J.W. (2011) A mesoscale predictive model of the evolution and management of a soft-rock coast. Jour. Coastal Res. 27, 529–543.
- 64) Trenhaile, A.S. (2009) Modeling the erosion of cohesive clay coasts. Coastal Eng. 56, 59–72.
- 65) Castedo, R., Murphy, W., Lawrence, J. and Paredes, C. (2012) A new process–response coastal recession model of soft rock cliffs. Geomorphology 177–178, 128–143.
- 66) Castedo, R., Fernández, M., Trenhaile, A. and Paredes, C. (2013) Modeling cyclic recession of cohesive clay coasts: Effects of wave erosion and bluff stability. Marine Geology 335, 162–176.
- 67) Castedo, R., DelaVega, R., Fernández, M. and Paredes, C. (2015) Measurements of historical cliff-top changes and estimation of future trends using GIS data between Bridlington and Hornsea–Holderness Coast (UK). Geomorphology 230, 146–160.
- 68) Hackney, C., Darby, S.E. and Leyland, J. (2013) Modelling the response of soft cliffs to climate change: A statistical, process-response model using accumulated excess energy. Geomorphology 187, 108–121.
- 69) Kline, S.W., Adams, P.N. and Limber, P.W. (2014) The unsteady nature of sea cliff retreat due to mechanical abrasion, failure and comminution feedbacks. Geomorphology 219, 53–67.
- 70) Sunamura, T. (1982) A predictive model for wave-induced cliff erosion, with application to Pacific coasts of Japan. Jour. Geology 90, 166–178.
- 71) Sunamura, T., Tsujimoto, H. and Aoki, H. (2014) The rock coast of Japan. In Rock Coast Geomorphology: A Global Synthesis (eds. Kennedy, D.M., Stephenson, W.J. and Naylor, L.A.). Geol. Soc. Memoir 40, Geological Society, London, pp. 203–223.
- 72) Sunamura, T. (1991) The elevation of shore platforms: a laboratory approach to the unsolved problem. Jour. Geology 99, 761–766.
- 73) Sunamura, T. (1987) Coastal cliff erosion in Nii-Jima Island, Japan: present, past, and future — an application of mathematical model —. In International Geomorphology 1986 Part I (ed. Gardiner, V.). Wiley, Chichester, pp. 1199–1212.
- 74) Schwimmer, R.A. (2001) Rates and processes of marsh shoreline erosion in Rehoboth Bay, Delaware, U.S.A. Jour. Coastal Res. 17, 672–683.
- 75) Komar, P.D. and Shih, S.-M. (1993) Cliff erosion along the Oregon coast: A tectonic-sea level imprint plus local controls by beach processes. Jour. Coastal Res. 9, 746–765.
- 76) Komar, P.D. and Enfield, D.B. (1987) Short-term sea-level changes and coastal erosion. In Sea-level Fluctuations and Coastal Evolution (eds. Nummedal, D., Pilkey, O.H. and Howard, J.D.). Spec. Publ. 41, Soc. Econ. Paleont. Mineral., Tulsa, Oklahoma, pp. 16–27.
- 77) Flick, R.E. and Cayan, D.R. (1985) Extreme sea levels on the coast of California. Proc. 19th Int. Conf. Coastal Eng., Amer. Soc. Civil Engrs., 886–898.
- 78) Komar, P.D. (1986) The 1982–83 El Niño and erosion on the coast of Oregon. Shore Beach 54, 3–12.
- 79) Flick, R.E. (1998) Comparison of California tides, storm surges, and mean sea level during the El Niño winters of 1982–83 and 1996–98. Shore Beach 66, 6–11.
- 80) Hapke, C. and Richmond, B. (2002) The impact of climatic and seismic events on the short-term evolution of seacliffs based on 3-D mapping: northern Monterey Bay, California. Marine Geology 187, 259–278.
- 81) Storlazzi, C.D., Willis, C.M. and Griggs, G.B. (2000) Comparative impacts of the 1982–83 and 1997–98 El Niño winters on the Central California coast. Jour. Coastal Research 16, 1022–1036.
- 82) Allan, J.C. and Komar, P.D. (2006) Climate controls on US West Coast erosion processes. Jour. Coastal Res. 22, 511–529.
- 83) Williams, W.W. (1960) Coastal Changes. Routledge and Kegan Paul, London.
- 84) Everts, C.H. (1991) Seacliff retreat and coarse sediment yields in southern California. Proc. Coastal Sediments '91, Amer. Soc. Civil Engs., 1586–1598.
- 85) Sallenger, A.H., Krabill, W., Brock, J., Swift, R., Manizade, S. and Stockdon, H. (2002) Sea-cliff erosion as a function of beach changes and extreme wave runup during the 1997–1998 El Niño. Marine Geology 187, 279–297.
- 86) Lajoie, K.R. and Mathieson, S.A. (1985) San Francisco to Año Nuevo. In Living with California Coast (eds. Griggs, G. and Savoy, L.). Duke University Press, Durham, North Carolina, pp. 140–177.
- 87) Shih, S.-M. and Komar, P.D. (1994) Sediments, beach morphology and sea cliff erosion within an Oregon coast littoral cell. Jour. Coastal Res. 10, 144–157.
- 88) Lee, E.M. (2008) Coastal cliff behaviour: Observations on the relationship between beach levels and recession rates. Geomorphology 101, 558–571.
- 89) Carter, C.H., Monroe, C.B. and Guy, D.E. Jr. (1986) Lake Erie shore erosion: the effect of beach width and shore protection structures. Jour. Coastal Res. 2, 17–23.
- 90) Amin, S.M.N. and Davidson-Arnott, R.G.D. (1995) Toe erosion of glacial till bluffs: Lake Erie south shore. Can. Jour. Earth Science 32, 829–837.
- 91) Amin, S.M.N. (2001) Bluff response in glacial till: south shore of Lake Erie. The Great Lakes Geographer 8, 78–86.
- 92) Fuller, J.A. (1996) Distribution of surficial sediments in Ohio’s nearshore (Lake Erie) as interpreted from sidescan sonar and 3.5 kHz subbottom data. U.S. Geological Survey, Open File Report 96-520.
- 93) Sunamura, T. (1985) A simple relationship for predicting wave height in the surf zone with a uniformly sloping beach. Trans. Japan. Geomorph. Union 6, 361–364.
- 94) Smith, J.M. (2003) Surf zone hydrodynamics. In Coastal Engineering Manual (ed. Coastal and Hydraulic Laboratory). U.S. Army Corps of Engineers, Vicksburg, Mississippi, pp. II-4-1–II-4-40.
- 95) Philpott, K.L. (1984) Comparison of cohesive coasts and beach coasts. Proc. Coastal Eng. Canada, 309–338.
- 96) Hutchinson, J.N. (1986) Cliffs and shores in cohesive materials: geotechnical and engineering geological aspects. Proc. Symp. Cohesive Shores, National Res. Council Canada, 1–44.
- 97) Coakley, J.P., Rukavina, N.A. and Zeman, A. (1986) Wave-induced subaqueous erosion of cohesive tills: preliminary results. Proc. Symp. Cohesive Shores, National Res. Council, Canada, 120–136.
- 98) Davidson-Arnott, R.G.D. (1986) Rates of erosion of till in the nearshore zone. Earth Surface Processes Landforms 11, 53–58.
- 99) Davidson-Arnott, R.G.D. and Ollerhead, J. (1995) Nearshore erosion on a cohesive shoreline. Marine Geology 122, 349–365.
- 100) Sunamura, T. (2002) A study on the elevation of shore platforms initiated by broken waves: analysis of wave-basin experiment data. Trans. Japan. Geomorph. Union 23, 387–394.
- 101) Moses, C.A. (2014) The rock coast of the British Isles: shore platforms. In Rock Coast Geomorphology: A Global Synthesis (eds. Kennedy, D.M., Stephenson, W.J. and Naylor, L.A.). Geol. Soc. Memoir 40, Geological Society, London, pp. 39–56.
- 102) Moses, C.A. and Robinson, D. (2011) Chalk coast dynamics: Implications for understanding rock coast evolution. Earth-Science Reviews 109, 63–73.
- 103) Andrews, C. and Williams, R.B.G. (2000) Limpet erosion of chalk shore platforms in southeast England. Earth Surface Processes and Landforms 25, 1371–1381.
- 104) Ellis, N. (1986) Morphology, process and rates of denudation on the chalk shore platforms of East Sussex. Ph.D. Thesis, Brighton Polytechnic. (cited in Moses and Robinson102)).
- 105) Andrews, C. (2000) The measurement of the erosion of the Chalk shore platform of East Sussex, the effect of coastal defense structures and the efficacy of macro-scale bioeroders, particularly the Common Limpet, Patella vulgate. Ph.D. Thesis, University of Sussex. (cited in Moses and Robinson102)).
- 106) Foote, Y., Plessis, E., Robinson, D.A., Hénaff, A. and Costa, S. (2006) Rates and patterns of downwearing of chalk shore platforms of the Channel: comparisons between France and England. Zeit. Geomorphologie N. F. Suppl. 144, 93–115.
- 107) Swantesson, J.O.H., Moses, C.A., Berg, G.E. and Jansson, K.M. (2006) Methods for measuring shore platform micro erosion: A comparison of the micro-erosion meter and laser scanner. Zeit. Geomorphologie N. F. Suppl. 144, 1–17.
- 108) Dornbusch, U. and Robinson, D.A. (2011) Block removal and step backwearing as erosion processes on rock shore platforms: a preliminary case study of the chalk platforms of south-east England. Earth Surface Processes Landforms 36, 661–671.
- 109) Robinson, A.H.W. (1980) Erosion and accretion along part of the Suffolk coast of East Anglia, England. Marine Geology 37, 133–146.
- 110) Davidson-Arnott, R.G.D. and Langhan, D.R.L. (2000) The effects of softening on nearshore erosion of a cohesive shoreline. Marine Geology 166, 145–162.
- 111) Lageat, Y., Hénaff, A. and Costa, S. (2006) The retreat of the chalk cliffs of the Pays de Caux (France): erosion processes and patterns. Zeit. Geomorphologie N. F. Suppl. 144, 183–197.
- 112) Sayer, W.O. and Komar, P.D. (1988) The Jump-Off Joe landslide at Newport, Oregon: history of erosion, development and destruction. Shore Beach 56, 15–22.
- 113) Komar, P.D. (2004) Oregon’s coastal cliffs: processes and erosion impacts. In Formation, Evolution, and Stability of Coastal Cliffs–Status and Trends (eds. Hampton, M.A. and Griggs, G.B.). U.S. Geological Survey Professional Paper 1693, U.S. Government Printing Office, Washington, D.C., pp. 65–80.
- 114) Griggs, G., Patsch, K. and Savoy, L. (2005) Living with the Changing California Coast. University of California Press, Berkley.
- 115) Duperret, A., Genter, A., Martinez, A. and Mortimore, R.N. (2004) Coastal chalk cliff instability in NW France: role of lithology, fracture pattern and rainfall. In Coastal Chalk Cliff Instability (eds. Mortimore, R.N. and Duperret, A.). Eng. Geology Spec. Publ. 20, Geological Society, London, pp. 33–55.
- 116) Hutchinson, J.N. (1972) Field and laboratory studies of a fall in Upper Chalk cliffs at Joss Bay, Isle of Thanet. In Stress-Strain Behaviour of Soils (ed. Parry, R.H.G.). G. T. Foulis, Henley-on-Thames, Oxfordshire, pp. 692–706.
- 117) Young, A.P. and Ashford, S.A. (2008) Instability investigation of cantilevered seacliffs. Earth Surface Processes Landforms 33, 1661–1677.
- 118) Williams, A.T., Davies, P. and Bomboe, P. (1993) Geometrical simulation studies of coastal cliff failures in Liassic strata, south Wales, U.K. Earth Surface Processes Landforms 18, 703–720.
- 119) Davies, P., Williams, A.T. and Bomboe, P. (1998) Numerical analysis of coastal cliff failure along the Pembrokeshire Coast National Park, Wales, UK. Earth Surface Processes Landforms 23, 1123–1134.
- 120) Kumar, A., Seralathan, P. and Jayappa, K.S. (2009) Distribution of coastal cliffs in Kerala, India: their mechanisms of failure and related human engineering response. Environ. Geology 58, 815–832.
- 121) Santos, O.F. Jr., Scudelari, A.C., Costa, Y.D. and Costa, C.M. (2011) Sea cliff retreat mechanisms in northeastern Brazil. Jour. Coastal Res. SI64, 820–824.
- 122) Hutchinson, J.N. (2002) Chalk flows from the coastal cliffs of northwest Europe. Reviews Eng. Geology 15, 257–302.
- 123) Grainger, P. and Kalaugher, P.G. (1987) Intermittent surging movements of a coastal landslide. Earth Surface Processes Landforms 12, 596–603.
- 124) Bryan, R.B. and Price, A.G. (1980) Recession of the Scarborough bluffs, Ontario, Canada. Zeit. Geomorphologie N.F. Suppl. 34, 48–62.
- 125) McGreal, W.S. (1979) Factors promoting coastal slope instability in southeast County Down, N. Ireland. Zeit. Geomorphologie N. F. 23, 76–90.
- 126) Middlemiss, F.A. (1983) Instability of chalk cliffs between the South Foreland and Kingstone, Kent, in relation to geological structure. Proc. Geologists’ Assoc. 94, 115–122.
- 127) Styles, T.D., Coggan, J.S. and Pine, R.J. (2011) Back analysis of the Joss Bay chalk cliff failure using numerical modelling. Eng. Geology 120, 81–90.
- 128) Quinn, J.D., Rosser, N.J., Murphy, W. and Lawrence, J.A. (2010) Identifying the behavioural characteristics of clay cliffs using intensive monitoring and geotechnical numerical modelling. Geomorphology 120, 107–122.
- 129) Edil, T.B. and Haas, B.T. (1980) Proposed criteria for interpreting stability of lakeshore bluffs. Eng. Geology 16, 97–110.
- 130) Quigley, R.M., Gelinas, P.J., Bou, W.T. and Packer, R.W. (1977) Cyclic erosion-instability relationships: Lake Erie northshore bluffs. Canadian Geotechnical Journal 14, 310–323.
- 131) Edil, T.B. and Vallejo, L.E. (1980) Mechanics of coastal landslides and the influence of slope parameters. Eng. Geology 16, 83–96.
- 132) Hutchinson, J.N. (1973) The response of London Clay cliffs to differing rates of toe erosion. Geologia Applicata Idrogeologia 8, 221–239.
- 133) Lahousse, P. and Pierre, G. (2003) The retreat of chalk cliffs at Cape Blanc-Nez (France): Autopsy of an erosion crisis. Jour. Coastal Res. 19, 431–440.
- 134) Kuhn, D. and Prüfer, S. (2014) Coastal cliff monitoring and analysis of mass wasting processes with the application of terrestrial laser scanning: A case study of Rügen, Germany. Geomorphology 213, 153–165.
- 135) Bird, E.C.F. and Rosengren, N.J. (1986) Changes in cliff morphology at Black Rock Point 1973–1986. Victoria Naturalist 103, 106–113.
- 136) Duperret, A., Genter, A., Mortimore, R.N., Delacourt, B. and De Pomerai, M.R. (2002) Coastal rock cliff erosion by collapse at Puys, France: the role of impervious marl seams within chalk of NW Europe. Jour. Coastal Res. 18, 52–61.
- 137) Pierre, G. and Lahousse, P. (2006) The role of groundwater in cliff instability: an example at Cape Blanc-Nez (Pas-de-Calais, France). Earth Surface Processes Landforms 31, 31–45.
- 138) Bucker, W.R. and Winters, H.A. (1983) Lake Michigan bluff recession. Ann. Assoc. Amer. Geographers 73, 89–110.
- 139) McGreal, W.S. and Craig, D. (1977) Mass-movement activity: An illustration of differing responses to groundwater conditions from two sites in northern Ireland. Irish Geography 10, 28–35.
- 140) Allison, R.J. and Brunsden, D. (1990) Some mudslide movement patterns. Earth Surface Processes Landforms 15, 296–311.
- 141) Bird, E.C.F. (1994) Cliff hazards and coastal management. Jour. Coastal Res. Special Issue 12, 299–309.
- 142) Anon (1994) The Scarborough landslide. Quart. Jour. Eng. Geology 27, 3–6.
- 143) Hénaff, A., Lageat, Y. and Costa, S. (2006) Geomorphology and shaping processes of chalk shore platforms of the Channel coasts. Zeit. Geomorphologie N. F. Suppl. 144, 1–17.

