Abstract
Single-molecule atomic-resolution real-time electron microscopic movie imaging is an emerging new tool for obtaining dynamic structural information on molecules and molecular assemblies. This method provides a hitherto inaccessible possibility to in situ observe the time evolution of chemical events at various temperatures from the beginning till the end, as demonstrated for the kinetics study of [2 + 2] cycloaddition of [60]fullerene molecules, which was found to occur via an excited state or via radical cation depending on the temperature. One unique feature of this methodology is that, by observing directly the reaction events, one can obtain information on the frequency of events unperturbed by molecular diffusion. With the obtained experimental data set, we provided the first experimental proof of what the quantum mechanical transition state theory predicted, in that isolated molecules behave as if all their accessible states were occupied in a random order. We also found that, under the 1-D reaction conditions, molecular-level information on a few hundred molecules suffices to deduce statistically meaningful kinetics data that match with those obtained by bulk experiments.
Communicated by Kenji MORI, M.J.A.
Abbreviations: CCD: charge coupled device; CNT: carbon nanotube; EDR: electron dose rate; PEF: pre-exponential factor; RRKM: Rice–Ramsperger–Kassel–Marcus; SMART-EM: single-molecule atomic-resolution real-time electron microscopy; TED: total electron dose; TEM: transmission electron microscopy; VT: variable-temperature..
1. Introduction
Visual observation of molecular reactions and motions at an atomistic level has been an inconceivable dream for scientists for a long time. Enabled by transmission electron microscopy (TEM), we showed atomic-resolution movies of the conformational change of hydrocarbon molecules for the first time in 2007, which marked an indication of the feasibility of fulfilling this dream.1) A recent paper from our laboratory in 2017 based on the second stage of the study of reaction kinetics by direct visual observation of individual reaction events is one step closer towards visual observation of molecular reactions.2)
Ever since the law of mass action was proposed by Peter Waage and Cato M. Guldberg in 1864,3) the classical transition state theory of chemical kinetics, which provides information on rates of chemical processes, reaction mechanisms and transition states, has relied exclusively on macroscopic data averaged over molecules and time. Here, a student may naively imagine that a molecule climbs up a hill along the potential surface of the reaction to a transition state and then goes down to the product as if it were a traveler traveling over a mountain pass (Fig. 1a). However, this classical transition state theory represents the behavior of an “average” of numerous molecules in the bulk, but not of individual molecules that behave as a quantum mechanical entity. Thus, a quantum mechanical transition state theory was formulated to account for the elementary reaction of a single molecule in which individual molecules behave as if all their accessible states are occupied in a random order (Fig. 1b).4),5) In this context, the computational reaction pathways that we often see in the literature (Fig. 2)6) represent an “average” molecule and is far from the reality of individual molecules because there is no “average” molecule as such in the same sense as there are no average Japanese people.


Chemists usually assume that the data obtained when many single probabilistic reaction events are averaged over molecules and time should agree with the data obtained by the classical statistical methods. However, this statement has not been experimentally proved due to the lack of experimental methods that can observe reaction events from the beginning till the end (Fig. 3). In addition, there is also a lack of methods to analyze the data statistically over molecules, time and temperature so as to perform kinetic analysis of the reaction. Chemical processes in large biomolecules as studied at a single molecule level (but not at an atomistic level) using fluorescence7) and force spectroscopy8) involve many concurrent chemical processes (e.g., multiple hydrogen bond cleavage). Hence, such studies do not provide any information on the rate of individual reactions or their temperature dependence necessary to discuss the transition states of the individual reactions involved.

The single-molecule atomic-resolution real-time electron microscopy (SMART-EM) movie imaging is unique for its ability to record visual images of the time evolution of individual reaction events occurring in a 1-D test tube of a single-walled carbon nanotube (CNT) from the beginning to the end. This method can also perform statistical analysis over several hundred molecules. From the movies, the following can be determined: product structures, reaction rates at various temperatures, kinetic parameters and the involved mechanisms. In our report in 2017,2) we demonstrated the feasibility of performing kinetic analysis with the SMART-EM method for a [2 + 2] dimerization reaction of [60]fullerene molecules, which was found to take place via an excited state under electron irradiation. Many studies9) identified this reaction two decades ago, but none of them attempted kinetic analysis; hence, its mechanism remains unknown. Therefore, the systematic variable-temperature (VT) SMART-EM study of this reaction was an exciting challenge. In this study, we first found that the reaction events occur randomly. We also observed that the integrated frequency of the reaction events over a few tens of molecules follow the first-order kinetic profile. Moreover, the VT experiments provided kinetic data, from which we obtained mechanistic insights that previously could not be obtained using conventional experimental methods. This review summarizes the background, results and implications on the utility of VT-SMART-EM imaging for the chemical kinetics studies.
2. SMART-EM movie imaging for organic chemistry
TEM is an electron variant of the transmitted light microscope in that it utilizes electrons and magnetic lenses in a vacuum instead of photons and glass lenses in optical microscopy. Unlike the optical counterpart, however, TEM imaging is an interference image produced by the interaction of electrons and atoms as in the famous double-slit experiment (Fig. 4a).10) Interestingly, TEM produces the image of the object only when it is slightly out of focus, i.e., no image is given when defocus is zero (at the Gaussian focus). It is also important to note that, in our molecular imaging studies below, it only suffices to consider that electrons interact with the specimen molecules exclusively as a wave and not as particles except when they hit the detector where each electron is recorded as a dot. No momentum of the incident electron was transferred to the single molecule when passing nearby the molecule, which was supported by the experimental fact that no molecule was blown away to the direction of the injection of an electron.11)

At 120-kV acceleration conditions that we routinely used (de Broglie wavelength of 3.35 pm at 120-kV acceleration; cf. C–C bonds, 125–156 pm), we shot about 1 × 10⁵ electrons per second·nm2, which travel at 59% of the speed of light passing through a molecule of, for example, 1-nm thickness within an attosecond and arrive at a pixel detector where electrons are detected as particles (Fig. 4a). It is an enigma of quantum mechanics that an electron behaves as a wave when it flies near single atoms but as a particle when it hits a mass of atoms (e.g., detector or solid specimen, Fig. 4b).
While each electron has attosecond-level information on the molecule, the speed of the camera is the current limitation of the time resolution of TEM imaging. The fastest camera available now utilizes a complementary metal oxide semiconductor detector that has only a sub-millisecond frame rate. This type of detector captures electrons continuously and is essential for following the reaction course as we do in this study. The conventional charge coupled device (CCD) detector is unsuitable for the kinetic studies because it works intermittently due to necessary data retrieval time (typically 1 s).
An enormous potential of SMART-EM movies in chemistry research has long been neglected by the electron microscopic community, probably because electron microscope has long been used primarily to capture still images of the immobile specimens. As soon as we (E.N.) started to work on molecular imaging in the beginning of the 2000s with Sumio Iijima,12) E.N. perceived that such movies provide a truly unique opportunity to follow in situ the structural changes of molecules and molecular assemblies. However, a big question was how to bring sub-nm sized specimen molecules into the nm-sized view field of TEM. Thus, we established “eel trap” and “fish hook” strategies that enabled our dream to study the motions and reactions of individual organic molecules in a vacuum column of a TEM (Fig. 5). CNTs of 1- to 2-nm in diameter were found to be suitable supporting materials either as the eel trap or as the fishing rod for its robustness of the monoatomic layer wall, and for the possibility of chemical modifications of the outer wall to install fish hooks.

3. Real-time movie imaging of conformational changes of hydrocarbon chains
Figure 6 shows the frames of the first molecular movie of the conformational changes of an organic molecule ever reported in the literature. This movie, which we reported in 2007, is a real-time movie of the motion of a carborane having two C22H45 chains confined in a CNT recorded over a 43 s period. It was recorded on a one-generation older CCD detector with each frame taken at an interval of 2.1 s, i.e., 0.5 s irradiation time and 1.6 s blinking time for data retrieval. In this “eel trap” experiment, one tail of the C22H45 chains was trapped in an invisible hole in the wall of the CNT, and the whole molecule wobbled during observation. The movie consists of a series of static and blurred images of both the head and the tails, suggesting that the C–C bonds rotate like a ratchet in a probabilistic way (Fig. 7).


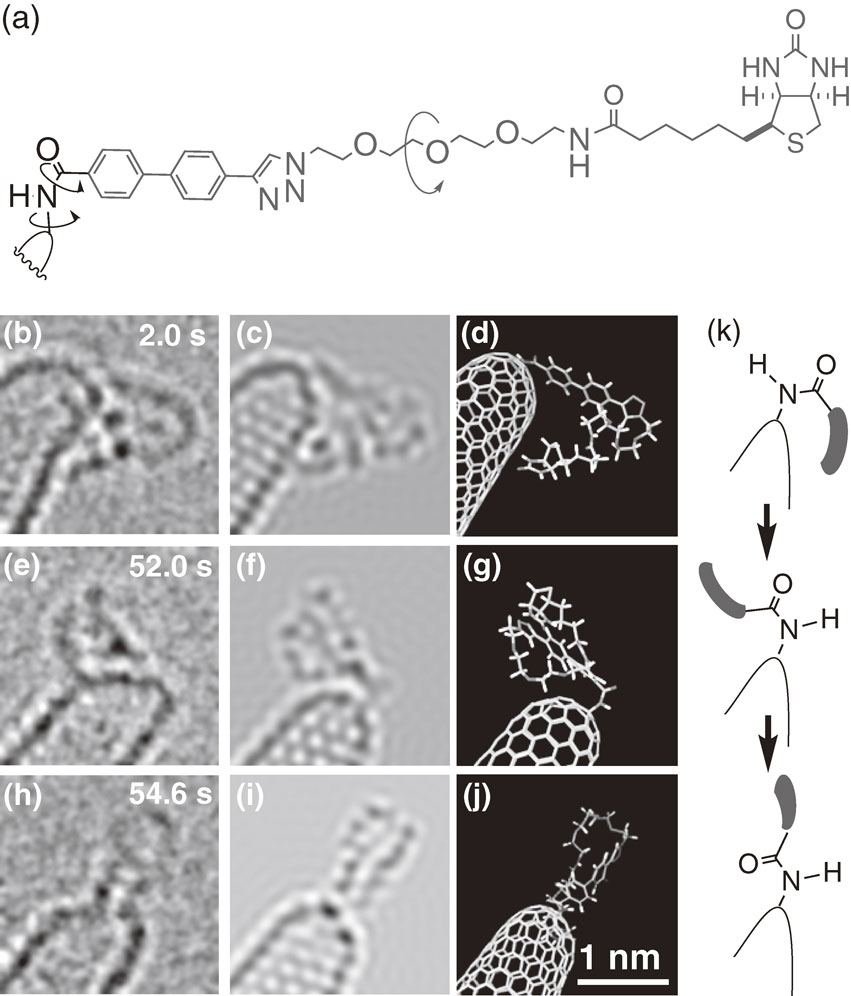
When we connect a molecule by a C–N bond to the surface of a CNT by the fish hook method, the molecule rotates spontaneously in a vacuum. This motion allowed us to observe the molecule from various directions and then accurately assign the molecular structure by comparing with model structures generated by molecular dynamics calculations. Figure 8 illustrates an example of a biotin-containing molecule.13) The molecular images are much less clear than those of the CNT, where we can identify carbon atoms, because of rapid motion and the slow CCD detector. We ascribe the two major conformational changes just before 52.6 s and between 52.6 s and 54.6 s to the rotation of the saturated C–N bond and the N–C(=O) bond, respectively.
What difference could there be between the SMART-EM and the cryo-EM technology honored by the 2017 Nobel Prize? The former method intends to record the behavior of individual molecules and assemblies over time, space and various temperatures. Our method differs entirely from the latter that provides information averaged over numerous static molecules immobilized in vitrified ice at low temperature — a quality of information similar to that obtained by crystallographic analysis (Fig. 9).14)
4. In situ monitoring of individual reaction events
Several years after our first report, E.N. started to ponder on the scope and limitations of the SMART-EM technology.1),11),15) He decided to take one step forward to challenge his dream of studying reaction kinetics through visual analysis of individual reaction events by counting on the chemical physics expertise of Prof. Kaoru Yamanouchi, a colleague in our Department. For this investigation, we need to gather statistical information from the beginning of the reaction till the end at various temperatures — information that has so far been inaccessible or thought to be inaccessible by other single-molecule analytical methods,16),17) including cryo-EM studies.18) Our fundamental question was whether individual reaction events conform to the basic assumption of the quantum mechanical transition state theory. The theory assumes that isolated molecules behave as if all their accessible states were occupied in a random order, as stated by the Rice–Ramsperger–Kassel–Marcus (RRKM) theory (Fig. 1).4),5) To answer this question, we chose to study a 1-D reaction system where a [2 + 2] electrocyclic conversion of a van der Waals complex of C60 1 to an adduct 2 using a CNT as a test tube, a thermal bath and a reaction mediator (step 1, Fig. 10a and b) through counting reaction events one by one.19)

The cycloaddition reaction studied here was seen with electron microscopy over a decade ago;20) yet, the product structure was unknown, and no mechanistic study has been reported. It is a thermally forbidden reaction that mandates electron (or photo) irradiation. There are only two possible structures for the dimer — a highly symmetrical D2h dimer and a less symmetrical Cs isomer shown in Fig. 10c. In 2010, we assigned Cs symmetry to the product formed under TEM observation as deduced from its unsymmetrical image as to the center of the molecule.21) The D2h dimer was previously synthesized with a cyanide anion-catalyzed solid-state reaction.22) We also assigned structures to the products of further fusion, as shown in Fig. 10d.
Our next concern was the number of molecules required to be studied to obtain statistically meaningful information for comparison with the bulk experiments. This was a big issue for us because of persistent criticisms by reviewers of our publications who demanded us to study thousands of molecules. In this kinetic study, we found that we need only 25–50 molecules at each temperature to analyze the reaction rate with <10% error and several hundred molecules in total over a 100-K temperature range to obtain kinetic data comparable to those obtained in bulk experiments. With hindsight, the requirement of a rather small number of specimen molecules in such a 1-D system is reasonable. Statistically speaking, a few hundred molecules are enough to estimate the behavior of millions of molecules with several percent precision, and the behavior of a million molecules would be similar to that of an Avogadro number of molecules.
To prepare C60-containing CNTs, we first removed the terminal caps of CNTs oxidatively with hot air and heated them together with C60 powder under a pressure of 50 Pa at temperatures up to 803 K.2) We then dropped a 10-µL solution of the dispersion on a copper sample grid covered with ca. 70-nm thick perforated carbon film placed on a paper that absorbs excess toluene. Figure 11 illustrates the size progression from a microscope, a sample grid, perforated carbon on the grid, CNTs and to a substituted C60 molecule.

Figure 12 illustrates four frames of the movie of the [2 + 2] cycloaddition reaction at 443 K 8 s to 402 s after starting the TEM observation. With a constant electron dose of 3.1 × 10⁵ e− nm−2 s−1 used for the experiment, the total electron dose (TED) in parentheses increases proportionately to the increase in observation time. The dimer 2 (step 1H) is formed first, followed by conversion (step 2) to fused dimer 3 and then oligomers (molecules 6–14 at 402 s). The latter processes involve extensive bond reorganization caused by the further release of the structural strain of C60. Thus, 17 molecules produced one dimer out of molecules 5 and 6 (6.3% conversion) after 8 s, and five dimers (31%) after 126 s. Interestingly, the 5–6 dimer (2) underwent cycloreversion to generate an intact C60 molecule at 402 s. In each experiment in Fig. 13c, we studied 25–70 molecules in several CNTs concurrently for 5–10 min. The highly thermally conductive CNT23) functions as a thermal bath, and we observed no statistically significant rate difference among the molecules in different CNTs.


This movie illustrates unique features of the kinetic study enabled by SMART-EM, which has not been possible by any other method. First, we can carry out real-time investigation of the time evolution of structural changes, including atomistic structural determination of products. In addition, we observed four different types of reactions simultaneously: van der Waals dimer formation (i.e., 1), forward and reverse [2 + 2] cycloaddition (2) and fusion (3), and we obtained kinetic data for the forward cycloaddition and the fusion. It is noteworthy that, with the movie images recorded, we can study the reactions in both forward and backward directions to precisely analyze the bond-forming reactions and the equilibrium processes preceding the bond formation.
5. Kinetic analysis of C60 dimerization
Figure 13a illustrates a typical course of step 1H over TED or time in seconds at 443 K. The dimerization events occurred randomly zero to five times every five seconds at various locations in several CNTs. From these data, we calculated an average interval of reaction events to be 58 s, i.e., only one cycloaddition event takes place upon the passage of 7.1 × 10⁶ electrons/min near one C60 molecule. At this electron dose, which is commonly used by electron microscopists, one electron passes near one C60 molecule at an interval of 8.1 µs — an interval vastly longer than the time scale for electron excitation and chemical reactions (e.g., picosecond).
Here, we were delighted to note that, despite apparent randomness of the reaction events, the reaction progress (1 − P, where P is the conversion of C60 normalized to one) plotted against TED shows a first-order decay (Fig. 13b). This is confirmed by the black line in a semilogarithmic plot (Fig. 13c), which showed first-order decay up to 50% conversion. The seemingly random events indeed conform to what theory predicts.4),5)
Figure 13c summarizes the semilogarithmic plots for step 1H over 393–493 K under 120 kV and EDR of 3.1 × 10⁵ e− nm−2 s−1. Figure 13d shows the rate constants obtained against TED for this temperature range. From the Arrhenius plot for the 393–493 K data (Fig. 14a, black line, and Fig. 14b), we determined the activation energy of step 1H to be 33.5 ± 6.8 kJ/mol and the pre-exponential factor (PEF) to be 3.9 × 10⁻⁴ (e−)−1 nm2.
The Arrhenius plot of step 2 gave us a smaller activation energy of 23 ± 17 kJ/mol (Fig. 14a, red line, and Fig. 14b). However, it occurred much less frequently than step 1H as shown by a much smaller PEF of 7.1 × 10⁻⁶ (e−)−1 nm2 (Fig. 14a, black line). The error here is admittedly very large because step 2 occurs sequentially after step 1H.
Upon analysis of a wider temperature range, we found that the CNT loses structural integrity at 103–203 K and that the dimerization events in such decomposed CNTs show an entirely different profile with an activation energy as small as 1.9 ± 0.7 kJ/mol and a PEF as small as 1.4 × 10⁻⁷ (e−)−1 nm2 (Fig. 14a, blue line, and Fig. 14b). The PEF value is 1/2800 of the one found for step 1H. We denote this reaction as step 1L.
The data summarized in Fig. 14b indicate that the activation energy and the PEF of the three reactions somehow compensate each other and account for the experimental observation that the apparent rates are not too different from each other. In these experiments, where we studied the conversion of the van der Waals dimer 1 to 2, the PEF values largely reflect the frequency of excitation, probably a little of steric factor (note the Ih symmetry of C60), and none of the frequency of collision, which is a dominant contributor in kinetics in the solution or gas phases.
Temperature–rate correlation is summarized in Fig. 14c. At temperatures higher than 500 K, the apparent rate of the dimerization at 543 K and 643 K slowed down because of visually observed, competitive thermal cycloreversion (2 to 1).19) Two data points of this process are shown in Fig. 14c (purple line).
Through comparison of the activation energy among step 1H (33.5 ± 6.8 kJ/mol), step 1L (1.9 ± 0.7 kJ/mol) and a reported photodimerization of crystalline C60 ascribed to the triplet state (23 kJ/mol),19) we concluded that step 1H took place via a singlet excited state and that step 1L via a radical cation. The 2800 times larger PEF of step 1H compared to step 1L fits with this conclusion because the former is a vertical S0-to-S1 transition process while the latter involves one-electron oxidation, which causes extensive C–C bond stretching of the whole fullerene skeleton.
Figure 15 illustrates schematically the chemistry involved in the fullerene [2 + 2] dimerization. Here, we assume that CNT acts as a mediator to convert the energy of an electron beam to chemical energy to cause reactions either via singlet excitation or via radical cation formation. Elucidation of any details of such a mechanism needs further studies.
6. Conclusion
“Organic molecules are unstable under electron microscopic observation.”11) We have shown experimentally that this accepted wisdom of the community applies to organic solid and crystals but not to single organic molecules and their assemblies in a vacuum. For example, single molecules in the vacuum of perfluoroalkane, hydrocarbon, amide, urethane, sulfide, ether, aromatic compounds and van der Waals molecular clusters are stable up to a total dose of ca. 5 × 10⁷ electrons/nm2 at 120 kV under our SMART-EM conditions, while these molecules in the solid state decompose under 104 times less electron dose.24) Retrospectively, the observed stability of small organic molecules is entirely reasonable. Before the development of laser technology, physical chemists used an electron beam to excite vibrational states of organic molecules, taking advantage of the very small cross-section of ionization.25)
Chemical reactions of organic molecules and nanocarbon materials studied under electron microscopic observations have often been interpreted as a result of “knock-on” damage (loss of atoms by direct kinetic energy transfer from fast electrons). The knock-on damage is temperature independent by definition, but the reactions described in this review showed well-defined temperature dependence. Hence, the chemistry reported above can be reasonably accounted for by the standard chemistry framework of excited state formation and ionization without invoking knock-on damage.
The most fundamental aspect of the results presented above is that the seemingly random reaction events follow the rule of the quantum mechanical transition state theory, and a few hundred specimen molecules are sufficient to obtain kinetic data that match well with bulk data. The observations, therefore, suggest that the SMART-EM methodology can be applied to the study of chemical reactions, either thermal or excited state reactions, well beyond the fullerene reactions described above. We also found that the CNT container acts as both a test tube and a reaction mediator and allows us to study reaction mechanisms unperturbed by molecular diffusion. The success of the present kinetic study rests crucially on the capability of the SMART-EM technology to handle a mixture of molecules (e.g., 1, 2 and 3) — the potential of the method can be further explored in various other fields of chemical analysis in the fields of chemistry,26) catalysis,27) materials28) and biological science.13),29) Finally, we believe that “seeing is believing” would become a new key word for chemistry research and education in the not-too-distant future.
Acknowledgments
We appreciate the immense contributions of Dr. Satoshi Okada, Satori Kowashi and Prof. Kaoru Yamanouchi, without whom this research would never have come true. We thank, for generous support, the Japan Agency for Science and Technology (Molecular Technology CREST program to E.N. and SEN-TAN to K.H.), MEXT (Nanotechnology Platform; project No. 12024046) and JEOL Co.
Profile

Prof. Eiichi Nakamura was born in 1951 in Tokyo. He obtained his Ph.D. in chemistry from the Tokyo Institute of Technology. After postdoctoral work at the Columbia University, he was appointed as Assistant Professor (1980), Associate Professor (1984) and Professor (1993) before he moved to The University of Tokyo (1995) as Professor of Physical Organic Chemistry. He is currently the Molecular Technology Innovation Endowed Chair Professor. He is a Member of the Science Council of Japan (2014–2020), Elected Fellow of the American Association for the Advancement of Science (1998), and Honorary Foreign Member of the American Academy of Arts and Sciences (2008), Associate Editor of J. Am. Chem. Soc. (2009–), and President of Pacifichem Inc. (2018–). He is an Honorary Professor at Xi’an Jiaotong University (2011), East China University of Science and Technology (2017), and Tianjin University (2018).
Nakamura has worked in diverse fields of synthetic and physical organic chemistry with a focus on mechanism and molecular functions and has initiated the SMART-EM study in his ERATO project in 2004. He is a recipient of The Japan IBM Science Prize (1993), The Chemical Society of Japan Award (2003), Humboldt Research Award (2006), The Medal of Honor with Purple Ribbon (2009), The Arthur C. Cope Scholar Award of ACS (2010), The Fujihara Award (2014), and Centenary Prize of the Royal Society of Chemistry (2014). He has given over 30 special lectures worldwide including inaugural R. C. Fuson Visiting Professorship, University of Illinois (1990), Syntex Distinguished Lecture (Colorado State University, 1996), Gilbert Stork Lecture (Columbia University, 2006), William Dauben Memorial Lecture (UC Berkeley, 2006), H. C. Brown Lecture (Purdue University, 2008), W. S. Johnson Lecture (Stanford University, 2008), Einstein Professorship, (Chinese Academy of Sciences, 2011), George Büchi Lecture (MIT, 2017), Siegfried Hünig Lecture (Ludwig-Maximillian University Würzburg, 2017), and two Gilbert Stork Lectures in 2018 (University of Pennsylvania, and University of Wisconsin).
References
- 1) Koshino, M., Tanaka, T., Solin, N., Suenaga, K., Isobe, H. and Nakamura, E. (2007) Imaging of single organic molecules in motion. Science 316, 853.
- 2) Okada, S., Kowashi, S., Schweighauser, L., Yamanouchi, K., Harano, K. and Nakamura, E. (2017) Direct microscopic analysis of individual C60 dimerization events: Kinetics and mechanisms. J. Am. Chem. Soc. 139, 18281–18287.
- 3) Waage, P. and Guldberg, C.M. (1864) Studier i affiniteten. Forhandelinger: Videnskabs-Selskabet i Christiana, 35–40.
- 4) Bunker, D.L. and Hase, W.L. (1973) On non-RRKM unimolecular kinetics: Molecules in general, and CH3NC in particular. J. Chem. Phys. 59, 4621–4632.
- 5) Laidler, K.J. (1987) Elementary gas-phase reactions. In Chemical Kinetics, 3rd ed. (ed. Laidler, K. J.). Harper & Row, New York, pp. 137–182.
- 6) Nakamura, E., Mori, S. and Morokuma, K. (1997) Reaction pathway of conjugate addition of lithium organocuprate clusters to acrolein. J. Am. Chem. Soc. 119, 4900–4910.
- 7) Chung, H.S. and Eaton, W.A. (2013) Single-molecule fluorescence probes dynamics of barrier crossing. Nature 502, 685–688.
- 8) Alegre-Cebollada, J., Perez-Jimenez, R., Kosuri, P. and Fernandez, J.M. (2010) Single-molecule force spectroscopy approach to enzyme catalysis. J. Biol. Chem. 285, 18961–18966.
- 9) Rao, A.M., Zhou, P., Wang, K.-A., Hager, G.T., Holden, J.M., Wang, Y. (1993) Photoinduced polymerization of solid C60 films. Science 259, 955–957.
- 10) Tonomura, A. (1989) Demonstration of single-electron buildup of an interference pattern. Am. J. Phys. 57, 117–120.
- 11) Nakamura, E. (2017) Atomic-resolution transmission electron microscopic movies for study of organic molecules, assemblies, and reactions: The first 10 years of development. Acc. Chem. Res. 50, 1281–1292.
- 12) Hashimoto, A., Yorimitsu, H., Ajima, K., Suenaga, K., Isobe, H., Miyawaki, J. (2004) Selective deposition of a gadolinium(III) cluster in a hole opening of single-wall carbon nanohorn. Proc. Natl. Acad. Sci. U.S.A. 101, 8527–8530.
- 13) Gorgoll, R.M., Yücelen, E., Kumamoto, A., Shibata, N., Harano, K. and Nakamura, E. (2015) Electron microscopic observation of selective excitation of conformational change of a single organic molecule. J. Am. Chem. Soc. 137, 3474–3477.
- 14) Dubochet, J., Adrian, M., Chang, J.-J., Homo, J.-C., Lepault, J., McDowall, A.W. (1988) Cryo-electron microscopy of vitrified specimens. Q. Rev. Biophys. 21, 129–228.
- 15) Nakamura, E. (2013) Movies of molecular motions and reactions: the single-molecule, real-time transmission electron microscope imaging technique. Angew. Chem. Int. Ed. 52, 236–252.
- 16) Weiss, S. (1999) Fluorescence spectroscopy of single biomolecules. Science 283, 1676–1683.
- 17) Sotomayor, M. and Schulten, K. (2007) Single-molecule experiments in vitro and in silico. Science 316, 1144–1148.
- 18) Skowron, S.T., Chamberlain, T.W., Biskupek, J., Kaiser, U., Besley, E. and Khlobystov, A.N. (2017) Chemical reactions of molecules promoted and simultaneously imaged by the electron beam in transmission electron microscopy. Acc. Chem. Res. 50, 1797–1807.
- 19) Sakai, M., Ichida, M. and Nakamura, A. (2001) Raman scattering study of photopolymerization kinetics in C60 crystals. Chem. Phys. Lett. 335, 559–566.
- 20) Bandow, S., Takizawa, M., Hirahara, K., Yudasaka, M. and Iijima, S. (2001) Raman scattering study of double-wall carbon nanotubes derived from the chains of fullerenes in single-wall carbon nanotubes. Chem. Phys. Lett. 337, 48–54.
- 21) Koshino, M., Niimi, Y., Nakamura, E., Kataura, H., Okazaki, T., Suenaga, K. (2010) Analysis of the reactivity and selectivity of fullerene dimerization reactions at the atomic level. Nat. Chem. 2, 117–124.
- 22) Wang, G.W., Komatsu, K., Murata, Y. and Shiro, M. (1997) Synthesis and X-ray structure of dumb-bell-shaped C120. Nature 387, 583–586.
- 23) Berber, S., Kwon, Y.-K. and Tomanek, D. (2000) Unusually high thermal conductivity of carbon nanotubes. Phys. Rev. Lett. 84, 4613–4616.
- 24) Harano, K., Takenaga, S., Okada, S., Niimi, Y., Yoshikai, N., Isobe, H. (2014) Conformational analysis of single perfluoroalkyl chains by single-molecule real-time transmission electron microscopic imaging. J. Am. Chem. Soc. 136, 466–473.
- 25) Bartell, L.S., Roth, E.A., Hollowell, C.D., Kuchitsu, K. and Young, J.E. Jr. (1965) Electron–diffraction study of the structures of C2H4 and C2D4. J. Chem. Phys. 42, 2683–2686.
- 26) Chamberlain, T.W., Biskupek, J., Skowron, S.T., Bayliss, P.A., Bichoutskaia, E., Kaiser, U. (2015) Isotope substitution extends the lifetime of organic molecules in transmission electron microscopy. Small 11, 622–629.
- 27) Nakamura, E., Koshino, M., Saito, T., Niimi, Y., Suenaga, K. and Matsuo, Y. (2011) Electron microscopic imaging of a single group 8 metal atom catalyzing C-C bond reorganization of fullerenes. J. Am. Chem. Soc. 133, 14151–14153.
- 28) Meyer, J.C., Eder, F., Kurasch, S., Skakalova, V., Kotakoski, J., Park, H.J. (2012) Accurate measurement of electron beam induced displacement cross sections for single-layer graphene. Phys. Rev. Lett. 108, 196102.
- 29) Liu, Z., Yanagi, K., Suenaga, K., Kataura, H. and Iijima, S. (2007) Imaging the dynamic behaviour of individual retinal chromophores confined inside carbon nanotubes. Nat. Nanotechnol. 2, 422–425.


