Reviews
Vibration-based monitoring for performance evaluation of flexible civil structures in Japan
2018 年 94 巻 2 号 p. 98-128
詳細
2018 年 94 巻 2 号 p. 98-128
The vibration-based monitoring of flexible civil structures and performance evaluation from this monitoring are reviewed, with an emphasis on research and practice in Japan and the author’s experiences. Some new findings and unexpected vibrations from the monitoring of real bridges and buildings are reported to emphasize the importance of monitoring. Future developments and applications of vibration-based monitoring to civil infrastructure management are also described. Many examples are taken from the author’s past 30 years’ experience of research on bridge dynamics.
Civil structures such as bridges and buildings have been constructed at increasingly larger scales. For the past fifty years, many of these large civil structures have been built in Japan. These structures are generally flexible and easily excited by external disturbances such as earthquakes and strong winds due to typhoons. Hence, the safety and functionality of these structures under dynamic loading have been issues of strong concern.
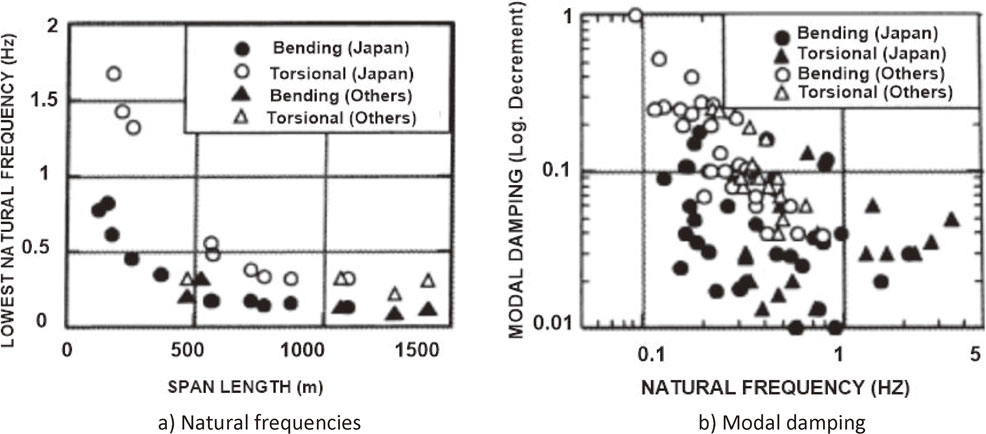
Modern cable-supported bridges are suitable for spanning long distances,1)–5) and remarkable progress has been made in the past several decades. There are two kinds of cable-supported bridge: suspension (Akashi-Kaikyo Bridge in Fig. 1) and cable-stayed (Tatara Bridge in Fig. 1). The world-record and Japan-record cable-supported bridges are shown in Figs. 2 and 3, respectively. In these Figures, the plotted dots indicate the major long-span cable-supported bridges in Japan. Many cable-supported bridges, especially cable-stayed bridges, were built in Japan after the 1980s. Figures 4a) and 5a) show the natural frequencies of the lower modes of the cable-supported bridges in Japan.6),7) As the span length increases, frequency decreases. The Akashi-Kaikyo Bridge (Fig. 1), completed in 1998, remains the world’s longest bridge, and its lowest natural frequency (girder transverse mode) is as low as 0.04 Hz (25 seconds). Long-span bridges are indeed very flexible. Figures 4b) and 5b) show the structural damping (logarithmic decrement) versus the span length in suspension bridges and cable-stayed bridges, respectively.6)–8) The Figures clearly show that damping tends to decrease as the span length increases and that the logarithmic decrement, δ (2πζ, in which ζ is the critical damping ratio), can reach as low as 0.01.
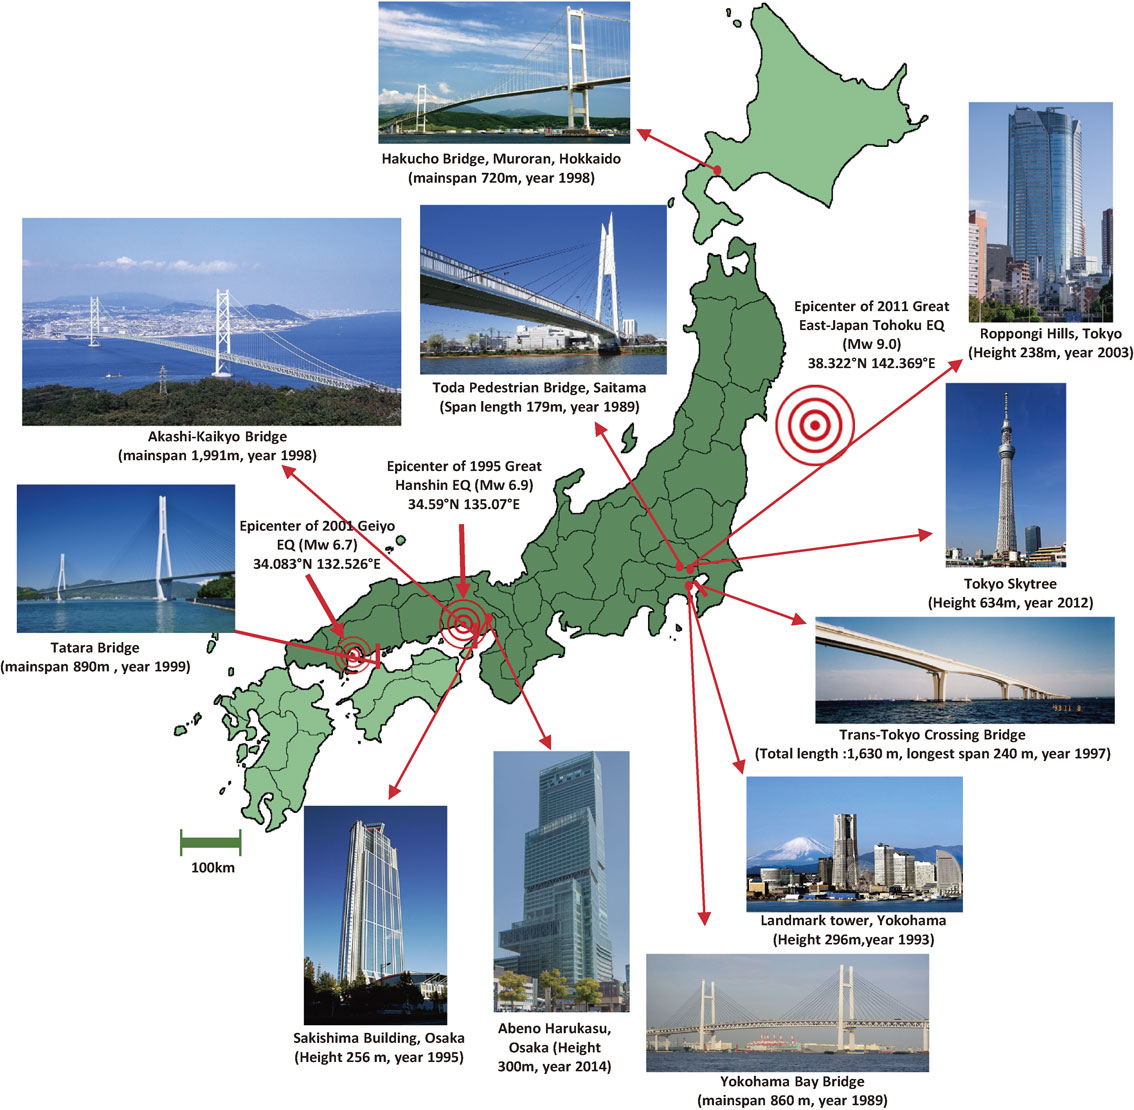
Civil structures in Japan-bridges and buildings.
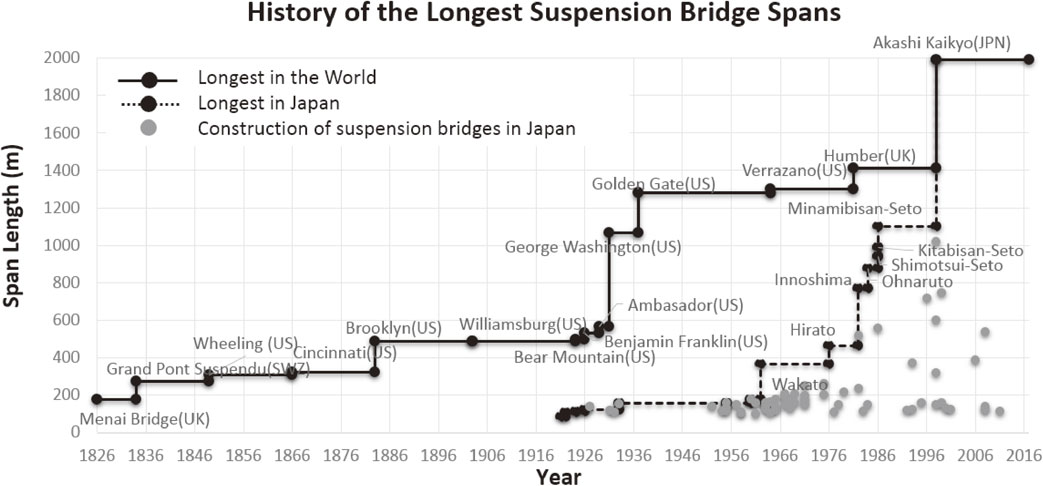
Span record history of suspension bridges.
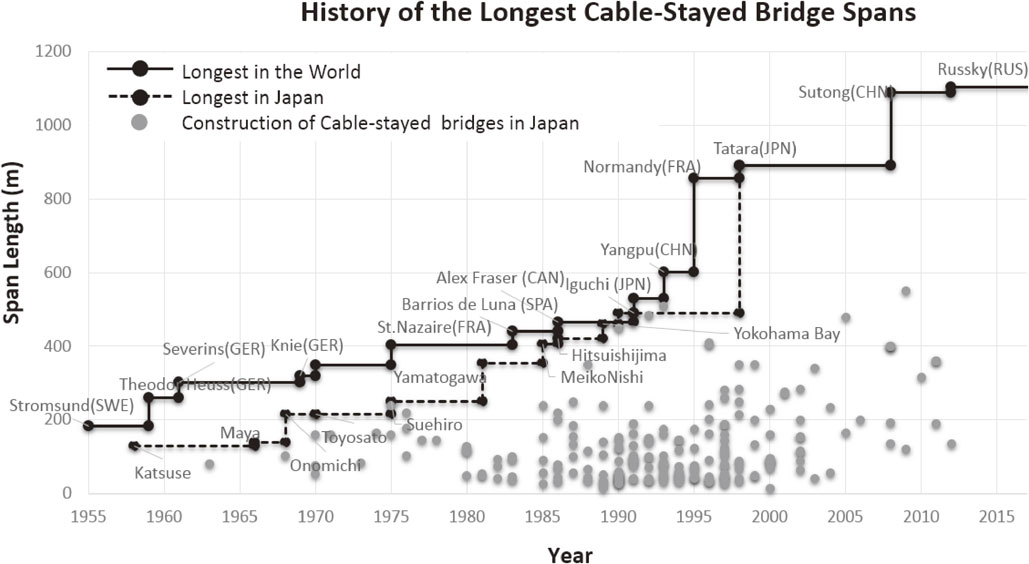
Span record history of cable-stayed bridges.
Modal characteristics of suspension bridges.8)

Modal characteristics of cable-stayed bridges.7)
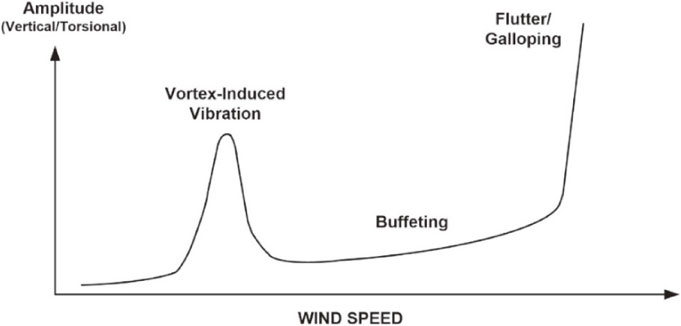
Typical wind-induced vibration of a slender, light and low-damped structure.
Technological developments for high-rise buildings have also been remarkable over the past several decades, especially in the area of seismic/wind design and construction.9),10) The first high-rise building in Japan, the Kasumigaseki Building (height 147 m), was constructed in 1967. Since then, many tall buildings have appeared in Japanese urban areas, and the number of buildings greater than 200 m in height is approximately 40. Until 2014, the highest building in Japan was the Yokohama Landmark Tower (296 m, 1993); the highest one now is Abeno-Harukasu (300 m, 2014) (Fig. 1).11) The highest tall structure in Japan is the Tokyo Skytree (634 m, 2012) (Fig. 1).
Flexible and low-damped structures are very sensitive to dynamic disturbances such as earthquake excitation, wind, and moving loads such as the passage of vehicles, trains, and pedestrians. Some recent structures indeed vibrate excessively, and thereby becoming damaged or even failing. New types of vibration have also been observed in flexible structures.12)
An important characteristic of civil structures is their uniqueness; each structure is different from any other. This is especially true for large flexible structures; for example, each bridge is designed according to local geographical and geological conditions and built using different construction materials by different groups. Each bridge is placed on different geotechnical conditions and experiences different climate and traffic conditions. No two civil structures are exactly the same. These are very different from mass-produced goods. The expected lifetime of civil structures is also generally very long, with some on the order of 100 years. Civil structures thus exist as assets of a society for many years.
It is therefore essential to ensure that built civil structures satisfy their design requirements and assumptions. It is also important to examine the condition of actual structures to ensure their high durability and long service life. For these purposes, in large, important flexible bridges and buildings, long-term and short-term campaign-type monitoring has been widely conducted to obtain valuable information on real civil structures. Vibration is often used as a measure in monitoring because vibration response represents global and local structural performance.13)–16)
Due to the increased number of flexible civil structures, control devices have become commonly used to reduce their vibration. Base-isolated buildings and bridges showed a remarkable increase after the 1995 Kobe earthquake. The number of base-isolated buildings is almost 5,000, and with over half of these buildings likely located in Japan. Roughly 5,000 base-isolated houses have also been constructed, along with roughly 400 base-isolated bridges. Brace damping devices are widely implemented in buildings and some bridges. The first active control system embedded in a building (Kyobashi Seiwa Building) was built in 1989, and now more than 50 actively controlled buildings have been built, mainly to increase occupant comfort during strong wind. In such structures, the monitoring of vibration is essential, because their safety heavily relies on the performance of their control devices and systems.
In this paper, the vibration-based monitoring of large civil structures and performance evaluation from this monitoring are reviewed, with an emphasis on research and practice in Japan and the author’s experience. Some new findings and unexpected results from vibration monitoring of real bridges and buildings are reported to emphasize the importance of monitoring. The application of vibration-based monitoring to civil infrastructure management is also described. Examples are mostly taken from the author’s past 30 years’ experience of research on bridge dynamics.
Among the various types of dynamic excitation, wind-induced vibration may be the most critical for long-span bridges, particularly cable-supported bridges.17)–21)
Wind-induced vibration is schematically shown in Fig. 6. Notably, wind flow around the bridge (deck) is easily modified when the bridge moves and receives additional motion-dependent forces from the wind flow; these motion-dependent forces may lead to self-excited and divergent vibration (flutter and galloping) with very large amplitudes. A typical example is the collapse of the Tacoma Narrows Bridge in 1940. Vortex-induced vibration is primarily a resonance of the structure due to the periodic forces generated by the Karman vortices behind the structure. However, this vibration possesses a nonlinear self-excited property characterized by lock-in phenomena, and its amplitude is limited. Girders with box sections often exhibit large amplitude vortex-induced vibrations, whereas truss girders rarely show large vortex-induced vibrations. Figure 7 shows example wind-tunnel results for the response of a bridge girder under smooth flow.22) The ordinate is amplitude, and the horizontal coordinate is the reduced wind velocity Vω/B (V: wind speed; NY and Nα: natural frequencies of the vertical bending mode and torsional mode, respectively; and B: bridge deck width). Proper estimation of natural frequencies and damping in the design stage is essential to assure the safety and operational function of a bridge under wind action. Fluctuating wind forces produce a buffeting response that is basically random and increases in proportion to the wind velocity, as shown in Fig. 6.
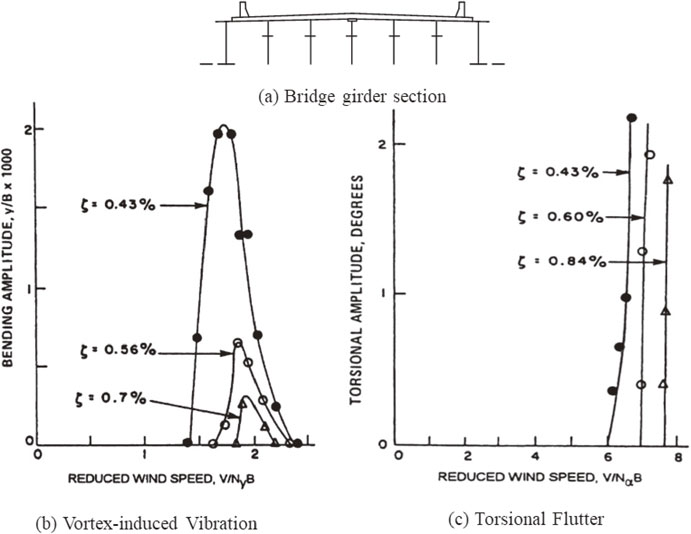
An example of effect of damping on wind-induced vibration of a bridge girder using a sectional model in wind tunnel test (ζ: damping ratio).22)
Flow around the wind-induced vibration of bridges and components such as cables is generally strongly nonlinear. Due to the separation of flow around objects such as bridge decks and cables, the flow around these objects becomes highly complex and sensitive to objects’ shapes, creating bluff-body aerodynamics. Many wind tunnel experiments have also shown that the turbulence contained in approaching flow significantly changes the wind-induced vibration. Due to the tremendous complexity associated with the interaction of turbulent natural wind and structures, complete computational models that can accurately describe various types of wind-induced vibration have not yet been established. Wind tunnel testing using full and sectional models, as shown in Fig. 8, is the only reliable method to predict the performance of structures under wind. Analytical methods using the aerodynamic forces measured experimentally in wind tunnel testing are extensively used to predict the dynamic behavior of three-dimensional bridge structures. Computational fluid dynamics (CFD) techniques have developed significantly and been used to supplement testing in recent years. However, this approach may not completely replace wind tunnel testing for some time because of the high complexity of three-dimensional bridge section geometry. The ability to predict wind-induced vibration in bridges through wind tunnel tests using small-scale models, such as 1/100, has remained an important issue in wind engineering for many years.
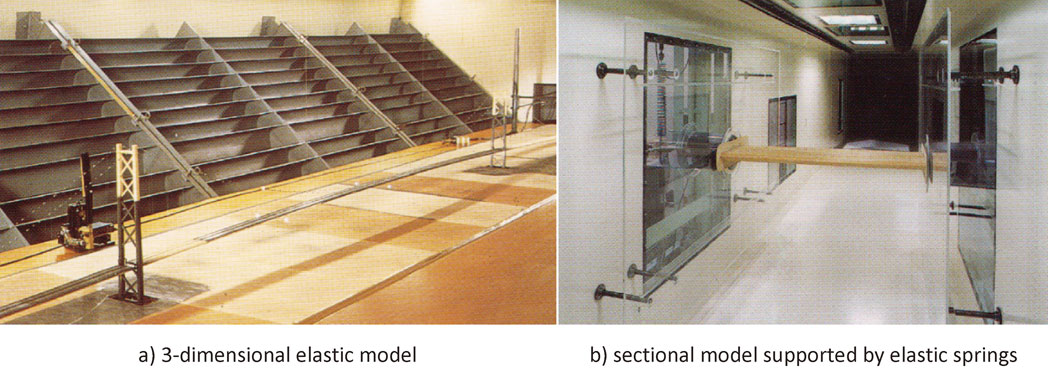
Wind tunnel tests (the University of Tokyo).
The natural frequencies of the lowest vertical and torsional modes of a bridge and their damping values are very important design parameters that control the safety of the bridge under wind action. Therefore, it is important to determine their real values in completed bridges. For this purpose, dynamic testing has been conducted on many major long-span bridges in Japan to understand their basic dynamic characteristics before they were put into service. In these tests, shakers are often used to excite the bridges to the largest possible extent. Ambient vibration23)–26) is very useful and has been employed in many cases, but it may not provide reliable information, particularly on structural damping, because of its small amplitudes. Figure 9 shows a large precision shaker used for the dynamic testing of Tatara Bridge, which was the world’s longest when first completed. This testing accurately obtained the natural frequencies and modal damping ratios of the lower vertical and torsional modes.27) During testing, when the antisymmetric torsional girder mode was excited, large cable vibration was observed, as shown in Fig. 10. The frequency of this mode was half that of the girder motion, and the vibration was attributed to the internal autoparametric resonance between the girder and one of the stay cables, as predicted in previous studies.28),29) Cable vibration due to autoparametric vibration was also observed in dynamic field testing of the Hitsuishijima cable-stayed bridge.30)
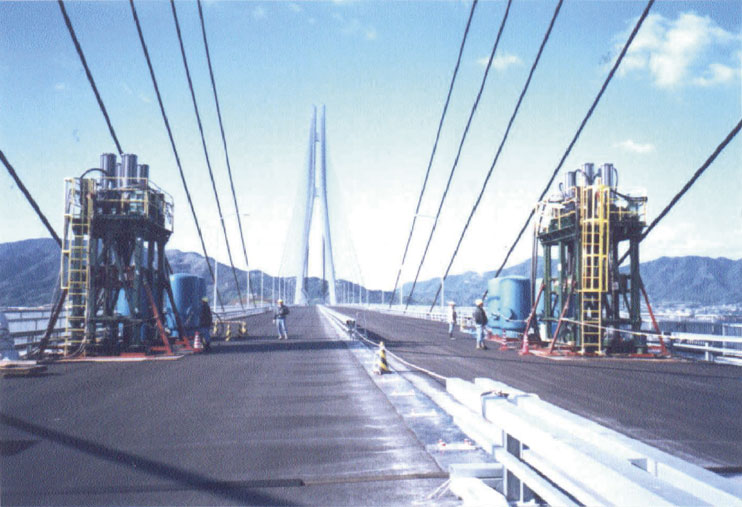
Dynamic field testing of Tatara Bridge using large shakers.
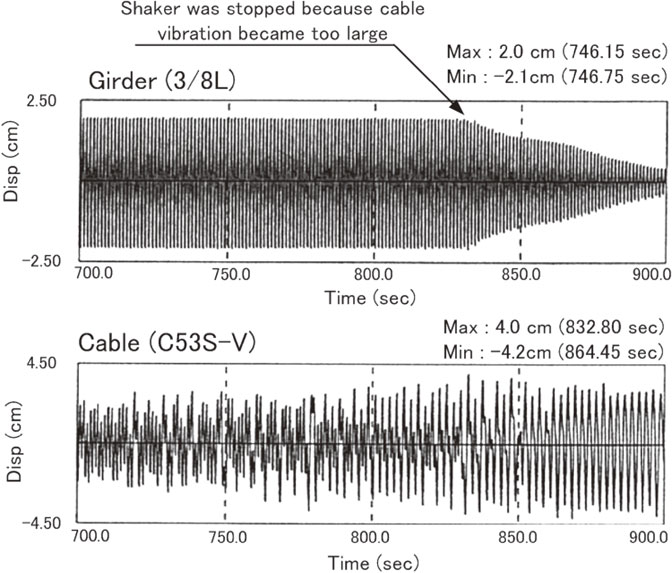
Parametrically-excited cable vibration due to girder torsional motion (Note that cable frequency is exactly half of the girder frequency).27)
Although the natural frequency of bridges can be predicted accurately by FE-based detailed structural modeling and advanced computers, structural damping can be determined only through dynamic testing of real bridges. Although dynamic field testing using shakers is expensive, the information obtained from such testing, as shown in Figs. 4 and 5, is extremely valuable to confirm the reliability of the completed structure, including the structural model and structural parameters such as stiffness and damping.
2.3 Monitoring for design verification (2) — wind tunnel testing.An object such as a bridge girder, which moves vertically and torsionally, receives motion-dependent forces under smooth flow because its motion changes the flow around the object. The equation of motion for a 2DOF object under horizontal uniform wind can be expressed as shown in Ref. 1).
| \begin{align} &m(\ddot{z}+2\zeta_{z}\omega_{z}\dot{z}+\omega_{z}^{2}z) \\ &\quad=H_{1}(\kappa)\dot{z}+H_{2}(\kappa)z+H_{3}(\kappa)\phi \end{align} | [1] |
| \begin{align} &I(\ddot{\phi}+2\zeta_{\phi}\omega_{\phi}\dot{\phi}+\omega_{\phi}^{2}\phi)\\ &\quad=H_{4}(\kappa)\dot{z}+H_{5}(\kappa)\dot{\phi}+H_{6}(\kappa)\phi \end{align} | [2] |
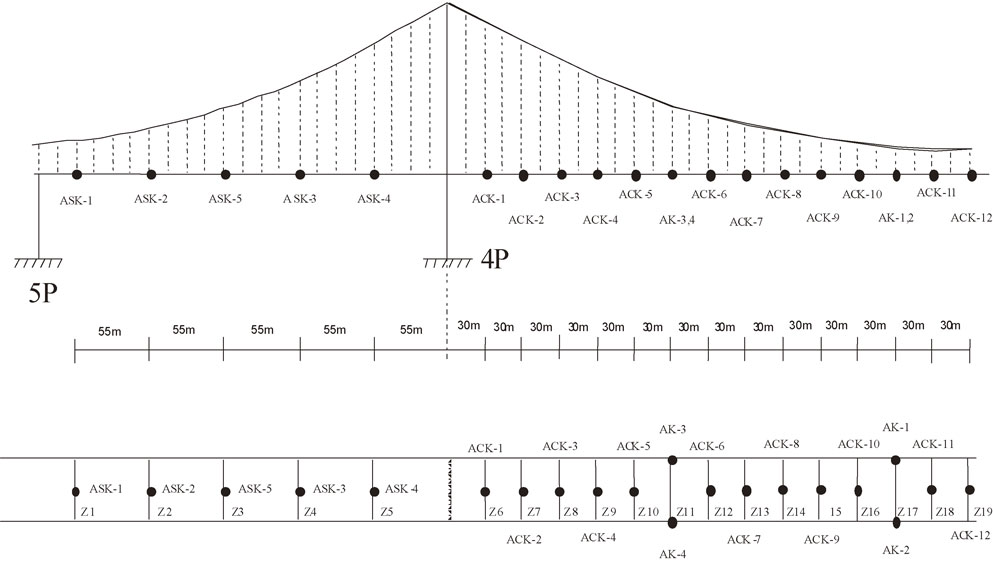
In the Hakucho Bridge (Fig. 1), a three-span suspension bridge with a total length of 1,380 m (three spans of 330 m, 720 m, and 330 m), a series of dynamic tests were performed after completion of construction, including an ambient vibration test. Densely distributed accelerometers were placed at a spacing of 30 m on the main span and 55 m on the side span near the north approach (Fig. 11). The measured wind-induced structure responses clearly show a quadratic relationship between wind velocity and response (Fig. 12).
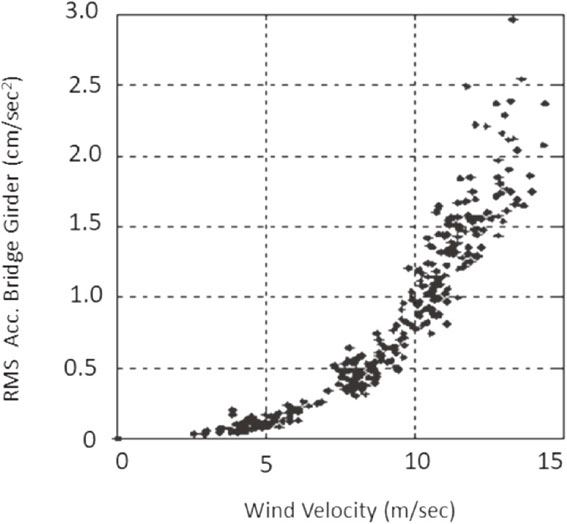
Wind velocity and root mean square acceleration at center main span.31)
The objective of this ambient monitoring was to extract aerodynamic stiffness and aerodynamic damping from the girder response data under various levels of wind speeds. Because the torsional responses of the girder were very small, only girder vertical responses were analyzed. Structural performance during ambient vibration and strong wind was evaluated by applying a structural identification method with two steps: identification of vibration modes and inverse analysis of structural properties from the identified modes. The mathematical details and procedures of this method are provided elsewhere.31),32) Comparisons between the identified aerodynamic damping and stiffness and estimates based on wind tunnel testing are shown in Fig. 13. Note that the changes in damping and stiffness are obtained from the direct inverse analysis method by employing modal parameters identified from the ambient vibration measurement. The effect of friction force in the bridge bearing was found to be significant and was removed in the inverse analysis. The accuracy of inverse analysis depends on the number of modes that can be obtained from measurement. Along with measurement error, the limited number of modes identified from ambient measurement may result in scattered estimate of changes in damping and stiffness.31) Nevertheless, the overall trend of the changes supports the trend obtained from wind tunnel testing.
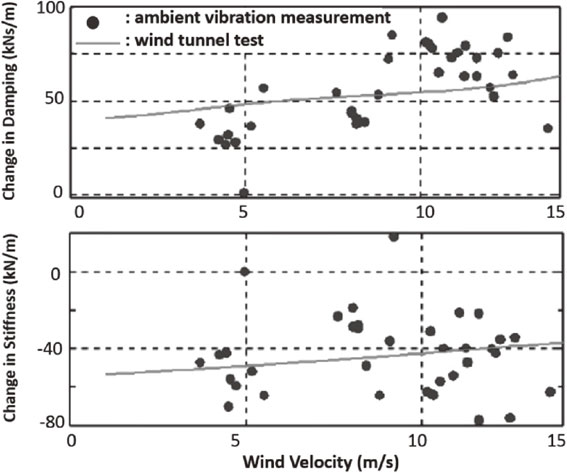
Hakucho Bridge identified change in aerodynamic damping and stiffness with respect to wind velocity.31)
In the design stage, various vibration control remedies are examined in wind tunnel testing and implemented. Therefore, few bridges show noticeable vibration under wind after construction is completed. The Trans-Tokyo Bay Highway Crossing (Fig. 1) is one of them. Completed in 1997, this structure is a ten-span continuous steel box-girder bridge with a total length of 1,630 m. The two longest spans of this bridge measure 240 m, and the highway it carries consists of four lanes with an overall width of 22.9 m. During the construction of the crossing, significant vibration due to vortex shedding was observed in the bridge under prevailing winds, the direction of which was almost transverse to the bridge axis. The vortex-induced first-mode vibration peaked at a wind velocity of 16–17 m/s, with a maximum amplitude exceeding 50 cm (Fig. 14(a)).33) Extensive wind tunnel testing using both sectional models and three-dimensional models had been conducted in the design stage of the bridge. The wind-tunnel response under smooth flow and the responses observed in the real bridge are compared in Fig. 14(a). The observed responses are scattered at wind velocities from 17 m/s to 19 m/s. These scattered data may be attributed to differences in the turbulence intensity, nonstationarity of wind velocity, and wind direction. Although some discrepancies occur, the overall characteristics of the responses under the wind tunnel test are consistent with those under natural wind. Notably, the damping δ (logarithmic decrement, 2πζ) was estimated on the order of 0.03–0.04 from field dynamic testing by shakers. Tuned-mass dampers (TMDs) were installed inside the bridge’s box girder (Fig. 14(b)) and aerodynamic flaps, thereby significantly reducing the vibration, as shown in Fig. 14(c). It should be noted that vortex-induced vibration was indeed observed in the wind tunnel experiments (logarithmic damping = 0.02) in the design stage, but the damping assumed in the design is much higher (δ = 0.05).
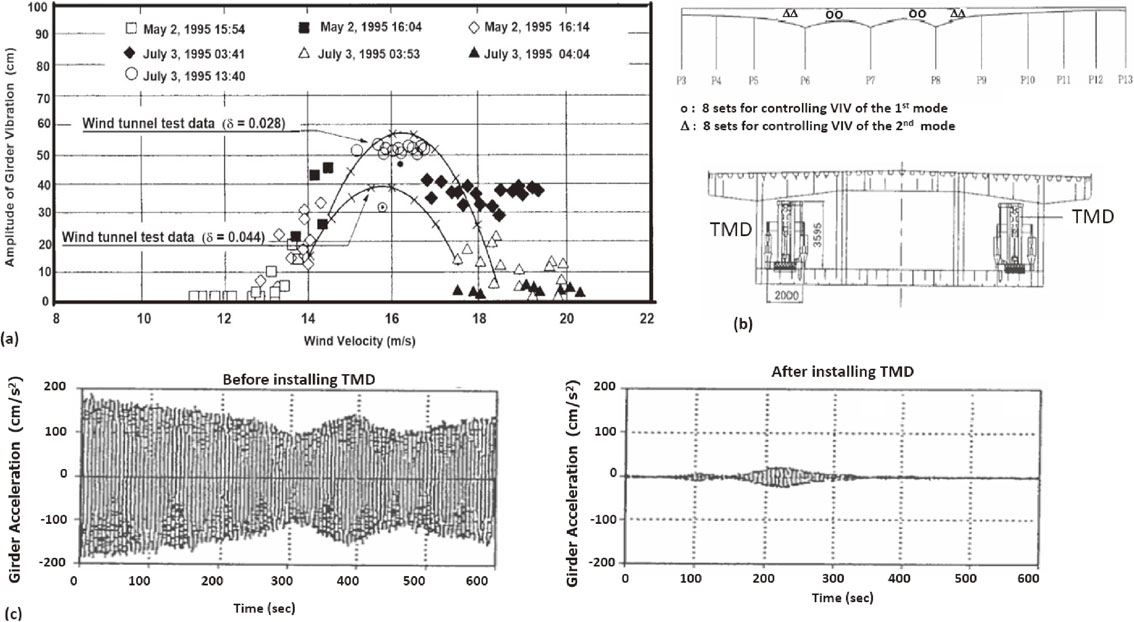
Wind-induced responses in Tokyo Bay Highway Crossing Bridge. (a) Comparison of observed amplitudes and amplitudes in wind tunnel test for two values of damping (δ is logarithmic damping), (b) location 16 TMDs for the first and second bending modes, (c) vertical girder vibration time-history before and after TMD installation.33)
Similar wind-induced vibration was also observed in the world’s longest steel box girder bridge in Brazil34) and in the box girder of the Great Belt Bridge in Denmark.35)
2.4 Monitoring for design verification (3) — buffeting response prediction.During the research and development stage of the Honshu-Shikoku bridge project, a 1:10 scale in-situ sectional truss girder model, as shown in Fig. 15, was built in 1973, and its response under natural wind was observed for several years. The buffeting response measured in the model and the one calculated based on the design procedure using the measured fluctuating properties of natural wind are presented as power spectral density for comparison in Fig. 16. Good agreement is observed, except for the high-frequency component.36)
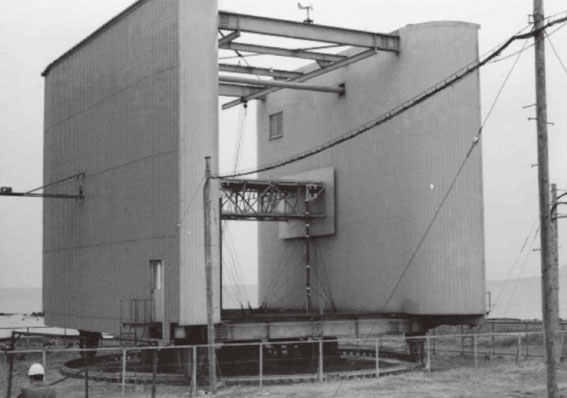
1:10 scale in-situ sectional truss girder model.
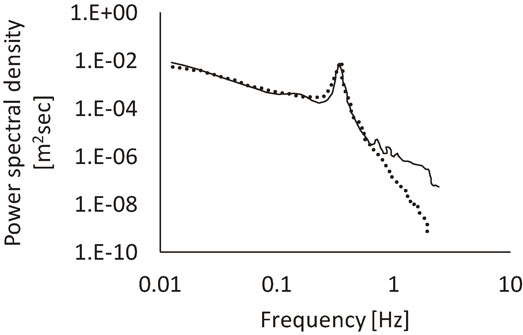
Comparison of power spectra of buffeting responses between observed in in-situ wind tunnel and the calculated by design code. (Solid line: observation; dashed line: estimation)
A long-term monitoring system was installed in the Akashi-Kaikyo Bridge (Fig. 1), completed in 1996. The system,37) consisting of velocity meters, GPS (Global Positioning System), and anemometers, was placed as shown in Fig. 17. Figure 18 shows a time-history of wind velocity and transverse displacement response at the span center during the Typhoon 9918 in 1999. Figure 19 shows the average and peak responses during Typhoon 9918 compared with those of the wind-resistant design code. Based on 20 years of measurement38),39) including seasonal strong winds, the measured dynamic, mean, and maximum responses, as well as the responses calculated by the design code, are compared in Fig. 20. The measured mean (static) responses agree quite well with the predicted values, while the dynamic response is somewhat overestimated. This result is attributed to the overestimation of the spatial correlation of wind loading along the span.40) The results in Fig. 20 prove that the procedure and design assumptions employed in the wind-resistant design code are generally correct, although some parts need to be improved. This example demonstrates the real value of long-term monitoring.

Long-term monitoring system in Akashi-Kaikyo Bridge.37)
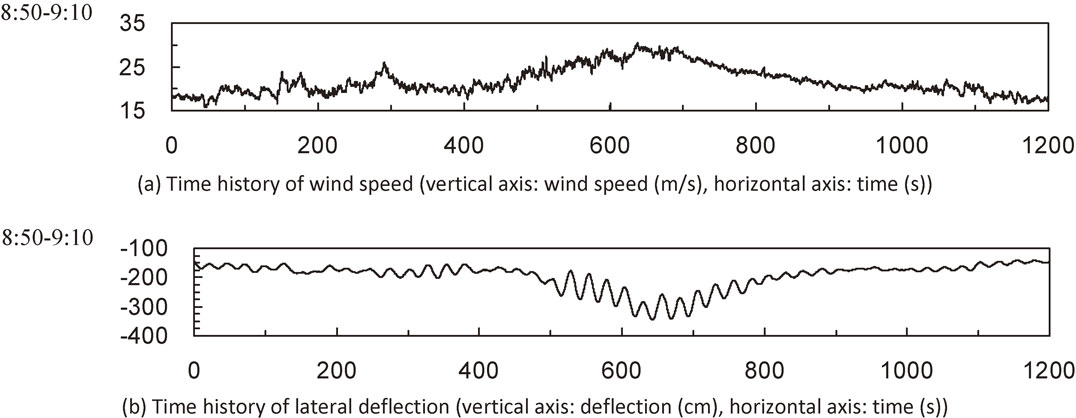
Time History of Wind Speed and Lateral Deflection of Deck (8:50–9:10).38)
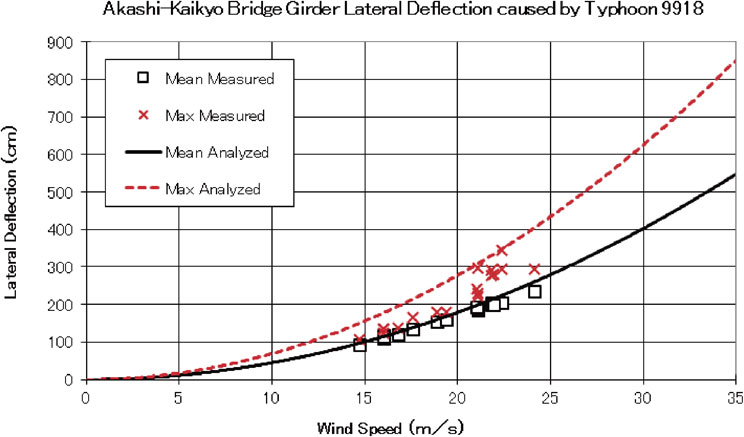
Mean and maximum transverse deflections of the deck at the center with wind skew less than 30 degrees.38)
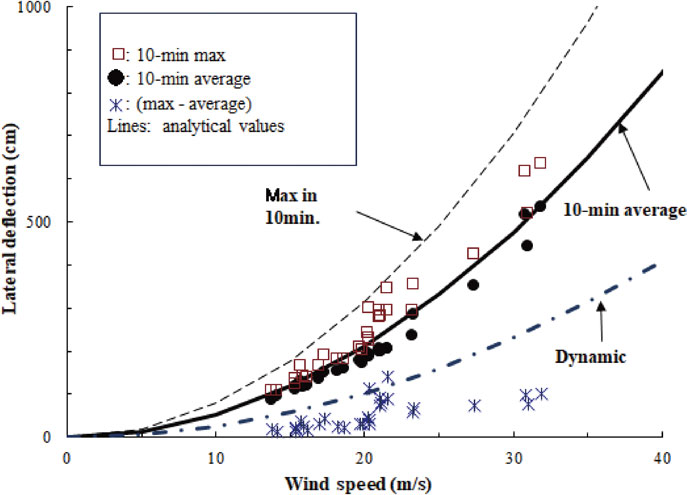
Comparison of horizontal displacements (lateral deflection) at the center of main-span measured by GPS over 20 years and calculated by wind-resistant design specifications.
The initial monitoring system of the Akashi- Kaikyo Bridge, installed in 1996, was very stable and did not require much maintenance work. The role of the system was to confirm the design code, including the design parameters, and it was successful in this role. In 2012, the system was completely replaced by a new monitoring system in which the number of the sensors was reduced by roughly half. The monitored data is now automatically sent in real time to the head office of the Honshu-Shikoku Bridge Expressway Company Limited.
2.5 Benefit of long-term monitoring: new type of wind-induced vibration.Hakucho Bridge (Fig. 1) installed a long-term monitoring system, consisting of anemometers and accelerometers, in 1998. This system, simpler than the one in the Akashi-Kaikyo Bridge, has measured responses due to strong winds and strong ground motions using a trigger system for 15 years.
Through careful analysis of monitoring data from Hakucho Bridge, unexpected along-wind vibration of the bridge tower and associated girder lateral vibration were found,41) and this new vibration was investigated by wind tunnel testing.42)
The wind-induced responses of Hakucho Bridge during six strong wind events, taken from 2008–2012 monitoring data, were studied with an emphasis on tower single-frequency large vibration. Significant tower in-plane and girder lateral vibration were observed at moderate wind velocity (13–24 m/s); the tower in-plane acceleration is characterized by single-frequency, harmonic-like oscillation at 0.6 Hz and 0.8 Hz. Occurrences of these two oscillations depend upon wind direction and velocity (Fig. 21). The tower single-frequency in-plane oscillations affect the girder lateral responses, which were confirmed by comparison of the frequency components of the tower and girder lateral vibration. Finite element analyses have shown that the single-frequency oscillation at 0.6 Hz corresponds to the tower local in-plane, in-phase mode, while the oscillation at 0.8 Hz corresponds to the tower local in-plane, out-of-phase mode. These two modes are the tower’s dominant modes, with small motion contributions from other components such as girders and cables.
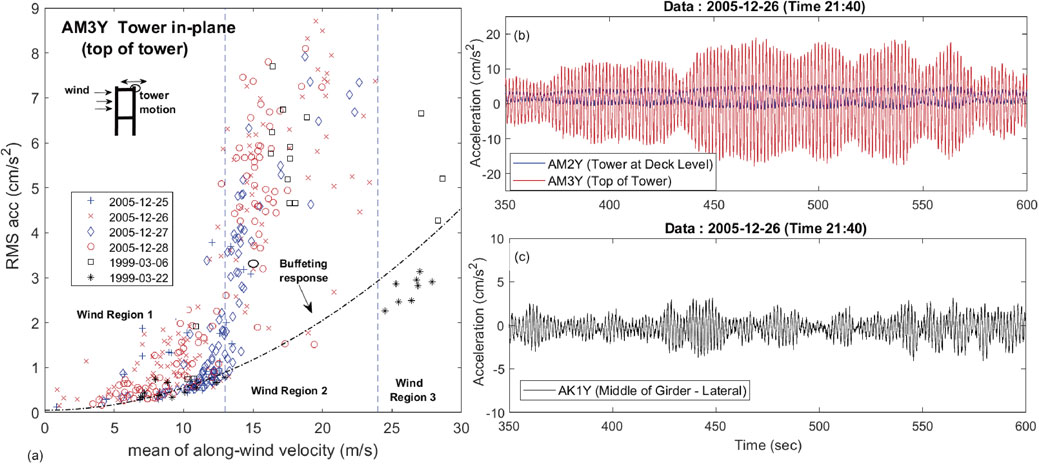
Unexpected new along-wind vibration of tower in Hakucho Bridge-found from long-term monitoring; (a) trend of tower’s in-plane acceleration with respect to wind velocity, (b) example of acceleration time history of tower during in-plane VIV, (c) lateral deck acceleration during tower in-plane VIV.41)
A wind tunnel experiment using a 1:20 scale model was conducted to investigate the phenomena under various wind velocities and angles of attack.41),42) The results show that the bluff body of the windward tower generated vortex shedding, as indicated by the presence of single-frequency dominant oscillation of wind in front of the leeward tower. The vortex shedding created a periodic force towards the leeward leg. At wind velocity ranges of 13–17 m/s and 17–24 m/s under specific wind angles of attack, the vortex shedding frequency coincides with the tower natural frequencies of 0.6 Hz and 0.8 Hz, respectively, causing the tower to resonate in the along-wind direction.
While vortex-induced vibration of bridge tower is not uncommon during the freestanding construction stage, its occurrence on a completed bridge tower, especially on the strong axis as reported in this study, is very rare. Although the displacement amplitude of this tower vortex-induced vibration is relatively small to cause an immediate significant problem, monitoring data show that it still occurs despite the presence of a cross-sectional corner cut as a countermeasure.
2.6 Monitoring of tall buildings and tall structures.The monitoring of wind-induced responses in tall buildings and tall structures under wind action has a long history. The first structural testing was conducted at the Eiffel Tower in Paris, France, by Gustave Eiffel himself.43),44) The first building monitoring occurred at the Empire State Building in New York City, USA, in 1940.45) In the 1960s, triggered by the pioneering work of Alan Davenport,46) extensive research programs on the monitoring of the wind-induced responses of tall buildings were executed in North America and Europe.47),48) Davenport provides an excellent review on this subject.49)
Buildings are much larger in scale than bridge decks and pylons and have greater density. The wind-induced vibration of tall buildings is thus almost free from flutter/galloping and vortex-induced vibration and instead consists primarily of random-like buffeting. Exceptions include tall, light, and slender structures such as chimneys and towers. In addition to buffeting under wind, these structures may experience problems with vortex-induced vibration or even flutter/galloping.
In Japan, the monitoring of tall structures and buildings started in the 1960s. Ishizaki and Katsura50) monitored the wind-induced responses of Kyoto Tower (131.4 m) in Kyoto and succeeded in measuring its trajectory motions under strong winds. These researchers clearly showed that the motions were nearly circular, indicating the importance of across-wind response. Matsui and Tamura et al.51) monitored a tall school building and showed its significant torsional wind-induced response. A full-scale measurement of the wind-induced pressure of a tall building was also significant.52) Many studies on the monitoring and measurement of wind climate, motion, and pressure in tall buildings and structures were conducted, and findings from these monitoring efforts were reflected in Japan’s wind-resistant design code.53)
In the 1980s, human perception of wind-induced vibration in tall buildings received attention,54)–56) leading to the implementation of design criteria. Based on the design code, many tall buildings needed to install control devices.57) Among the various devices used to reduce wind-induced vibration, active control was one of the most advanced, and more than 40 buildings installed active control systems.58),59) In these buildings, the monitoring of wind-induced responses is essential to operate the active control systems.
GPS became available in the 1990s and was introduced in the monitoring of wind-induced responses.60) The advantage of GPS is that it can measure not only the dynamic resonant component, but also the average and long-period component. GPS became widely used in the monitoring of wind-induced responses61)–63) (Fig. 22). Among the many studies of wind-response monitoring,63) Tamura’s work64) is of particular note; surprisingly, this research succeeded in identifying up to the 9th mode in a medium-rise building and up to the 22nd mode in a large-span structure.
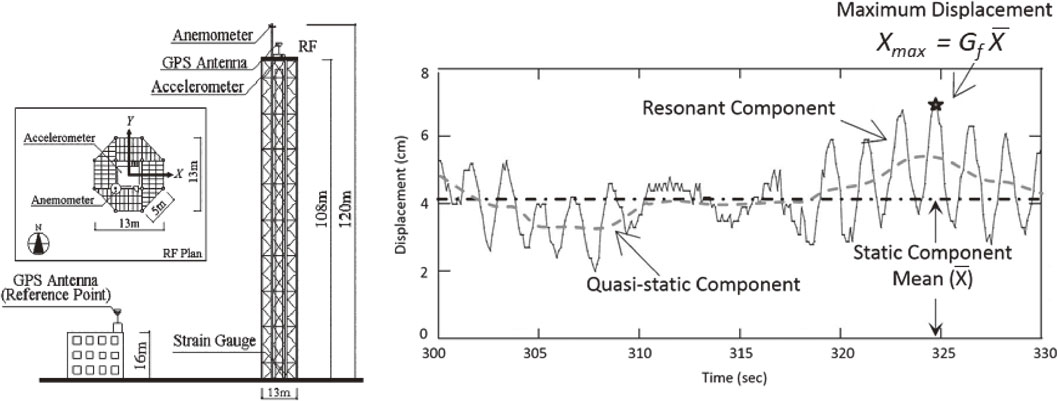
Wind-induced response of a 108 m-high tower by GPS.61)
Because of the high intensity of seismic activity in Japan, monitoring for seismic events has a long history. Instruments for monitoring of strong ground motion were first developed by the United States Geological Survey around 1930. The Earthquake Research Institute (ERI) at The Imperial College of Tokyo was founded in 1925 after the Great Kanto Earthquake, and its first director, K. Suehiro, was invited to the USA to deliver lectures on this earthquake and its damage. In his lecture, Suehiro stressed the importance of developing an instrument that could record strong ground motion without off-scale to investigate the earthquake-resistant design of structures. This lecture provided a major impetus to the development of the strong motion instrument.65),66) The first strong motion was recorded from the 1933 Long Beach Earthquake, and the well-known strong motion recorded at El Centro during the 1940 Imperial Valley Earthquake has been used for the seismic design of structures to the present day.
The development of a strong motion instrument in Japan began after the 1948 Fukui Earthquake, which was a large damaging inland earthquake. The first instrument, known as SMAC, was developed by Professor Takahashi of the ERI in 1953.67) This device was named after the Strong Motion Acceleration Committee and could measure up to 1 g. Twenty-five SMACs were installed in buildings in 1956, marking the start of earthquake-induced response monitoring of structures in Japan.
Monitoring for seismic responses has been widely employed for decades in Japan. From a structural point of view, the main objectives of seismic monitoring are as follows: verify designed load assumption, evaluate seismic response and structure performance during large earthquakes, detect possible damage due to earthquakes, and verify structural retrofits. Seismic monitoring critical for large and important structures, structures with specific features, and structures with innovative technologies such as seismic isolation or response control systems.
3.1 Monitoring of responses for design verification and retrofits.When beginning to develop long-span bridges in Japan, issues associated with the quantification of external forces such as seismic forces are essential. Limited past experience and large uncertainties within design assumptions make verification through scaled experimental testing an important design step. Seismic response observations collected from instrumented structures can verify seismic designs and clarify the validity of assumptions made in these designs.
One example is the Tatara Bridge (Fig. 1), the longest cable-stayed bridge in Japan, which was strongly excited by the 2001 Geiyo Earthquake (Mw 6.7; maximum ground acceleration at the bridge site was 144 cm/sec2).68) From observation of the seismic response, the actual seismic load in terms of the response spectra calculated from the recorded ground motion was determined to be below the design specification, as shown in Fig. 23. The seismic behavior of the bridge was studied with simulation analysis to verify the structural model and assumptions using the observed ground motions. The simulation results were found to be in good agreement with the observed responses.69)
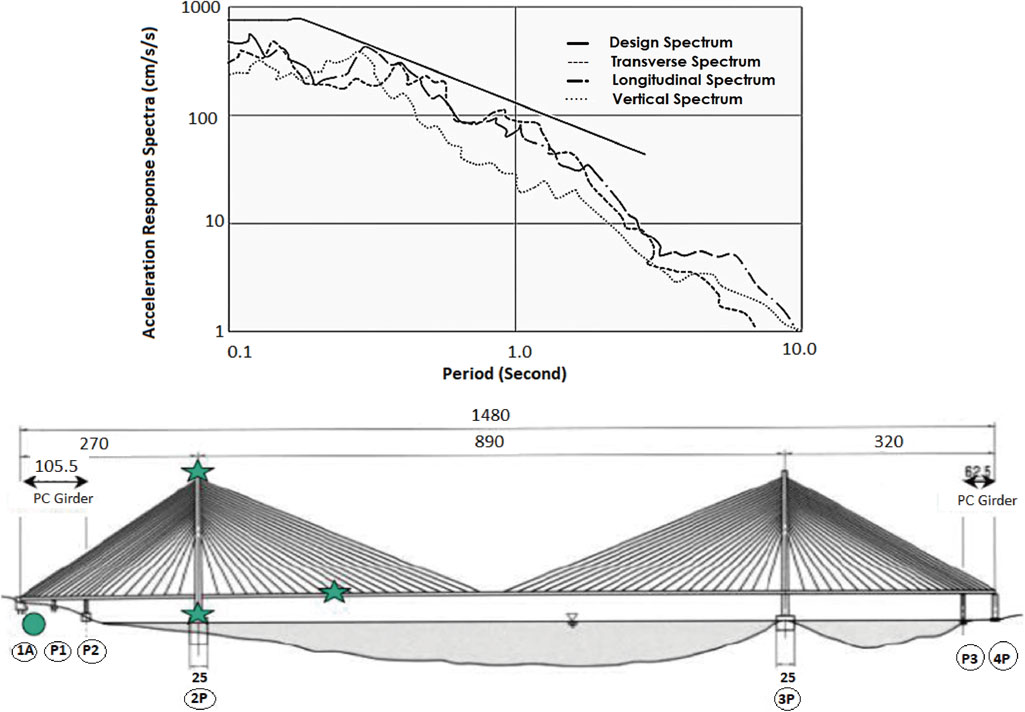
Monitoring system for Tatara Bridge (●: seismometer; ★: accelerometer) and comparison between design spectra and observed response spectra in the 2001 Geiyo Earthquake.68)
An important problem of engineering interest in the seismic analysis of long-span bridges is the spatial variation of seismic ground motions. This variation is a result of the time lag of seismic wave propagation, because the foundations of long-span bridges are significantly separated by the long span. One such analysis was performed on Ohnaruto Bridge using observed responses during the 1995 Kobe Earthquake (Mw 6.9). This study revealed that spatial variation of ground motions increased the vertical response of girders.70) Similar increases in vertical girder response were also observed at other long-span bridges, such as the Akinada Bridge during the 2001 Geiyo Earthquake.69)
Also observed during the 2001 Geiyo Earthquake was the center stay rod failure of the First Kurushima Kaikyo Bridge.70) The observed seismic ground motion was applied to dynamic three-dimensional finite element analysis, and it was verified that the failed center stay rods performed as they had been designed. Reanalysis of observed data from extreme events can provide valuable information to verify and update designs.
Monitoring of seismic events during construction is also important to evaluate structural behaviour and design assumptions. The Akashi-Kaikyo Bridge was still under construction when the 1995 Kobe Earthquake occurred, as shown in Fig. 24(a). Construction of abutments and towers had been completed, while part of superstructure was suspended by the main suspension cables. Fault movement occurred directly below the Akashi-Kaikyo Bridge. The base motion of the abutments and pylons due to fault action is shown in Fig. 24(b).71) GPS monitoring effectively identified this motion. No severe damage was observed on the bridge, but the planned centre span was altered from 1990 m to 1991 m.
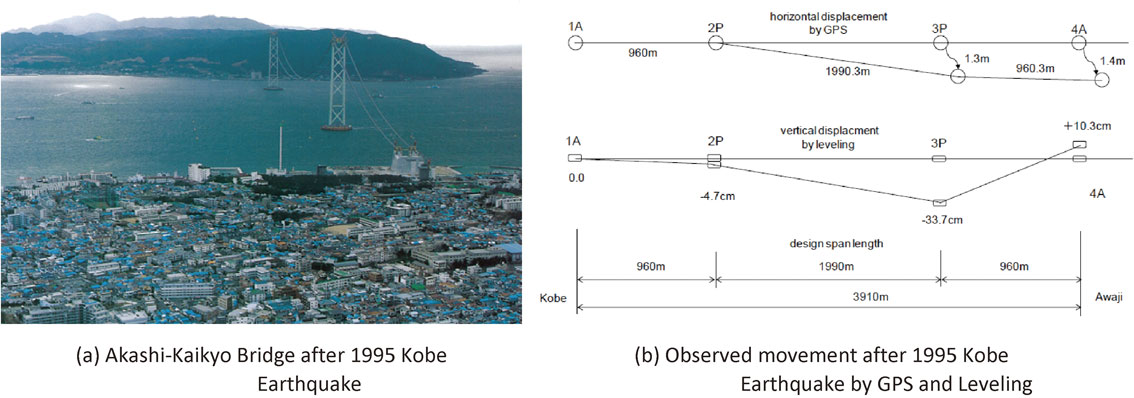
Observed movement at Akashi-Kaikyo Bridge after the 1995 Kobe Earthquake.71)
Several important records were obtained from the 1995 Kobe Earthquake because the bridge had been partly instrumented with a monitoring system to evaluate its seismic design. It should be noted that, by the time of the earthquake, only the towers and main suspension cables of the bridge had been installed. Because the monitoring system had been only partially installed, information from the velocity responses recorded at the top of tower P2 was very important to evaluate the tower’s condition due to the earthquake and possible changes in its structural condition and orientation. The peak velocity was approximately 1.3 m/s, with a predominant frequency of 0.40 Hz in the transverse direction, while in the longitudinal direction, the peak velocity was 0.9 m/s, with a predominant frequency of 0.47 Hz.72) Based on the measured response, two analyses were conducted. The first simulated the response of the towers in the earthquake, and the second evaluated the seismic safety of the completed bridge subjected to near-field ground motion.
Another example of monitoring due to the 1995 Kobe earthquake is the analyses conducted for the Minami-Bisan-Seto Bridge and Hitsuishi Bridge at the Kojima–Sakaide of the Honshu-Shikoku Bridge.73),74) The seismic performance of those bridges was investigated based on the measured data. Both bridges are double-deck steel trusses and had been in service for seven years when the earthquake occurred. For the Minami-Bisan-Seto Bridge, ground acceleration with a peak of 0.03 g was measured at the ground surface, while large amplification of longitudinal acceleration with a peak of 0.3 g occurred at the top of the tower.73) The bridge’s dynamic responses were later evaluated in a simulation using ground acceleration applied to all supports. This experience shows that monitoring against extreme events, even during the early stages of construction, is very useful to evaluate structure performance and verify design assumptions.
One important aspect of design verification is estimating the appropriate damping values and mechanisms. These estimations are quite difficult because of the complexity of the mechanisms involved and the sensitivity of the estimated values to excitation conditions. Nevertheless, several studies have used seismic records of instrumented long-span bridges to clarify damping mechanisms and estimate the values. For example, Kawashima et al.75)–77) examined seismic records from over 33 earthquakes on the Suigo Bridge, a 290.45 m-long steel box girder two-span continuous cable-stayed bridge, to clarify the damping characteristics of the tower and deck. The damping ratio was found to correlate with the measured accelerations, which depended on the structural components and direction of excitations.
At the Tsurumi Tsubasa Bridge, strong motion observation has been performed since the opening of the bridge, and several records have been obtained. During the Niigata-Chuetsu Earthquake on October 23, 2004, the records show that vibration continued over a long time, indicating that damping in the response displacement amplitude was small. Based on seismic records from 10 earthquakes on Yokohama Bay Bridge,78) the damping ratios for lower modes in both vertical and lateral directions were found to increase with earthquake magnitude. At small magnitude, the average damping ratios were found to be 2%, and they increase significantly (up to 4%–5%) as the earthquake magnitude increases, as shown in Fig. 25. These values are larger than the previously suggested 2%.
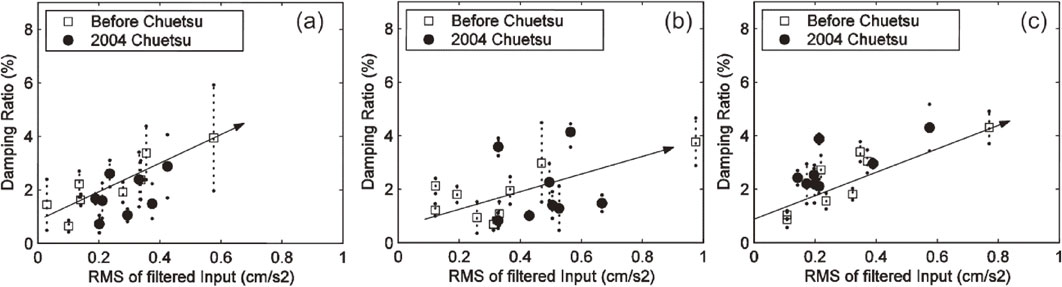
Variation of damping ratio of Yokohama Bay Bridge with respect to earthquake input amplitude for: (a) first bending mode, (b) second bending mode; and (c) first transverse mode.78)
Seismic monitoring experience is also essential for the development and verification of structural retrofits. This has been the case for Yokohama Bay Bridge. This cable-stayed bridge with a central span of 460 m has been continuously monitored by a densely distributed sensor system since 1990. In 2005, a seismic retrofit program was implemented on the bridge for safety assurance against a Level 2 earthquake according to Japan’s bridge seismic code. The retrofit program considered two types of maximum credible earthquakes: magnitude 8 far-field or moderately far-field large earthquakes taking place in the subduction zone of the Pacific plate and near-field inland earthquakes occurring beneath or close to the site.
The retrofit program used previous monitoring results and simulations from identified potential damage for both types of ground motion and concluded that significant damage would occur on the towers and bearings under such excitations. Furthermore, the far-field ground motion would create more damage and induce a 1.5-m longitudinal displacement of the girders. Accordingly, five retrofit strategies and a fail-safe design concept were introduced.79) From previous seismic monitoring results,80) link bearing connections (LBC) were shown to have a risk of improper function during an earthquake. In such a case, excessive moment at the bottom of the end pier may cause the LBCs to fail and create uplift deformation at the girders. To prevent such conditions, a seismic retrofit of the bridge has been conducted, and a fail-safe scenario has been provided. Based on the feedback of the monitoring system, the seismic retrofit of the bridge in 2005 employed a fail-safe design in which the girder-ends are connected to the footing using prestressed cables to prevent their uplift, as shown schematically in Fig. 26.79)
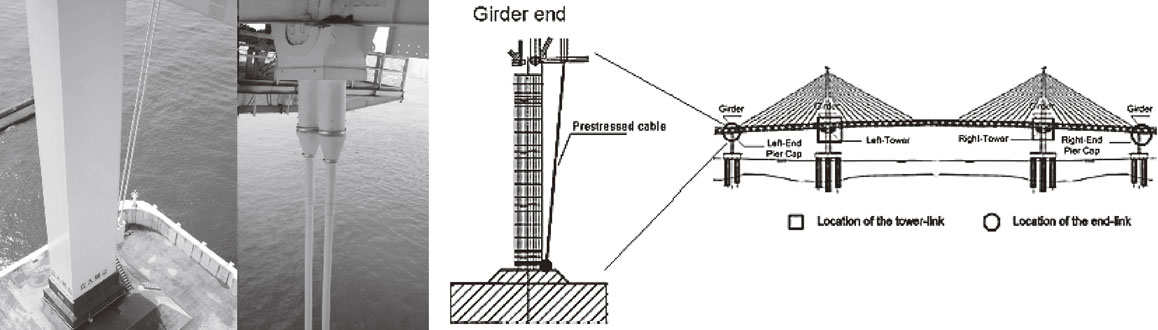
Photos and Schematic figure of a fail-safe design system using pre-stressed cable that connects girder-end and the ground to prevent uplift at Yokohama Bay Bridge.
The Metropolitan Expressway network connecting Tokyo and Yokohama includes three important long-span bridges, all of which have permanent seismic monitoring systems: Yokohama Bay Bridge, Rainbow Bridge, and Tsurumi-Tsubasa Bridge. A study on the applications of earthquake-induced responses for system identification methodology to investigate the behavior of structures subjected to the 2004 Niigata-Chuetsu earthquake (Mw 6.8) was conducted on the Yokohama Bay Bridge, Rainbow Bridge, and Tsurumi-Tsubasa Bridge.78) The Yokohama Bay Bridge in particular has one of the densest permanent monitoring systems among bridges in Japan (Fig. 27). The bridge was constructed on soft soil and required a special seismic isolation system. It is located near an active fault and is close to the epicenter of the 1923 Great Kanto Earthquake. These conditions have made seismic performance a major concern. To confirm the seismic design and monitor the bridge’s performance during earthquakes, a comprehensive and dense array monitoring system was installed.
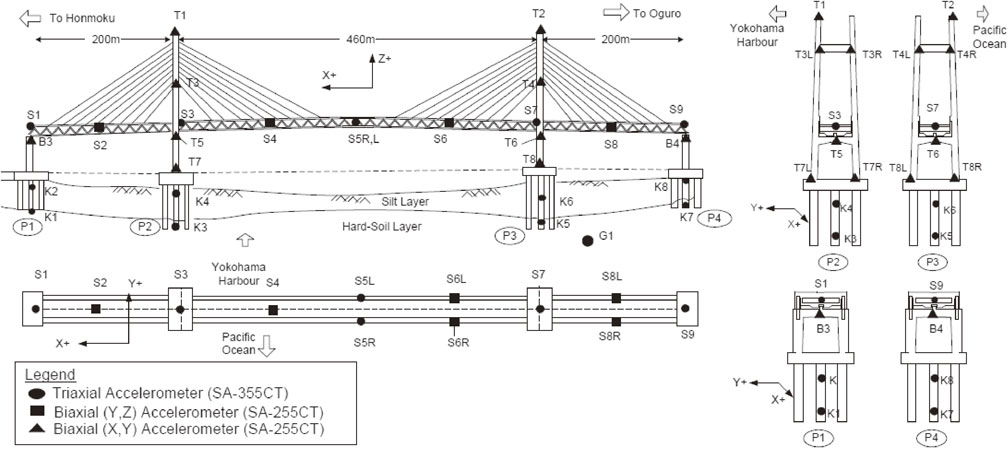
Monitoring system on Yokohama Bay Bridge.
Despite the flexibility of long-span bridges, the inertia load due to earthquakes can be large, making necessary the further reduction of natural frequencies. For this purpose, LBCs have been used in both the Yokohama Bay Bridge and Higashi Kobe Bridge. The Higashi Kobe Bridge (Fig. 28), a cable-stayed bridge with a central span of 485 m that opened in 1994, is located in the strong motion area of the 1995 Kobe Earthquake. The bridge’s bearing link systems connecting its end girders and piers failed, as shown in Fig. 28(b), losing vertical support to prevent uplift.81) Failure of the wind shoe, the function of which was to prevent transverse motion of the girders due to excessive transverse motion of the girder end, led to the failure of the link. Fortunately, the bridge was supported by intermediate piers at the side spans, which provided added redundancy and prevented total collapse.

Higashi Kobe Bridge and damage at end-bearing during the 1995 Kobe Earthquake.81)
The experience on the Higashi Kobe Bridge demonstrates that ensuring satisfactory seismic performance of LBCs is very important to avoid damage to and excessive seismic inertia load on the tower. The long-term seismic monitoring program of the Yokohama Bay Bridge is an opportunity to observe the seismic performance of LBCs. Seismic records of varying amplitudes, obtained from six major earthquakes from 1990 to 1997, were analyzed to evaluate the global and local performance of the bridge.78)–80) System identification of a long-span bridge under seismic excitation requires that both non-unique ground excitation records measured along the bridge and excitation in multiple directions be considered. Investigation of the link-bearing performance of the Yokohama Bay Bridge was conducted using records from fourteen earthquake frames. The analysis involved system identification, particularly through observing the first longitudinal mode, analysis of the response between the pier-caps and girders, and analysis using a finite element model.
Based on the analysis, the following findings were observed (Fig. 29):
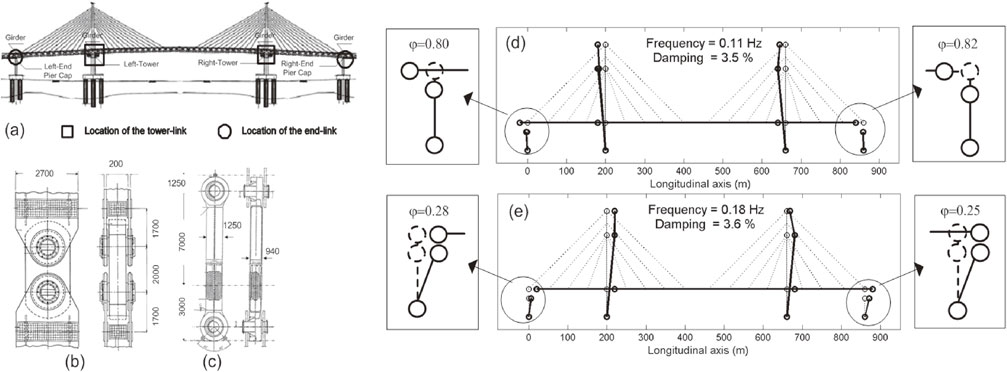
Performance evaluation of link-bearing connection (LBC) of Yokohama Bay Bridge based on long-term seismic monitoring results. (a) Location of link bearing connection of Yokohama Bay Bridge. (b) Typical LBC at the tower, (c) typical LBC at end piers. Example of two typical first longitudinal mode (sway mode) of Yokohama Bay Bridge identified from the records of 2004 Niigata-Chuetsu earthquake (d) Hinged-hinged mode (e) Fixed-fixed mode.78)
The Yokohama Bay Bridge’s responses were also recorded during the 2011 Great East Japan (Tohoku) Earthquake.79) The ground motion lasted more than 3 min, and a maximum girder horizontal response of 60 cm was observed. Although the LBCs functioned properly during this earthquake, periodic spikes (Fig. 30) indicated the occurrence of transverse pounding between the tower and girders. In the monitoring of long-span bridges subject to strong motion, the previously mentioned spiky waveforms are frequently reported; one example is the spiking response reported at the Minato Bridge during the 2004 Kii Peninsula earthquake (Mw 7.4).82) This transverse pounding phenomenon is not well-treated in conventional seismic design.

(Left) Photo of LBC at tower of Yokohama Bay Bridge and monitoring system. (Right) Observed seismic record at the 2011 Great East Japan (Tohoku) Earthquake. (a) Accelerations of tower at deck level during the main shock showing spike indicating impulses (b) time interval between successive lateral poundings.79)
The Yokohama Bay Bridge was closed for 30 hours after the earthquake due to an overturned cargo truck on the lower deck. The girder transverse vibration caused the truck to become unbalanced and overturned. Even if no major structural damage was observed, traffic disruption due to excessive vibration can cause human losses. Just as wind monitoring data is used to regulate traffic during strong wind conditions, earthquake monitoring and early warning data should also be incorporated into traffic control to reduce this risk.
The Yokohama Bay Bridge monitoring system is almost 30 years old. Amazingly, although some of its sensors have malfunctioned, many are still operational. The highway corporation is now considering replacing the system with a new one. An inexpensive real-time monitoring system that can be used for the immediate assessment of the bridge’s condition after large earthquakes is highly desired, and the corporation is conducting research and development for this purpose.
3.3 Monitoring of performance of base-isolated bridges and buildings.Monitoring for design verification is especially important to ensure the satisfactory seismic performance of newly adopted technologies. One example is seismic monitoring for base-isolated structures. Base-isolation technology has been widely adopted for bridges and buildings after the 1995 Kobe Earthquake.83) This technology reduces natural frequency to avoid severe seismic load and increases damping to suppress dynamic response. Ensuring the intended seismic performance of base-isolated bridges was a critical issue in the early phase of technology adoption. For this purpose, Chaudhary et al.84),85) examined seismic records from the monitoring systems of three base-isolated bridges during the 1995 Kobe Earthquake: Matsunohama Viaduct, Yamaage Bridge, and Onneto Bridge. While these authors confirmed that the base-isolation bearings performed their intended function satisfactorily, they found inconsistencies between the system-identified and experimental values of the base-isolation bearings’ stiffness and damping coefficient. These discrepancies are attributed to the unexpected behavior of the metal bearings and transverse side stoppers. The study concluded that structural details can appreciably change the global response of base-isolated bridges and that proper attention should be devoted to the design and construction of these components to obtain desired performance in such bridges during earthquakes.
For flexible structures such as high-rise buildings or buildings with seismic-control devices, seismic monitoring systems provide opportunities to evaluate possible damage or failure, weakening of components, and the serviceability performance of the structure during an earthquake. Excessive vibration in some parts of a structure may be a concern for some buildings, and this can be detected from continuous monitoring. Such vibration can be caused by the characteristics of input ground motion, soil conditions, and structural geometry, and by reviewing the structure’s responses, remedial action can be taken. Such a case was observed from the monitoring of an SIT base-isolated building in the Tokyo area during the 2011 Great East Japan (Tohoku) Earthquake.86),87) The study shows that, although the base-isolation system functioned properly during various earthquakes between 2010 and 2012 that included several large excitations, the benefit of the isolation system in reducing the floor acceleration of the upper stories was not fully achieved. Significant amplifications of response in the upper stories were recorded due to the dominant torsional characteristics of the building and resonance with ground motions. Using over 140 recorded earthquakes between 2010 and 2012, the study observed the prolonged effect of reduction in natural frequency. This observation was caused by reduced stiffness in the isolator system as the result of temporary and recoverable reduction in modulus due to the cyclic straining history on rubber, commonly known as the Mullins effect.86),87)
Monitoring systems have been used to confirm the seismic performance of various buildings with seismic isolation and response control devices during the 2011 Great East Japan (Tohoku) Earthquake. Lessons learned from the earthquake indicate that in large cities with many skyscrapers, it is important to prevent confusion in the event of an earthquake by making early decisions about the damage to a building and the possibility of its continued use. Building developers and managers of many high-rise buildings have deployed monitoring systems such as accelerometers in skyscrapers to understand earthquake tremors and their effects on high-rise building conditions. One notable example is a system deployed in twelve high-rise buildings managed and operated by Mori Building, including the Roppongi Hills Mori Tower88) (Fig. 31). In this system, story drift angle and acceleration at each floor of the building were estimated in real time using information from accelerometers (Fig. 32), confirming the efficacy of the installed damper devices. Based on the results, an instantaneous diagnostic system was developed to infer the internal structural condition, and the equipment was installed in the buildings.
Roppongi Hills (height 238 m) in Tokyo and its monitoring system.88)

Response displacement during 2011.3.11 Eq. at the top floor and calculated response without no damping device (critical damping ratio = 0.01(assumed)).88)
A survey conducted on such buildings in various locations in Japan demonstrated the general effectiveness of seismic protection technologies such as seismic base isolation and supplemental damping systems during the 2011 Great East Japan (Tohoku) Earthquake.89) Kasai et al.90) studied the responses of passively controlled tall buildings in Tokyo based on the motions recorded during the 2011 Great East Japan (Tohoku) Earthquake by their seismic monitoring systems. These buildings have steel dampers, oil dampers, viscous dampers, or a combination of these devices. By analyzing these records, the effects of damping on seismic responses were quantified, and the necessity of adding supplemental damping systems to existing conventional tall buildings was explored.
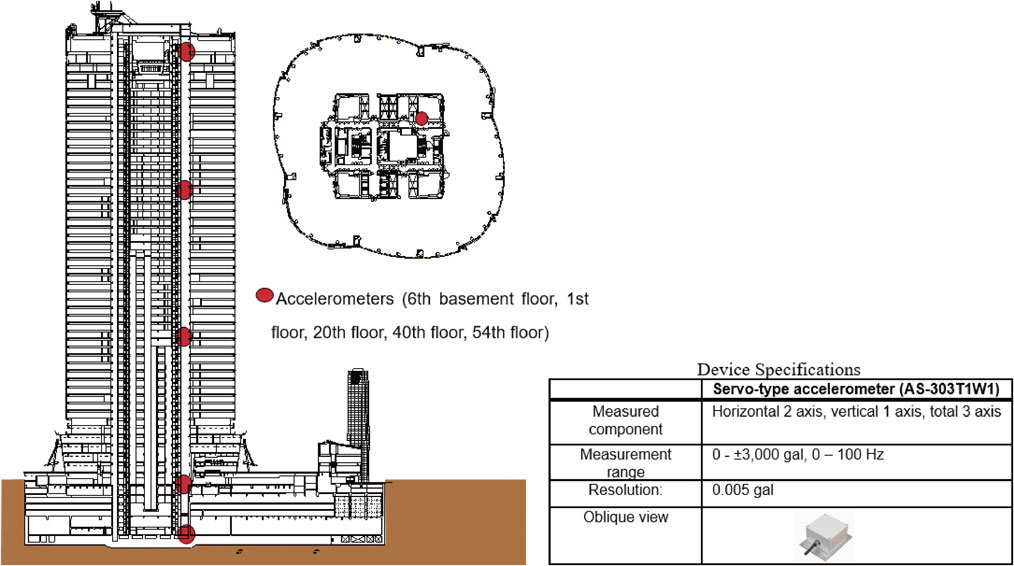
One critical issue in the seismic responses of high-rise building is long-period ground motion excitation. During the 2011 Great East Japan (Tohoku) Earthquake, the 55-story Sakishima Office Building (SKS) located on the coast of Osaka Bay was shaken extensively by long-period ground-motion. Remarkably, the building — the tallest in western Japan at the time of the earthquake — was 700 km away from the epicenter of the earthquake. Through a seismic monitoring system of triaxial accelerometers installed at four stories and on the ground, the vibrations of the building were recorded. The ground motion resonated with the building’s natural period at 6.5–6.9 seconds, resulting in long-period vibration with a peak acceleration of 126 cm/s2 at the 52nd story (Fig. 33). This motion corresponded to displacement at the top of more than 1.3 m. The excessive deformation of the building caused problems to elevator wires, as well as the breakage of sprinklers and other nonstructural components.91) Analysis of seismic records attributed the amplification of long-period ground motion in the Osaka Bay area during the earthquake to the topographic subsurface irregularity of the sedimentary basin structure of the Osaka Plain.92)
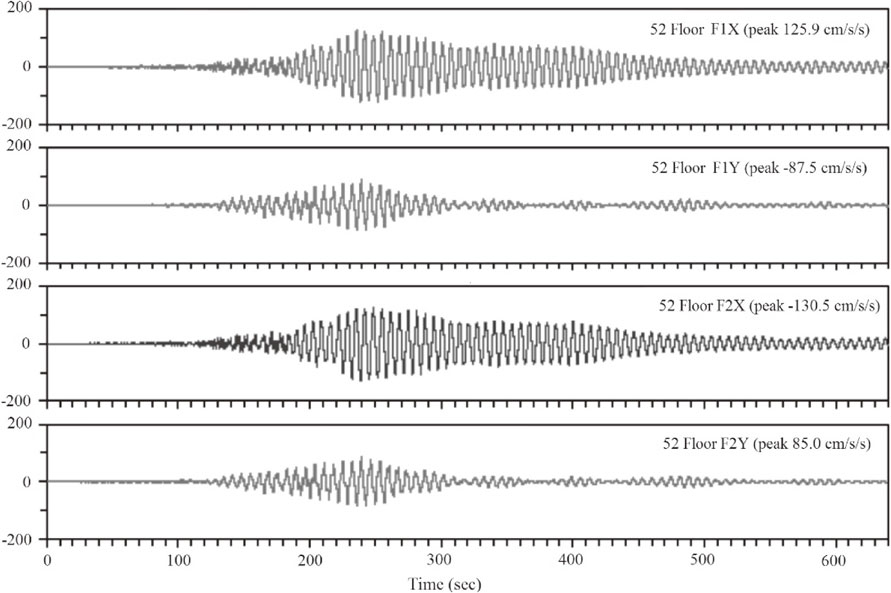
Acceleration records at SKS Building during the 2011 Great East Japan (Tohoku) earthquake.91)
In the Tohoku area, the very extensive shaking and long duration of the 2011 earthquake resulted in damage to several buildings. One of these damaged buildings was the 9-story building housing the Departments of Civil Engineering and Architecture in the Faculty of Engineering at Tohoku University. The building has a monitoring system, and long-term monitoring of dynamic characteristics has been performed by strong motion observation, forced vibration test, and microtremor observation. By analyzing the recorded accelerations and employing system identification techniques to evaluate stiffness, degradation and damage to the building could be confirmed.93) This example is a rare case in which damage to an actual building could be observed from a seismic monitoring system.
An extension from structure performance evaluation using seismic monitoring data is detecting possible damage due to earthquakes. Various techniques have been explored to use seismic records as structural damage indicators by observing changes in damage-associated features such as stiffness degradation, increased damping, excessive deformation and acceleration, and nonlinear responses. These features can be extracted directly from responses by online or offline system identification techniques or using more sophisticated damage identification algorithms. One such application is the use of the performance curve of the predominant response, indicating the relationship between the equivalent force and equivalent displacement, to evaluate the dynamic structural response using the wavelet transform method. Using this method, stiffness degradation associated with damage can be detected.94)
Structures are generally subject to moving loads. Bridges in particular are subject to vehicular loads such as cars and trains, as well as pedestrian loads. The effectiveness of vibration-based structural monitoring to clarify the mechanism of these vibrations is demonstrated through two cases.
4.1 Case 1: Pedestrian-induced vibration.Wind-induced vibration, such as vortex-induced vibration and flutter, is characterized by motion feedback forces, i.e., motion-dependent forces. Similarly, human walking possesses an adaptive feedback nature that creates motion-dependent human walking forces on bridges. In pedestrian bridges, it is well known that vertical periodic forces caused by human walking excite the vertical motion of the girders. The frequency of human walking is approximately 2 Hz (two steps per second), and the design code of Japan specifies that the natural frequency of the vertical modes should be outside the range of 1.7–2.5 Hz to avoid the resonance vibration of the girders. In addition to the vertical force, a small fraction of horizontal periodic force is generated by human walking because human beings use two legs, and its frequency is approximately 1 Hz.95) This force can potentially excite lateral motion of the girders if the natural frequency of the lateral modes is close to 1 Hz.95) However, the magnitude of the pedestrian-induced lateral force is very small, and it is believed that this force cannot excite bridges to significant amplitudes.
The problem of pedestrian-induced footbridge vibration came to the author’s attention in 1989, when the cable-stayed Toda Park Bridge (Figs. 1 and 34) showed a peculiar type of lateral vibration during the passing of a congested crowd. This bridge is located at a boat race stadium, and after big races, 20,000–30,000 spectators cross the bridge in a short duration of time, occasionally creating a very crowded bridge.

To understand the cause of this peculiar vibration, accelerometers were installed on the girders and cables to record the vibration of the bridge during the passing of a congested crowd that lasted for 20–30 minutes. The lateral motion of the girders took several minutes to develop to a significant level. The frequency of this lateral motion was approximately 1 Hz, nearly equal to the first lateral natural frequency of the girders. The vibration was quantitatively measured, but its cause could not be understood. A few months later, a video camera was installed at the guest room of the stadium building adjacent to the bridge to monitor the pedestrians’ walking (Fig. 34).96)
The walking pattern of individual pedestrians was digitized from the video through image-processing techniques. The results revealed that human walking tends to synchronize with the lateral motion of the girders. Therefore, as the amplitude of the lateral girder motion increases, the human walking frequency is synchronized to the frequency of the lateral motion, and a greater number of pedestrians become synchronized to the girder motion.96) Approximately 2,000 pedestrians were on the bridge, and although their individual forces were small, the combined forces of several hundred individuals was sufficient to excite a lateral motion of several centimeters in amplitude. To understand the pedestrian-induced force mechanism, a pedestrian walking on a bridge can be modeled by a pendulum walking model consisting of a lumped mass at the pedestrian’s center of gravity supported by rigid, massless legs. A nonlinear model of lateral pedestrian force was proposed, and the lateral forces exerted by actual walking pedestrians agreed well with the ones calculated by the model.97),98) Video monitoring of the bridge vibration was extremely helpful for understanding the vibration mechanism. The vibration in this bridge was suppressed by tuned liquid dampers (TLD) that were installed inside the box girder.96),99)
Similar vibration has been observed in other pedestrian bridges, such as the Solferino Bridge100) in Paris in December 1999 and the Millennium Bridge in London in June 2000 (Fig. 35).101) Because of this excessive pedestrian-induced lateral vibration, the bridges were closed immediately after their opening. Both bridges had a lateral natural frequency close to 1 Hz. This synchronization phenomena attracted great attention from both bridge engineers and the nonlinear science community. Many studies on modelling synchronization between pedestrians and bridges were conducted,102)–104) and this phenomenon was described in many books.105),106)
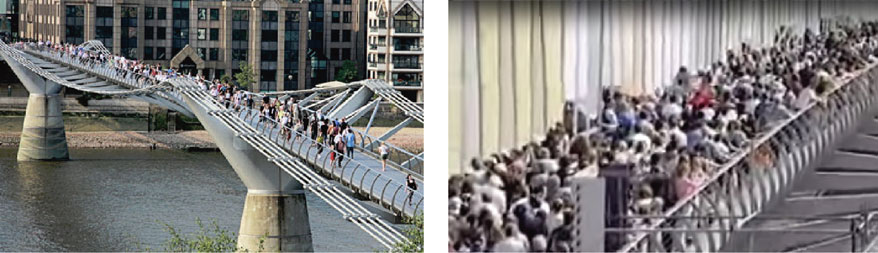
Millennium Bridge crossing Thames River in London, UK.
In the Japanese high-speed train system, special inspection trains installed with various measuring instruments have been used regularly to monitor rail irregularity, ride comfort, and other factors. Several PRC (prestressed reinforced concrete) girders in a series of viaducts have revealed large vibration under the passage of inspection trains. To investigate the cause of this large vibration, monitoring of more than 10 girders under train passage using laser Doppler vibrometers (LDVs) was conducted. One advantage of using LDVs is that they can measure vibration at many points by high-speed, noncontact scanning, as shown in Fig. 36. This approach obtained detailed and accurate vibration modes for the girders, allowing for very detailed and accurate modeling. This monitoring clarified the complex nonlinear vibrational characteristics of the PRC girders and allowed the selection of reasonable remedy measures.107)
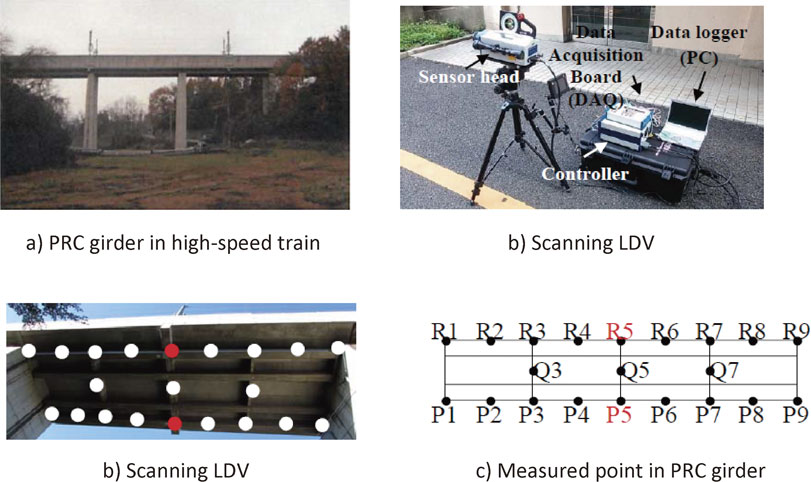
Dense measurement of train-induced vibration in PRC girder.107)
Another example involves the fatigue damage appearing in the stiffeners of steel box girders. To capture the detailed vibrational deformation of the steel box girders, monitoring of the dynamic spatial deformation of low flange plates under the passage of trains was conducted using LDVs,108) as shown in Fig. 37. The thin wall plates of the box girders vibrated in a flexural manner as membranes (Fig. 37(c)). This deformation generated large local stress in the stiffeners, resulting in fatigue cracks.
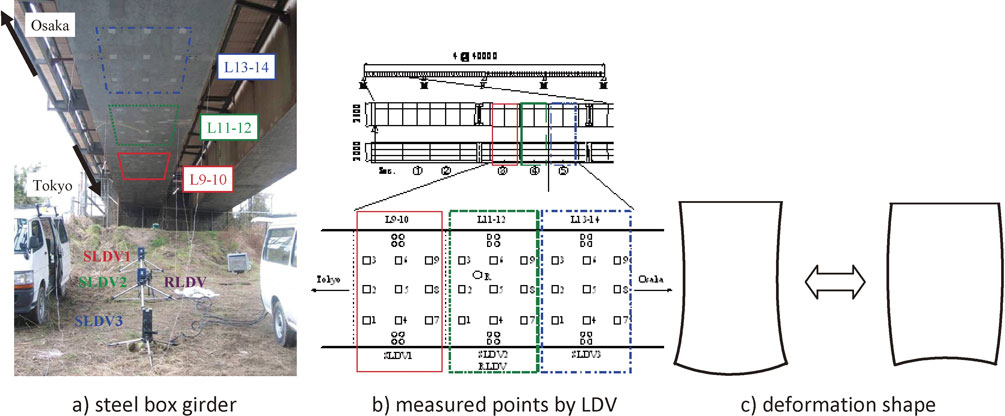
Detailed spatial measurement of high-speed-train-induced vibration of steel box girder.108)
As discussed in this paper, vibration-based monitoring has a very wide range of applications. A system to identify scouring around railway bridge piers has also been proposed.109) In any vibration-based monitoring, it is very common to use accelerometers, and sensor technology is expected to continue its recent development. Microelectricalmechanical systems (MEMS) technology brought more compact, lower-price accelerometers. While the resolution of currently available MEMS accelerometers is on the order of mg, the vibration-based monitoring of civil structures often requires more than 100 times that resolution; further development in resolution is expected. To understand the local performance of civil structures, a considerable number of sensors may need to be deployed. In such cases, cabling becomes a burden, and wireless communication among energy self-sufficient sensors is highly desired. Low-power wireless communication with moderate throughput has been intensively studied, and multihop communication to cover large areas is becoming available.110)–112)
In the case of vibration-based monitoring, large amounts of dynamic response data must be transmitted to the main station using multihopping within a short time, which poses a technical challenge. A new communication technique known as concurrent transmission flooding (CTF) is being improved for practical application113)–115) and is expected to provide a solution. Reliable wireless technology will drastically change the monitoring environment, and hopefully this technology can be realized in the very near future.
Availability of a sustainable power supply is one of the most challenging aspects in the deployment of a large-scale, multihop-synchronized dynamic monitoring system.116) Although the battery life of sensors can be extended by efficient power management, data condensation, and in-network processing, ordinary batteries still require regular replacement. Recent research has aimed to develop more efficient sensors that require less power consumption and use independent, localized energy harvesters such as solar panels.
The development of new types of indirect sensing, such as monitoring by vision chips, is also remarkable and very promising. A high-speed vision sensor developed by Ishikawa, can identify the cracks in tunnels even while travelling in a vehicle at 100 km/h.117) A vision chip with image sensing and processing circuitry that can capture high-speed motion has been also developed.118) Such vision sensors are inexpensive, indirect, and noncontact and allow researchers to capture the motions of various objects.
Vibration-based monitoring has so far been applied mainly to flexible structures such as bridges and buildings, as discussed in this paper. The use of vibration to detect damage and defects in ordinary, more rigid structures is also possible. Indeed, research and development on vibration-based damage detection are actively underway. One example is the use of lasers to detect holes and invisible cracks in the lining of concrete tunnels. This approach dynamically excites the lining surface using a strong laser and monitors surface vibration using another laser. This noncontact, indirect procedure can be conducted by a moving vehicle instrumented with laser equipment. Another example is monitoring the condition of road pavement by the vibration response of the accelerometer installed in a mobile phone in an ordinary moving vehicle.119) Monitoring pavement condition through video and image processing is also possible using vehicles.
This paper has presented the state of the art in vibration-based monitoring for the performance evaluation of flexible civil structures such as bridges and tall buildings in Japan. Because all civil structures are basically constructed individually and are placed under severe environments for many years, it is very important to understand the real performance of these structures under real loading, providing a realistic performance evaluation of existing structures. Vibration-based monitoring plays a significant role because dynamic response is strongly associated with the safety and serviceability of flexible civil structures.
In the past few decades, monitoring has evolved to employ continuous and permanent installations throughout a structure’s lifetime. Continuous monitoring provides data on a structure’s behavior under various loading and environment conditions, including unexpected extreme events. This paper has presented many examples of vibration-based monitoring and described the lessons learned from this monitoring. Monitoring has been shown to be particularly useful for understanding real structural behaviors in depth, revealing unknown factors that were not considered in design and providing structural information for necessary retrofits after extreme events.
New technological developments in vibration-based monitoring, such as wireless communications and energy harvesting, are ongoing. In the near future, the cost of vibration-based monitoring, including maintenance and data processing, will be fundamentally reduced, thereby increasing its availability. Current vibration-based monitoring uses vibration sensors, typically accelerometers. However, remarkable developments in new types of sensors such as vision and image-based sensors, lasers, and radar should encourage the pursuit of noncontact, indirect monitoring of civil structures for maintenance and management.

Yozo Fujino was born in Tokyo in 1949. He received his Bachelor’s degree and Master of Engineering degree (both in Civil Engineering) from the University of Tokyo in 1972 and 1974, respectively. He obtained his Ph.D. (Civil Engineering) from the University of Waterloo, Canada, in 1976. He joined the Earthquake Research Institute at the University of Tokyo in 1977 and moved to the Institute of Structural Engineering at the University of Tsukuba in 1978. In 1982, he joined the department of Civil Engineering at the University of Tokyo as an associate professor and was promoted to professor in 1990. Since 2014, he has served as a Distinguished Professor at the Institute of Advanced Sciences at Yokohama National University. His area of expertise comprises dynamics, control and monitoring of bridges, and earthquake- and wind-related effects on structures. He is also strongly interested in cable-supported long-span bridges. He has been invited as an adviser to many large bridge projects, including the Akashi-Kaikyo Bridge and Tatara Bridge in Japan, Millennium Bridge (vibration control) in the UK, Stonecutters Bridge in Hong Kong, and Padma Bridge in Bangladesh. He has received many awards, with recent honors including the Medal with Purple Ribbon (2007), Hoko Award (2015), and the Raymond C. Reese Research Prize (2007), R.H. Scanlan Medal (2011), and George Winter Medal (2015) from the American Society of Civil Engineers (ASCE). He served as Science Adviser for the Ministry of Education, Culture, Sports, Science and Technology (MEXT), Japan, from 2002 to 2004 and Senior Program Officer of the Japan Society for the Promotion of Science (JSPS) from 2009 to 2012. Since 2013, he has been Program Director of the Strategic Innovation Program “Infrastructure Maintenance, Renovation and Management Technology” for the Council on Science, Technology and Innovation, Cabinet Office.
I would like to express my sincere appreciation to many of my colleagues and friends for their great contributions in preparing this manuscript. Research and discussions with Dionysius Siringoringo (Yokohama National University) and Tomonori Nagayama (the University of Tokyo) were extremely informative, and their checking of my manuscript was very helpful. Hiroshi Katsuchi and Hitoshi Yamada (Yokohama National University), as well as Masaharu Yasuda (Mori Building Corporation), permitted me to use their figures in this paper. Advice from Masato Abe (BMC Corporation) was highly appreciated. Yukio Tamura (Tokyo Polytechnic University) provided me with valuable information on the monitoring of wind-induced responses in buildings and tall structures, and my discussion with him was also very informative. Valuable information on the monitoring of earthquake-induced vibration in buildings was provided by Koichi Kusunoki (Earthquake Research Institute, the University of Tokyo), as well as Akira Wada and Kazuhiko Kasai (Tokyo Institute of Technology).
Some of the figures and photos used in this paper are included with the consents from the original authors, owners or contractors. I would like to express my gratitude and appreciation for their kindness.