Abstract
Iron plays many important roles in the brain, including involvement in myelination, neurotransmission and electron transfer in the respiratory chain. Transferrin (Tf), an iron transporter, is mainly biosynthesized in the liver, but can also be biosynthesized in the brain; i.e., by oligodendrocytes and the choroid plexus, a cerebrospinal fluid (CSF) producing tissue. The CSF contains two Tf isoforms, brain-type Tf and serum-type Tf, which differ in their glycan structures. Brain-type Tf is uniquely glycolsylated with biantennary asialo- and agalacto-complex type N-glycans that carry bisecting β1,4-GlcNAc and core α1,6-Fuc. The glycans of serum-type Tf in the CSF are similar to those of Tf in serum. Biochemical analyses reveal that the apparent molecular size of brain-type Tf is smaller than that of serum-type Tf, and that hydrophobic patches are exposed on brain-type Tf as demonstrated by hydrophobic probe binding studies. We found that brain-type Tf levels were decreased in idiopathic normal pressure hydrocephalus, in which CSF production is suspected to decrease, while brain-type Tf increased in spontaneous intracranial hypotension, in which CSF production is suspected to increase. These results suggest that brain-type Tf could be a biomarker of altered CSF production.
Communicated by Kunihiko SUZUKI, M.J.A.
Abbreviations: APP: amyloid precursor protein; CNS: central nervous system; CP: choroid plexus; CSF: cerebrospinal fluid; FAB: frontal assessment battery; Ig: immunoglobulin; iNPH: idiopathic normal pressure hydrocephalus; L-PGDS: lipocalin-type prostaglandin D synthase; MMSE: mini-mental state examination; RI: radioisotope; sAPP: soluble amyloid precursor protein; SDS-PAGE: sodium dodecyl sulfate–polyacrylamide gel electrophoresis; SIH: spontaneous intracranial hypotension; Tf: transferrin; TTR: transthyretin.
Introduction
Iron is an essential nutrient for physiological processes throughout the body, including the brain. Oligodendrocytes require iron for myelination and store large amounts of ferritin-bound iron. In contrast, astrocytes retain less iron.1) As a multi-purpose nutrient, iron is involved in oxygen transport, electron transport and many other fundamental physiological processes.2) However, free iron results in cellular toxicity by generating harmful reactive oxygen species (ROS).3) Iron, therefore, needs to bind to specific carrier proteins such as transferrin (Tf) in the extracellular fluid and blood.4),5) Tf is a single polypeptide chain with 679 amino acid residues, consisting of two homologous N- and C-terminal domains.6) Each domain has a metal binding pocket with high affinities for ferric iron, which are crucial for preventing ROS generation and subsequent cell damage.
Central nervous system (CNS) iron is mainly derived from blood Tf.7) However, the CNS is separated from the systemic circulation by the blood-brain barrier (BBB), which is comprised of endothelial cells, basement membrane, pericytes and astrocytic processes. Blood Tf binds to transferrin receptor 1 (TfR1) on endothelial cells lining blood capillaries and the binding complex is internalized into endosomes (Fig. 1).2) After internalization of the Tf/TfR1 complex, the iron dissociates from Tf in an acidic endosomal compartment. The iron-free transferrin (apotransferrin) together with TfR1 is then transported back to the plasma membrane where it is released into the blood to participate in further rounds of iron mobilization and delivery. Ferric iron (Fe3+) released from Tf is reduced to ferrous ion (Fe2+) by endosomal reductase, with the Fe2+ then transported across the endosomal membrane into the cytosol by the divalent metal transporter, DMT1.4) The Fe2+ is further exported to the abluminal side by ferroportin. The exported Fe2+ is oxidized to Fe3+ by the astrocytic ferroxidase, glycosylphosphatidylinositol (GPI)-anchored cerulopasmin. Parenchymal Fe3+ immediately binds to Tf, thereby preventing ROS generation. In this way, Fe3+ carried by blood Tf is transported to parenchymal Tf via endothelial cells (Fig. 1).

Neurons express high levels of TfR1, which binds the Tf/Fe3+ complex to be internalized. After internalization, the iron is released and either stored as ferritin-bound iron or passed into the mitochondria, where iron is incorporated into haem and iron-sulphur clusters. There are two possible pathways that Tf can follow after the internalization; one is “recycling” in the brain interstitial fluid, as is the case for blood Tf, and the other is degradation in neurons. It remains to be clarified, however, which pathway is dominant in the neuron. In contrast to neurons, oligodendrocytes and astrocytes take up iron as non-transferrin-bound iron (NTBI), in which Fe2+ binds to ATP, citric acid and ascorbic acid (Fig. 1).
It was demonstrated that Tf is biosynthesized by neural cells such as oligodendrocytes and CSF-producing epithelial cells in the choroid plexus. Blay et al. reported that Tf mRNA is expressed in choroid plexus epithelium,8) while De Arriba Zerpa et al. reported that Tf mRNA in rat primary cultured oligodendrocytes is spliced and lacks the N-terminal signal sequence. These findings suggest that Tf proteins produced by oligodendrocytes reside in the cytosol and are not secreted.9)
Transferrin and its glycan isoform in cerebrospinal fluid (CSF)
When the protein compositions of human serum and cerebrospinal fluid (CSF) are compared using sodium dodecyl sulfate–polyacrylamide gel electrophoresis (SDS-PAGE) followed by silver staining, the major CSF protein bands are similar to those in serum except for the added presence of lipocalin-type prostaglandin D synthase (L-PGDS) and transthyretin (TTR) (Fig. 2A). The result is consistent with a previous report showing that 80% of CSF proteins are derived from the serum.10) The specimens were also examined by Western blot analysis using antibodies against serum glycoproteins with a view to detecting CSF-specific isoforms. Indeed, Western blot analysis using anti-Tf antibody detected two isoforms in CSF: one with a similar migration position to serum Tf and the other with a faster migration position (Fig. 2B). This latter isoform is named “brain-type” Tf, also designated as asialo-Tf or Tf-1, while the former isoform is named serum-type Tf sialo-Tf or Tf-2.11)–13) The concentrations of brain-type and serum-type Tf, quantified by chromatoscanning Western blots, were 8.0 ± 3.9 µg/mL and 18.6 ± 5.6 µg/mL, respectively (n = 10).

Migration speed differences can often be detected for different glycan isoforms carried by the same protein. To analyze the glycan structures of purified Tf isoforms, the glycans were liberated by N-glycosidase F treatment and derivatized to pyridylamino (PA)-glycans for mass spectrometry (MS) analysis. MS analysis of the PA-glycans revealed a major peak for brain-type Tf glycan at m/z 1766.6. Tandem mass spectrometry analysis of the major peak revealed a fragmented pattern that was similar to that of authentic biantennary asialo- and agalacto-complex type N-glycans that carry bisecting β1,4-GlcNAc and core α1,6-Fuc (Fig. 2D, lower panel). In contrast, glycans from serum-type Tf were similar to those of serum transferrin, i.e., MS analysis revealed that the major peaks of the desialylated PA-glycans from serum-type Tf and those from serum transferrin were at m/z 1741.96 and 1741.94, respectively (Fig. 2D, middle and upper panels). Glycan structures of serum, serum-type, and brain-type Tf were further analyzed by lectin microarray, which revealed the presence of α2,6-sialyl residues on serum-type Tf.
Serum-type Tf has sialylα2,6galactosylβ1,4N-acetylglucosamine (GlcNAc) at its non-reducing end whereas brain-type Tf has a truncated or GlcNAc-terminated glycan, which is a brain-type glycan. The truncation is speculated to be due to the low expression of β1,4galactosyltransferase in the brain.14) Nakakita et al. reported that brain-type glycan accounts for 5.3% of total N-glycans in the mouse brain,15) indicating it is specific to the brain. Indeed, the glycan is carried by several brain-derived proteins such as prostaglandin D synthetase16) and β-secretase (or BACE1).13)
Effect of glycan structure on physicochemical properties and functions of transferrin
Glycosylation may stabilize proteins by providing a surface cover consisting of intramolecular glycan–polypeptide interactions and possibly inducing a conformational change in the polypeptide, resulting in glycan-dependent molecular properties and functions.17) To test this hypothesis, we subjected Tf isoforms to comparative biochemical analyses and found that the apparent molecular size (hydration volume) of brain-type Tf is smaller than that of serum-type Tf based on size exclusion chromatography (Fig. 3A).18) Fluorescence correlation spectrometry analysis revealed that the hydrodynamic radius of brain-type Tf was smaller than of serum Tf, which was consistent with the size-exclusion chromatography data. These results suggested that the conformation of brain-type Tf is changed by a unique glycan. The isoform was, therefore, subjected to X-ray crystallographic analysis; however, the conformation of the polypeptide main chain (data not shown) was very similar to that of a previously reported Tf structure,19) PDB code 3V83. We subsequently examined the surface properties of isoforms using the fluorescent probe ANS (1-anilino-8-naphthalenesulfonate), which has been widely used to monitor transitions in proteins owing to its affinity for partially exposed hydrophobic regions.20) Addition of ANS to brain-type Tf induced a marked enhancement of fluorescence,18) with a maximum at 492 nm (Fig. 3C). In contrast, ANS shows only weak fluorescence with serum Tf at 504 nm. ANS alone shows weak fluorescence at 508 nm. The strong, red-shifted fluorescence of ANS in the presence of brain-type Tf suggests that it binds to an exposed hydrophobic surface or pocket in this Tf isoform.

Next, we examined functional differences in Tf isoforms. The most evident function of Tf is its high affinity binding to ferric iron. Equilibrium dialysis analysis using 59Fe revealed that the isoforms did not show any apparent difference in iron binding affinity (unpublished data). The isoforms were further examined for their binding to TfR1, which was stably expressed on CHO cells. Again, the isoforms did not show any difference in binding affinity for the receptor (unpublished data). Although Tf glycans influence physicochemical properties such as the hydration volume and exposure of hydrophobic patches, they did not affect any of the functions we examined. Further analyses are required to identify potential functional differences between the isoforms.
Histochemistry using anti-Tf antibody and lectins
To examine the origin of brain-type Tf, we analyzed the CSF of patients with hydranencephaly, a congenital malformation of the brain. In hydranencephaly, the cerebral hemispheres are absent due to bilateral occlusion of the internal carotid arteries, whereas the midbrain, cerebellum and other brain structures nourished by the vertebral artery may remain.21),22) Brain-type Tf was decreased markedly in the CSF of hydranencephaly patients, indicating that brain-type Tf is derived from the cerebrum (Fig. 2C).23)
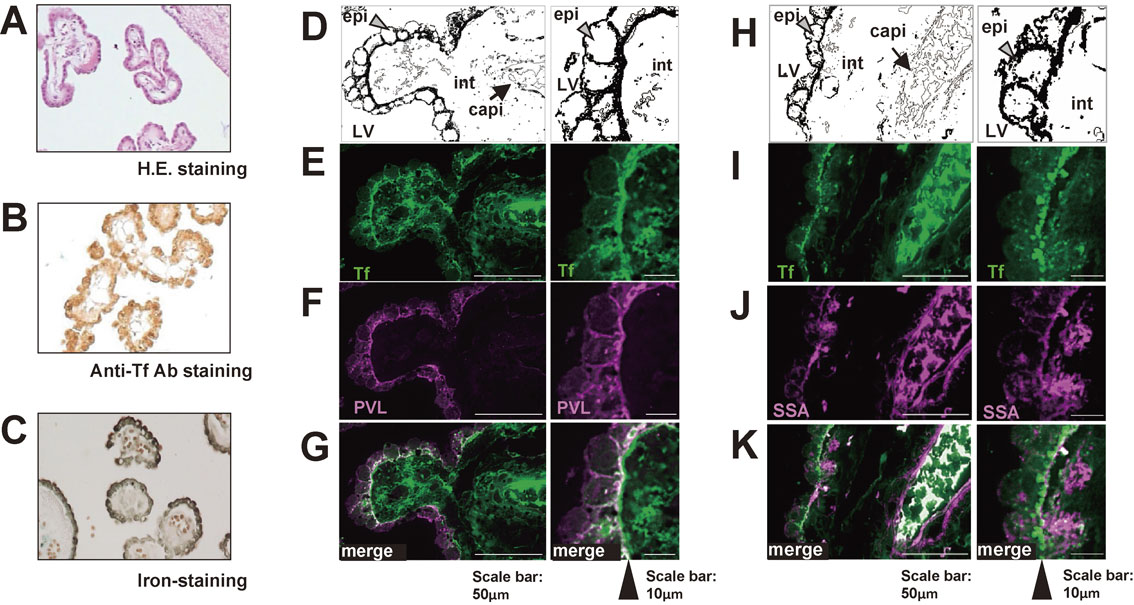
We next examined the localization of Tf in the human cerebrum. Immunohistochemistry using anti-Tf antibodies revealed that the most intense signal was detected in the choroid plexus epithelium (Fig. 4A, B). Perls' staining to detect iron also revealed strong signals in the choroid plexus epithelium (Fig. 4C), suggesting that holo-Tf (iron-saturated form of Tf) is formed in the epithelium and secreted into the CSF. To analyze glycan(s) expressed by the epithelium, the choroid plexus was stained with two types of lectin; one was Psathyrella velutina lectin (PVL), which is specific to GlcNAc-terminated glycan;24) and the other was Sambucus sieboldiana agglutinin (SSA), which is specific to α2,6-sialyl-terminated glycan. The choroid plexus was first co-stained with PVL lectin and Tf-antibody, with the latter staining portions of the choroid plexus epithelium, interstitial tissues and capillary blood clots (Fig. 4E, left panel). High magnification imaging showed preferential staining of basolateral aspect of the epithelium, with minimal staining of apical aspect (Fig. 4E, right panel). The basolateral signals partially overlapped with those of PVL signals (Fig. 4G, right panel). Other areas were minimally stained with PVL lectin, suggesting that GlcNAc-terminated glycoproteins are localized specifically in the epithelium (Fig. 4F). Next, the choroid plexus was co-stained with SSA lectin and anti-Tf antibody. SSA strongly stained some interstitial tissues and blood clots (Fig. 4J, left panel), with SSA staining substantially overlapping with strong anti-Tf antibody positivity (Fig. 4K, left panel). In contrast, the majority of SSA staining on basolateral portions of the epithelium did not overlap that of Tf antibody (Fig. 4K, right panel). These results suggest that the epithelium specifically expresses GlcNAc-terminated glycoproteins in choroid plexus tissue and possibly produces brain-type Tf.23)
Changes in brain-type transferrin in neurological disease
Idiopathic normal pressure hydrocephalus (iNPH).
Patients with idiopathic normal pressure hydrocephalus (iNPH) have excess intracranial CSF, which compresses the brain parenchyma. Resulting in cognitive impairment, gait disturbance, and urinary incontinence among the major symptoms. In iNPH, excess CSF may decrease further CSF production.25) At least two CSF biomarkers have been identified for iNPH. These include L-PGDS, which is mainly produced by the leptomeninges, arachnoid membrane, and choroid plexus,26) while soluble amyloid precursor protein (sAPP) is secreted by neurons.27) L-PGDS and sAPP are decreased in the CSF of iNPH patients,28),29) which fits with a previous report by us.12) Brain-type Tf levels are decreased in the CSF of iNPH patients (Fig. 5A, B). The concentration of brain-type Tf in the CSF was quantified by chromatoscanning as shown in Fig. 5C. Patients with suspected iNPH can be further diagnosed by lumbar puncture or continuous lumbar drainage, in which excess CSF is temporally removed as a means to improvement symptoms. In continuous lumbar drainage, the patient undergoes continuous withdrawal of CSF for 6 days. Compared to day 0, the Tf isoform concentration increased from day 1–3 (126 ± 11%, not significant) and more conclusively from day 4–6 (143 ± 17%, p < 0.01) (n = 4), indicating that brain-type Tf production began to increase within a week of drainage onset (Fig. 5D). Data on serum-type Tf is not included in Fig. 5 because the lumbar drainage procedure may result in contamination with blood Tf, the concentration of which is 40–50-fold higher than that of CSF.

The long-term recovery of brain-type Tf was analyzed after shunt surgery for hydrocephalus. The isoform is markedly increased during post-operative months 1–3 and then gradually declines from months 6–24, suggesting that brain-type Tf is an indicator for the recovery of CSF production (Fig. 5E).30) In contrast, serum-type Tf levels showed subtle change in the CSF of iNPH patients after shunt surgery (data not shown). Serum-type Tf influx from the blood to the CSF probably occurs due to passive diffusion, meaning that its concentration before and after surgery does not change.31)
We found that neurological clinical grading scales in response to shunt surgery improved after 11.8 ± 7.7 months. When correlations between cognitive scales and CSF biomarkers were analyzed at various time points, brain-type Tf levels before shunt surgery showed low (r = 0.351, p = 0.042) and moderate (r = 0.527, p = 0.002) correlations with Mini-Mental State Examination (MMSE) and Frontal Assessment Battery (FAB) scores, respectively (Fig. 6A, B). At 3 months post-operative, the increase of brain-type Tf correlated strongly with MMSE scores (r = 0.697, p = 0.037) and FAB (r = 0.727, p = 0.041) scores (Fig. 6C, D; left panel). The increase of brain-type Tf at post-operative month 12 was moderately correlated with MMSE (r = 0.549, p = 0.022) but not with FAB (r = 0.373, p = 0.154) (Fig. 6C, D; right panel). Scores for the modified Rankin Scale were not correlated with brain-type Tf levels before or after shunt surgery (data not shown). Furthermore, the increase of sAPP in both the pre- and post-operative periods was not correlated with MMSE or FAB. Concentration of L-PGDS was not measured due to limitation for CSF specimen available for the analysis. These results suggest that brain-type Tf levels at post-operative month 3 (and 12) predicts recovery from cognitive deficits in iNPH patients.23)

SIH is commonly caused by leakage of the CSF. Patients with SIH often report orthostatic headache, dizziness, hearing disturbance, nausea and vomiting, and cervical pain. Cranial magnetic resonance imaging (MRI) of SIH patients revealed cranial hypotension-related manifestations such as diffuse pachymeningeal gadolinium enhancement, sagging of the brain, enlarged pituitary gland, descent of the brain stem, and subdural fluid collection. On radioisotope (RI) scintigraphy, findings include early accumulation of tracer in the bladder and kidneys, and a paucity of activity over the cerebral convexities. Myelography can show the location and extent of a CSF leak. While these abnormal findings are typical for SIH, 20–30% of SIH patients, however, do not show abnormalities in these clinical tests.32) We retrospectively studied CSF samples obtained by lumbar puncture of 62 consecutive patients suspected of intracranial hypotension. SIH was diagnosed based on the International Classification of Head Disorders, (3rd edition, beta version, http://beta.ichd-3.org/) and the diagnostic criteria reported by Schievink et al.33) In this way, 38 patients were classified as SIH and 24 patients as non-SIH. CSF samples were analyzed based on the groupings, along with the CSF samples of a neurological control group including patients with trigeminal neuralgia or unruptured cerebral artery aneurysm (n = 10).
Most CSF laboratory test results for the SIH and non-SIH groups were within reference intervals. Tests included osmolality, specific gravity, glucose concentration, chloride concentration, pH, and cell counts (leukocytes and erythrocytes). Only CSF protein concentration in the SIH was significantly higher than that of the non-SIH group (0.9 mg/mL versus 0.6 mg/mL, p < 0.001). In contrast, serum protein concentrations were not different between the two groups (p = 0.22). In the SIH group, the CSF protein concentration was not correlated with that of serum (r = 0.153, p = 0.367), suggesting that the increase in CSF protein level was independent of the serum protein levels.
To examine protein composition changes, CSF samples from the SIH and non-SIH patients were subjected to SDS-PAGE followed by silver staining (Fig. 7). Protein patterns were similar between the SIH and non-SIH groups, and composed principally of serum Tf (75 kDa), albumin (66 kDa), immunoglobulin heavy chain (Ig-H) (45–50 kDa area), and light chain (Ig-L) (25 kDa), L-PGDS, and TTR. While no apparent differences in protein composition were observed between the two groups, the signal intensity of each protein band, with the exception of the TTR bands, appeared to be increased in the SIH group. We therefore quantified these major proteins together with sAPP, a marker for CSF anomalies.

Albumin, IgG, total Tf, L-PGDS, TTR, sAPP, serum-type Tf and brain-type Tf were quantified by ELISA or Western blotting. Analysis of the data revealed that levels of these proteins, except for TTR, were significantly higher in the SIH than the non-SIH group (Fig. 7). TTR levels in the SIH and non-SIH groups were 24.8 µg/mL and 20.4 µg/mL, respectively, (p = 0.054). We performed statistical analyses on CSF proteins with a view to their potential use as differentiators (biomarkers) of SIH and non-SIH. Serum-derived proteins such as albumin, IgG, and serum-type transferrin showed differentiation sensitivities and specificities in the ranges of 76.3–78.9% and 70.8–79.2%, respectively, whereas the sensitivities and specificities of CNS-derived proteins such as L-PGDS, sAPP, and brain-type Tf ranged from 71.1–81.6% and 50.0–91.7%, respectively. Concentrations of serum albumin, IgG, and Tf were 40–70-fold higher than those in the CSF, suggesting that even slight contamination of blood disturbs the accurate estimation of the concentrations of these proteins. Based on these findings, we further analyzed CNS-derived proteins as preferred markers of SIH. Logistic regression analysis revealed odds ratios for L-PGDS, sAPP, and brain-type Tf of 9.15 (95%CI: 1.15–73.2, p = 0.036), 0.64 (95%CI: 0.13–3.1, p = 0.577), and 5.95 (95%CI: 1.01–35.1, p = 0.049), respectively. The combined use of L-PGDS and brain-type Tf differentiated SIH from non-SIH with a sensitivity of 94.7% and specificity of 72.6%.30)
In SIH, the intracranial pressure decreases due to the leakage of CSF (threshold; less than 60 mm H2O). Moreover, the concentration of radioisotope (RI) injected into the CSF decreases rapidly and is excreted in the urine. The cutoff for RI residual activity at 24 hours after RI injection is set at 20%. With these clinical tests established to differentiate SIH from non-SIH, we therefore examined correlations between them and CNS-derived protein levels. Significant correlations were observed between the test outcomes and L-PGDS or brain-type Tf. A decrease in RI residual activity was inversely correlated with increases of L-PGDS (r = −0.56, p < 0.001) and brain-type Tf (r = −0.50, p < 0.001). Decreased intracranial pressure was also inversely correlated with increased of L-PGDS (r = −0.56, p < 0.001) and brain-type Tf (r = −0.46, p < 0.001). No other proteins were correlated with intracranial pressure or RI residual activity.30)
CSF marker changes in iNPH and SIH
L-PGDS is mainly produced in the choroid plexus, leptomeninges, and oligodendrocytes, and then secreted into the CSF.26) It is then absorbed in the cranial arachnoid villi and flows into the dural sinuses.26) Mase et al. reported that L-PGDS levels were decreased in (idiopathic) normal pressure hydrocephalus.28) As described above, L-PGDS, brain-type Tf, and sAPP are all decreased in iNPH (Fig. 8B), where CSF production is also suspected to decrease. In contrast, these proteins increase in SIH (Fig. 8B), while CSF production is suspected to increase to compensate for CSF leakage. L-PGDS, brain-type Tf, and sAPP levels may thus change concomitantly with CSF production.

A possible explanation for the observed upregulation of brain-derived proteins in SIH patients is that the secretion of these proteins depends on CSF pressure or volume. As such, protein levels decrease in iNPH, in which the brain is compressed by excess CSF. As described above, brain-type Tf and sAPP were normalized or increased after shunt surgery, which bypasses excess CSF from the brain’s ventricles to the peritoneal cavity. This normalization suggests that CSF pressure or volume affect the secretion of the brain-derived proteins. Further research is required to clarify the exact molecular mechanisms underlying the increased levels of these proteins.
Blood brain barrier (BBB) and protein permeability.
CSF is sequestered from blood by the BBB. As a result, the protein concentration of the CSF is about 100-fold lower than in the blood. The barrier, however, is leaky, even under normal physiological conditions. Indeed, about 80% of CSF proteins are derived from the blood,10) with this influx probably due to deficiencies in BBB structures. To this end, pericapillary lamellar processes of astrocytes are not observed in several paraventricular structures such as the posterior pituitary gland (neurohypophysis) and the pineal body.34) Under conditions of intracranial hypotension, the influx of different proteins depends on various factors such as their concentration in the blood, their molecular size, and interaction with other molecules. The increase of CSF protein levels in SIH is mainly attributable to albumin, which is biosynthesized exclusively in the liver and then secreted into the blood, suggesting that the increase in albumin is due to enhanced influx from the blood into the CSF. An enhanced inflow is also seen with IgG, which is mainly produced in the extra-neural lymphatic tissues. Other blood proteins such as serum Tf could flow into the CSF down their concentration gradient.30)
Conclusion
We hypothesize that brain-type Tf secreted from the choroid plexus could be a biomarker of altered CSF production, and as such, useful for diagnosing iNPH. In addition, it may be also applicable to monitoring the normalization of CSF production after shunt surgery and for predicting cognitive recovery. This marker could also be useful for diagnosing SIH, where a marker with high sensitivity and specificity has not been available until now.
Acknowledgments
This work was supported in part by Japan Agency for Medical Research and Development (AMED) [grant numbers 16hm0102042h0001 and 17hm0102042h0002 and 18hm0102042h0003]; the Japan Science and Technology Agency [grant numbers AS221Z00232F, AS231Z01053, 241FT0255, ad 149]; the Ministry of Education, Culture, Sports, Science, and Technology of Japan [a Grant-in-Aid for Scientific Research on Innovative Areas, grant number 23110002 (Deciphering sugar chain-based signals regulating integrative neuronal functions), and a Grant-in-Aid for Scientific Research, grant number 23590367]; The General Insurance Association of Japan [a medical grant research on traffic accidents]; and the National Mutual Insurance Federation of Agricultural Cooperatives.
We thank Drs. Hajime Arai and Masakazu Miyajima, Department of Neurosurgery, Juntendo University, for collaboration with the iNPH research, and Drs. Koichi Takahashi and Tatsuo Mima, Department of Neurosurgery, Sanno Hospital, for collaboration with the SIH research. We also acknowledge members of Fukushima Medical University; Drs. Kyoka Hoshi and Takashi Fuwa, Department of Biochemistry, for biochemical analyses; Dr. Takashi Honda, Department of Human Life Science, for histological analysis; and Dr. Kenneth Nollet, Department of Blood Transfusion and Transplantation Immunology, for proofreading the manuscript.
Contributors
All authors equally contributed to all parts of the review. All authors revised the manuscript and approved the final version.
Profile

Yuta Murakami was born in Aomori Prefecture in 1984 and graduated from Fukushima Medical University School of Medicine in 2011. After graduation and a two-year clinical training, he entered Fukushima Medical University Graduate School of Medicine and directed by Prof. Kiyoshi Saito, Department of Neurosurgery and Prof. Yasuhiro Hashimoto, Department of Biochemitsry. He is engaged in glycan biomarkers in cerebrospinal fluid for diagnosing neurological diseases. In 2019, he became an assistant professor of Department of Neurosurgery, Fukushima Medical University School of Medicine.
Profile

Yasuhiro Hashimoto was born in Fukushima Prefecture in 1954 and graduated from Fukushima Medical University School of Medicine in 1979. After graduation he entered The University of Tokyo Graduate School of Medicine and directed by Prof. Tamio Yamakawa, Department of Biochemistry. In 1983, he was appointed to be an investigator of Tokyo Metropolitan Institute of Medical Science. He was a visiting associated professor, Department of Biochemistry, University of Massachusetts Medical Center between 1988 and 1992. He was appointed to be a team leader of Glyco-chain Functions Laboratory, Frontier Research System, RIKEN Institute in 1999. He found that Alzheimer’s beta-secretase, BACE1, which triggers amyloid pathology, cleaves glycosyltransferases and controls glycan expression. This was the first report for physiological function of β-secretase. In 2007, he became a professor of Department of Biochemistry, Fukushima Medical University School of Medicine. He has studied on glycan biomarkers in cerebrospinal fluid for diagnosing neurological diseases.
References
- 1) Koeppen, A.H. (1995) The history of iron in the brain. J. Neurol. Sci. 134 (Suppl.), 1–9.
- 2) Ward, R.J., Zucca, F.A., Duyn, J.H., Crichton, R.R. and Zecca, L. (2014) The role of iron in brain ageing and neurodegenerative disorders. Lancet Neurol. 13, 1045–1060.
- 3) Andrews, N.C. (2000) Iron homeostasis: Insights from genetics and animal models. Nat. Rev. Genet. 1, 208–217.
- 4) Zecca, L., Youdim, M.B., Riederer, P., Connor, J.R. and Crichton, R.R. (2004) Iron, brain ageing and neurodegenerative disorders. Nat. Rev. Neurosci. 5, 863–873.
- 5) de Jong, G., van Dijk, J.P. and van Eijk, H.G. (1990) The biology of transferrin. Clin. Chim. Acta 190, 1–46.
- 6) Kurokawa, H., Mikami, B. and Hirose, M. (1995) Crystal structure of diferric hen ovotransferrin at 2.4 Å resolution. J. Mol. Biol. 254, 196–207.
- 7) Rouault, T.A. and Cooperman, S. (2006) Brain iron metabolism. Semin. Pediatr. Neurol. 13, 142–148.
- 8) Blay, P., Nilsson, C., Hansson, S., Owman, C., Aldred, A.R. and Schreiber, G. (1994) An in vivo study of the effect of 5-HT and sympathetic nerves on transferrin and transthyretin mRNA expression in rat choroid plexus and meninges. Brain Res. 662, 148–154.
- 9) De Arriba Zerpa, G.A., Saleh, M.A.-C., Fernandez, P.M., Guillou, F., Espinosa De Los Monteros, A., De Vellis, J. (2000) Alternative splicing prevents transferrin secretion during differentiation of a human oligodendrocyte cell line. J. Neurosci. Res. 61, 388–395.
- 10) Reiber, H. and Peter, J.B. (2001) Cerebrospinal fluid analysis: Disease-related data patterns and evaluation programs. J. Neurol. Sci. 184, 101–122.
- 11) Hoffmann, A., Nimtz, M., Getzlaff, R. and Conradt, H.S. (1995) ‘Brain-type’ N-glycosylation of asialo-transferrin from human cerebrospinal fluid. FEBS Lett. 359, 164–168.
- 12) Futakawa, S., Nara, K., Miyajima, M., Kuno, A., Ito, H., Kaji, H. (2012) A unique N-glycan on human transferrin in CSF: A possible biomarker for iNPH. Neurobiol. Aging 33, 1807–1815.
- 13) Kizuka, Y., Kitazume, S., Fujinawa, R., Saito, T., Iwata, N., Saido, T.C. (2015) An aberrant sugar modification of BACE1 blocks its lysosomal targeting in Alzheimer’s disease. EMBO Mol. Med. 7, 175–189.
- 14) Fagerberg, L., Hallstrom, B.M., Oksvold, P., Kampf, C., Djureinovic, D., Odeberg, J. (2014) Analysis of the human tissue-specific expression by genome-wide integration of transcriptomics and antibody-based proteomics. Mol. Cell Proteomics 13, 397–406.
- 15) Nakakita, S., Natsuka, S., Ikenaka, K. and Hase, S. (1998) Development-dependent expression of complex-type sugar chains specific to mouse brain. J. Biochem. 123, 1164–1168.
- 16) Hoffmann, A., Nimtz, M., Wurster, U. and Conradt, H.S. (1994) Carbohydrate structures of β-trace protein from human cerebrospinal fluid: Evidence for “brain-type” N-glycosylation. J. Neurochem. 63, 2185–2196.
- 17) Wyss, D.F., Choi, J.S., Li, J., Knoppers, M.H., Willis, K.J., Arulanandam, A.R. (1995) Conformation and function of the N-linked glycan in the adhesion domain of human CD2. Science 269, 1273–1278.
- 18) Nagae, M., Morita-Matsumoto, K., Arai, S., Wada, I., Matsumoto, Y., Saito, K. (2014) Structural change of N-glycan exposes hydrophobic surface of human transferrin. Glycobiology 24, 693–702.
- 19) Noinaj, N., Easley, N.C., Oke, M., Mizuno, N., Gumbart, J., Boura, E. (2012) Structural basis for iron piracy by pathogenic Neisseria. Nature 483, 53–58.
- 20) Stryer, L. (1965) The interaction of a naphthalene dye with apomyoglobin and apohemoglobin. A fluorescent probe of non-polar binding sites. J. Mol. Biol. 13, 482–495.
- 21) Greene, M.F., Benacerraf, B. and Crawford, J.M. (1985) Hydranencephaly: US appearance during in utero evolution. Radiology 156, 779–780.
- 22) Pavone, P., Pratico, A.D., Vitaliti, G., Ruggieri, M., Rizzo, R., Parano, E. (2014) Hydranencephaly: Cerebral spinal fluid instead of cerebral mantles. Ital. J. Pediatr. 40, 79.
- 23) Murakami, Y., Matsumoto, Y., Hoshi, K., Ito, H., Fuwa, T.J., Yamaguchi, Y. (2018) Rapid increase of ‘brain-type’ transferrin in cerebrospinal fluid after shunt surgery for idiopathic normal pressure hydrocephalus: A prognosis marker for cognitive recovery. J. Biochem. 164, 205–213.
- 24) Kochibe, N. and Matta, K.L. (1989) Purification and properties of an N-acetylglucosamine-specific lectin from Psathyrella velutina mushroom. J. Biol. Chem. 264, 173–177.
- 25) Silverberg, G.D., Mayo, M., Saul, T., Rubenstein, E. and McGuire, D. (2003) Alzheimer’s disease, normal-pressure hydrocephalus, and senescent changes in CSF circulatory physiology: A hypothesis. Lancet Neurol. 2, 506–511.
- 26) Beuckmann, C.T., Lazarus, M., Gerashchenko, D., Mizoguchi, A., Nomura, S., Mohri, I. (2000) Cellular localization of lipocalin-type prostaglandin D synthase (β-trace) in the central nervous system of the adult rat. J. Comp. Neurol. 428, 62–78.
- 27) Kamenetz, F., Tomita, T., Hsieh, H., Seabrook, G., Borchelt, D., Iwatsubo, T. (2003) APP processing and synaptic function. Neuron 37, 925–937.
- 28) Mase, M., Yamada, K., Shimazu, N., Seiki, K., Oda, H., Nakau, H. (2003) Lipocalin-type prostaglandin D synthase (β-trace) in cerebrospinal fluid: A useful marker for the diagnosis of normal pressure hydrocephalus. Neurosci. Res. 47, 455–459.
- 29) Miyajima, M., Nakajima, M., Ogino, I., Miyata, H., Motoi, Y. and Arai, H. (2013) Soluble amyloid precursor protein α in the cerebrospinal fluid as a diagnostic and prognostic biomarker for idiopathic normal pressure hydrocephalus. Eur. J. Neurol. 20, 236–242.
- 30) Murakami, Y., Takahashi, K., Hoshi, K., Ito, H., Kanno, M., Saito, K. (2018) Spontaneous intracranial hypotension is diagnosed by a combination of lipocalin-type prostaglandin D synthase and brain-type transferrin in cerebrospinal fluid. Biochim. Biophys. Acta, Gen. Subj. 1862, 1835–1842.
- 31) Hoshi, K., Matsumoto, Y., Ito, H., Saito, K., Honda, T., Yamaguchi, Y. (2017) A unique glycan-isoform of transferrin in cerebrospinal fluid: A potential diagnostic marker for neurological diseases. Biochim. Biophys. Acta 1861, 2473–2478.
- 32) Schievink, W.I. (2006) Spontaneous spinal cerebrospinal fluid leaks and intracranial hypotension. JAMA 295, 2286–2296.
- 33) Schievink, W.I. and Maya, M.M. (2011) Frequency of intracranial aneurysms in patients with spontaneous intracranial hypotension. J. Neurosurg. 115, 113–115.
- 34) Malcolm, B. and Carpenter, S.J. (1983) Human Neuroanatomy, 8th edition. Williams & Wilkins, Baltimore, MD.