Reviews
Global warming and rice production in Asia: Modeling, impact prediction and adaptation
2019 年 95 巻 6 号 p. 211-245
詳細
2019 年 95 巻 6 号 p. 211-245
Since the projection of global warming emerged in 1980s with the potential of laying enormous impacts on agriculture and food security of the world, we have conducted experimental and modeling studies for clarifying its effects on rice production in Asia and for developing adaptive rice production technologies. On the basis of measurement of rice responses to climate and carbon dioxide concentration ([CO2]), the dynamic process model named SIMRIW was developed to predict global warming effects on irrigated rice. The model predicted differential regional effects of the projected global warming by doubling [CO2] on the rice yield over Asia, and indicated that high tolerance to heat-induced spikelet sterility and high yield potential under elevated [CO2] are the two important characteristics required for rice genotypes adaptive to global warming environment. Further, genetic traits associated with these characteristics and their genetic resources for breeding adaptive genotypes were identified from diverse rice germplasms. This article reviews our initiative studies in the light of the recent studies, and points out further research that is needed for better understanding and overcoming of this unprecedentedly large problem.
Communicated by Koichiro TSUNEWAKI, M.J.A.
Abbreviations: AEZ: Agro-Ecological Zone; ARICENET: Asian Rice Network Experiment; CERES-Rice: name of rice growth and yield simulation model developed in U.S.A.; DVI: Crop Developmental Index; EMF: Early Morning Flowering; FACE: Free-air CO2 Enrichment; GCM: General Circulation Model; GFDL: Geophysical Fluid Dynamics Laboratory; GISS: Goddard Institute for Space Studies; IM2PACT: Integrated Micrometeorology Model for Panicle and Canopy Temperature; IPCC: Intergovernmental Panel on Climate Change; IRRI: International Rice Research Institute; LAI: Leaf Area Index (leaf area per unit land area); MICLAM: Crop Microclimate and Leaf Action Model; NIAS: National Institute for Agro-biological Sciences; ORYZA1: name of rice growth and yield simulation model developed at IRRI; QTL: Quantitative Trait Locus; RCP: Representative Concentration Pathway; RDRS: Rice Diversity Research Set of Germplasm; SIMRIW: Simulation Model for Rice-Weather Relationships; TGC: Temperature Gradient Chamber; UKMO: United Kingdom Meteorological Office.
In the 1980s, projections of global warming appeared as an unprecedented enormous problem that could be threatening to the future human societies. The General Circulation Models (GCMs) of earth’s atmosphere predicted that, when rapidly increasing CO2 concentration ([CO2]) in the atmosphere would double the concentration of the beginning of the last century, then the global mean temperature would increase as much as more than 4 °C.1)–3) Since such a significant temperature rise was considered to give enormously large influences on diverse areas of human societies, the impact assessment of global warming on the societies became an urgent issue to be considered by the scientists. Agriculture is one of the most vulnerably affected sectors by the global warming, and many international studies for the impact assessments were initiated in the period of 1980s to early 1990s.4)–6) From the beginning of these studies, the authors’ group participated in the impact assessment of the global warming on rice cultures in Japan and Asia.
Rice is the most important crop in Asia, providing major portion of dietary energy and vocations for more than 40 billion people living there. Further increase of rice production is required to meet the increasing demand caused by the population increase and economic development. However, increase in rice yield was stagnated around 1990, when the expansion of ‘Green Revolution’ technologies that contributed for the increase in yield were nearly terminated.7),8) While breaking through the rice yield stagnation was a hard challenge for scientists, the projection of global warming added another difficult situation on Asian rice production. The primary concern is to predict the effects of projected global warming on Asian rice production, and to find ways for adaptive rice production technologies.
Since global warming is an unprecedented, traditional statistical model which relies on the past data could not be applicable to the prediction of its effects. Thus, we had developed a process-based mechanistic rice model named SIMRIW (Simulation Model for Rice-Weather Relationships) to predict growth and yields of irrigated rice, based on physiological and physical processes of rice response to climate.9),10) Also, experimental work was conducted to obtain necessary data for SIMRIW on [CO2] by temperature effects on rice growth and yield, using newly developed Temperature Gradient Chamber (TGC),11)–14) as the availability of relevant data had been limited to those reports.15)–17) Using SIMRIW, thus developed, we predicted the effects of doubled [CO2] and projected global warming on the production of irrigated rice in Japan18)–21) and Asia.22),23) Analyses by SIMRIW and its succeeding model GEMRICE (Genotype by Environment Interaction Simulation Model for Rice Growth and Yield)24) revealed that higher tolerance to heat-induced spikelet sterility at flowering stage21),23) and higher yielding potential25),26) under elevated [CO2] are required for adaptive rice genotypes to projected future environments, and also to meet the increasing rice demand in Asia. We further investigated on the mechanisms and traits determining the heat tolerance of rice at flowering stage27)–34) and the yield potential,25),26),35)–38) and explored for genetic resources for the traits, which were necessary for the development of adaptive rice cultivars to projected global warming.39),40)
Our initial studies on the impact assessment of and adaptation to global warming on rice production in Asia were conducted in mid 1990s. Since then, a quite large number of studies, recently, have been made on modeling the impacts of global warming on rice,41)–56) and measurements of heat-induced spikelet sterility at flowering stage57)–69) and on rice responses to [CO2].70)–78) These subsequent studies have added new findings in the research area of climate change and rice production. The objectives of this article are to review the results of the previous studies of the author’s group in the light of these recent studies, and to identify the important research areas for further studies that could help in providing a better understanding of climate change effects on Asian rice production and for developing adaptive rice production technologies to the projected global warming.
Rice (Oryza sativa L.) originated from middle area of the Pearl River in southern China79) for more than 10,000 years ago, and then it gradually spread over the world and became one of the most important crops along with wheat and maize that sustain over seven billion world population. As rice is a well-adapted crop to warm and humid climates of monsoon Asia from its origin, it has become the dominant crop in East, Southeast and South Asia (Fig. 1).80) Rice farming has now expanded to as north as Heihe city (50.2 °N), Northeast China, owing to the technological innovations. In the tropics region, intensive land use of double or triple rice cropping is practiced by the development of irrigation systems. Rice has provided major portion of dietary energy and vocations for its farming, for people living in Monsoon Asia for thousands of years.
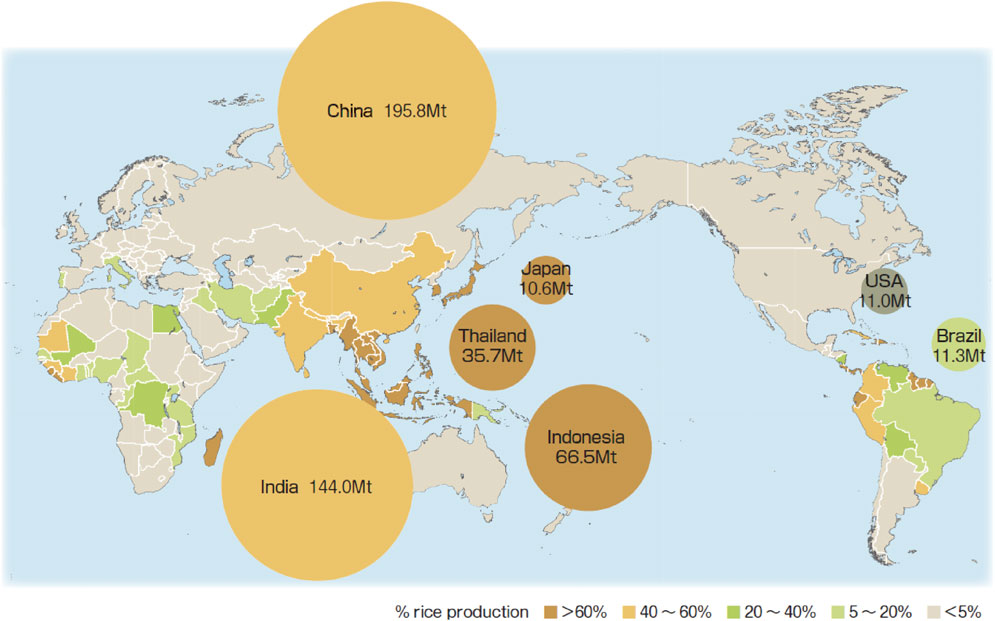
Rice percentage of total grain production in each country, and amount of annual rice production of major rice producing countries in the world in 2010.80) Mt indicates 109 kg.
With the increase in the population, rice production in Asia was increased by about 3 times in the last half century, mainly through the yield increase by the technology innovation referred to as ‘Green Revolution’. Around 1990 when the expansion of the ‘Green Revolution’ technology was nearly terminated in Asia, where it was applicable, however, increase in the rice yield slackened in most Asian countries.7),8) Given the future increase in food demands with the population increase and economic development, it is required to break through the current stagnation in rice yield increase by the creation of more productive rice production technologies. Although the challenges for technology innovation for the 2nd Green Revolution have been continued by world rice workers, its goal is yet unclear.
The projected global warming caused by the increase in the atmospheric concentration of greenhouse gases1)–3) is another enormous factor that makes future food security in Asia, uncertain. With the increase in the human activities such as fossil fuel combustion, industrial productions and land use changes, rapid increases have been observed in the concentration of carbon dioxide ([CO2]), methane ([CH4]) and nitrous oxide ([N2O]) in the atmosphere. The IPCC indicated that the atmospheric [CO2], [CH4] and [N2O] have increased to the levels that are unprecedented for at least 800,000 years and also, [CO2] has increased by 40% since pre-industrial times.81) Since the initial studies1)–3) on General Circulation Models (GCMs) that predicted global warming caused by the increase in the [CO2], many GCMs of various structures have also been developed. The fifth assessment report of IPCC (2013)81) showed the global climate changes predicted by various GCMs under four Representative Concentration Pathways (RCPs) of greenhouse gases. The four RCPs employed the radiative forcing of 2.6, 4.5, 6.0 and 8.5 Wm−2 of greenhouse gases by the year 2100, to which atmospheric [CO2] of 421, 538, 670 and 936 ppm corresponded, respectively. The projected temperature increase not only strongly depends upon the RCP scenarios that reflect itself through the future human efforts to minimize anthropogenic CO2 emissions, but also on GCMs. The ranges of the increase in annual mean surface air temperature in the year 2100 by various GCMs are 0.3–1.7 °C for RCP2.6, 1.1–2.6 °C for RCP4.5, 1.4–3.1 °C for RCP6.0 and 2.6–4.8 °C for RCP8.5, respectively,81) which are lower than the earlier predictions made in the late 1980s, when compared at a same level of [CO2].
Despite a large uncertainty in the predicted future climate, it is important to clarify the potential effects of climate change on Asian rice productions, in order to identify vulnerable areas to climate change and to develop strategies for adaptation of rice culture to global warming, and also for ensuring future food security in Asia under the pressures of increasing population and rice demand.
To assess the impact of unprecedented environmental conditions, which includes high [CO2] in the atmosphere and high temperature rise, on rice production in Asia, the basic data on rice responses to elevated [CO2] and supra-optimal temperatures was found indispensable. Although many studies had been done on the effects of [CO2] on plants including rice (e.g. ref. 82), for the reason that CO2 is the essential substance for plant photosynthesis, but most of them were physiological studies in which plants were subjected for short term treatments of [CO2]. The studies on season-long [CO2] × temperature effects on rice were limited to those,15)–17) in which the study that included supra-optimal temperature effects was further limited to Baker et al.16)
3.1. Development of Temperature Gradient Chamber (TGC).We developed a Temperature Gradient Chamber (TGC) with an [CO2] enrichment facility for study of interacting effects of [CO2] and high temperatures on rice growth and yield,11),12),83) by expanding the idea of the temperature gradient tunnel.84) Two TGCs one with and one without [CO2] enrichment capability were constructed at Kyoto University (Fig. 2).11) The TGC is a plastic covered chamber of the size of 25 m in effective length, 2.0 m in width and 1.7 m in maximum height in which the air flows from one end to another and is controlled at a given rate to create a temperature gradient along its longitudinal axis by solar energy in daytime. At night time, the direction of the air was reversed, and the heated air by an oil-heater at the daytime exhaust end was led into TGC to create a temperature gradient along the long-axis of TGC due to natural cooling. The later type of TGC was installed with 20 m-long electric heat cables along its long axis to supply heating energy in night time and cloudy days, instead of the oil heater. This enabled not to reverse wind direction in night time. Rates of airflow and CO2 release were controlled by a computer to maintain the temperature difference between the two ends of TGC at 5 °C and [CO2] at 700 ppm.
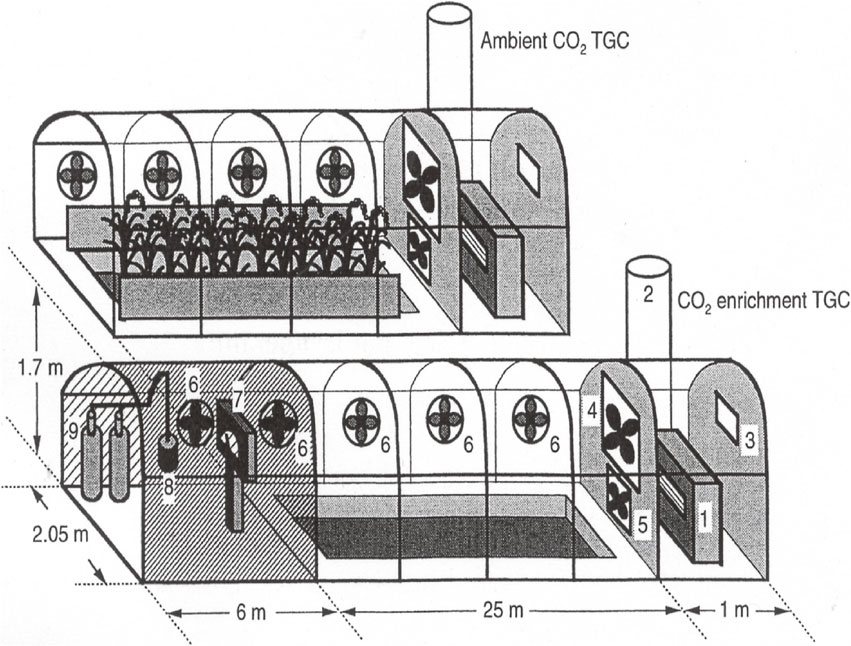
Schematic drawing of the Temperature Gradient Chamber (TGC) of [CO2] enrichment type (bottom) and ambient [CO2] type (top) developed for rice at Kyoto, Japan.11) The numbers indicate, 1, oil heater; 2, stovepipe of oil heater; 3, air exhaust window; 4, variable speed exhaust fan; 5, reversible exhaust fan; 6, oscillating fan; 7, [CO2] controller; 8, CO2 mixing and injection pipe; 9, liquid CO2 tanks.
The initial TGC was designed for [CO2] × temperature treatment on pot-grown rice plants that were placed on the soil surface in TGC, but in the next year (1992), a mini paddy field with 25 m in length, 1.25 m in width and 0.3 m in soil depth was installed in it by filling paddy soil in the plastic film container buried in the ground of TGC. Penetration of solar radiation from side borders of rice canopy on the mini paddy field was prevented by extending the shading cloth along the long axis of TGC. Thus, the TGC enabled to give long-term [CO2] × temperature treatments on rice under near field conditions while allowing natural diurnal cycles of solar radiation and temperature by merely amplifying the temperature proportionately to the distance from the air inlet.
3.2. Rice responses to [CO2] × temperature —Major results from TGC experiments—.The [CO2] × temperature treatments on rice in TGC, was conducted for 5 cropping seasons for the years – 1991 to 1995. A result obtained in the 1992 experiment in TGC is represented through Fig. 3 in which dry weights of crop and panicle of cultivar (cv.) Akihikari grown under ambient (350 ppm) and elevated (700 ppm) [CO2] are given as a function of average air temperature over the entire growth period.11) No consistent temperature effects could be seen on the biomass production both under ambient and doubled [CO2] conditions, agreeing with the results of Baker et al.16) The [CO2] effects on rice biomass production increased by increasing the amount of nitrogen (N) applied.85) By analyzing the TGC experiment data for two years (1991 and 1992), along with the data from previous studies,15),16) the enhancement percentage of rice biomass production by doubling [CO2] was estimated to be 24% under nearly optimum N application, on average over 24 to 31 °C in the seasonal-average temperatures.18)
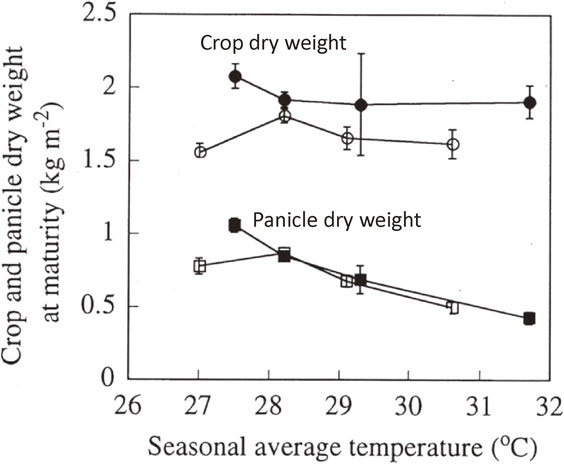
Total crop (●, ○) and panicle (■, □) dry weight of rice (cv. Akihikari) at maturity grown under elevated (700 ppm ●, ■) and ambient (350 ppm ○, □) CO2 concentrations in the TGC as a function of seasonal mean temperature (1992 experiment).11)
However, temperature gave significant effects on the panicle dry weight, both under the ambient and elevated [CO2] conditions: the panicle dry weight decreased sharply as the average temperature exceeded 29 °C, irrespective of [CO2], thus, agreeing with the results on cv. IR30.86) The sharp decline observed in the panicle weight at the higher temperatures were due to heat-induced spikelet sterility of rice.
TGC experiments also showed that the doubled [CO2] had a little effect on leaf area development in rice,13),87) well accepting the previous results15),16) in the growth chamber experiments and also, the later results of Free-Air CO2 Enrichment (FACE) experiments.73),88) This suggests that the enhancement in the crop biomass production by doubled [CO2], as shown in Fig. 3, is mostly derived from the crop photosynthesis, and not from the leaf area development. Further, the doubled [CO2] in TGC increased the canopy diffusion resistance of water vapor and CO2 by 49% for cv. Akihikari and 40% for cv. IR36 than those under ambient [CO2].89) The increased diffusion resistance and biomass production by doubling [CO2] resulted in an increase in the water use efficiency of rice cv. Akihikari under doubling [CO2], by 49% at 26 °C and 23% at 29 °C growing temperatures, respectively.90)
The panicle dry weight of Akihikari, a japonica type cultivar, and IR36, an indica cultivar, grown under the season-long doubled [CO2] in TGC were higher by 21% and 26% than those under ambient [CO2], respectively, on an average of over different temperature regimes of four year-experiments, while excluding those data from potted rice experiment in 1991 and also, from the temperature regimes that brought about heat-induced spikelet sterility.91) The panicle yield increase was mainly due to increased number of both tillers and spikelets per unit area,13),14) agreeing with the previous results.15),17),92),93) The relative yield increase as observed in TGC were close to that of 27% for indica cv. IR72,93) but lower than that of 44% for indica cv. IR3017) obtained from growth chamber experiments. There was genotypic variation in the relative enhancement in rice yield by doubling [CO2]: indica genotypes showed higher responses to [CO2] than Japonica genotypes.25) However, the relative yield increase as observed in TGC and those in other enclosure experiments were apparently higher than that observed in the recent FACE experiments, whereby the yield increase was 11% for japonica cv. Akitakomachi, grown under ambient +200 ppm [CO2] conditions, averaged over 11 season experiments at two locations.94) The FACE rice also showed about 12–13% increase in the biomass production by elevated [CO2],94) which is about a half of the values from TGC experiment and other growth chamber experiments15),93),95) on average over a wide temperature range. The difference in the [CO2] response of rice biomass and yield between FACE and chamber experiments might be due to the difference in [CO2] concentration (about 550 ppm in FACE and 700 ppm in TGC), cultivar and environment, partially.
However, the lower responses to [CO2] in FACE than those in chamber experiments were also reported for other crops such as wheat and soybean.96) The higher [CO2] responses of crops in growth chamber experiments were sometimes attributed to some artifacts in growth chamber experiments (e.g. ref. 96). However, a careful consideration seems necessary on large temporal [CO2] fluctuations in FACE by its nature: a temporal fluctuation of about ±100 ppm around the target [CO2] (about 550 ppm) could be seen in the measured [CO2] in FACE.97) As it was shown that [CO2] response curve of rice canopy photosynthesis and yield nearly reached to plateaus at [CO2] around 600 ppm,17) a positive [CO2] deviation from the target in FACE might give only a small positive effect on photosynthesis and yield, but a negative deviation might give a larger negative effect on them. This could be a cause, at least partly, for the lower response to [CO2] in the biomass and yield of rice in FACE than those in growth chamber experiments. More research is necessary on the causes for the gathering quantitative difference in crop responses to [CO2] between FACE and chamber experiments, including the effects of [CO2] fluctuations on crop photosynthesis, growth and yield.
3.3. Heat-induced spikelet sterility as a function of temperature.The TGC experiments showed that higher temperatures induce spikelet sterility in rice, which moreover offsets the increased grain yield by elevated [CO2]. This indicated that heat-induced spikelet sterility is the key plant factor that governs rice yield under projected global warming climate in presently hot regions. It was observed that rice spikelets exposed to higher temperatures above 35 °C during their flowering period became sterilized, due to failure of pollination and that there is a large genotypic difference in the sensitivity to the heat stress during the flowering stage.98),99)
Analyzing the relationship between spikelet sterility and temperatures at flowering stage, which was obtained from TGC experiments in 1991 and 1992, it was found that the following equation could well approximate the percentage of spikelet fertility (100–sterility percentage) of cv. Akihikari, as a function of daily maximum temperature averaged over flowering period.18)
| \begin{equation} F_{P} = \frac{100}{1 + \exp\{0.853(T_{M} - T_{50})\}} \end{equation} | [1] |
Initially, the value of the parameter T50 in Eq. [1] was considered to be same, both for the ambient and elevated [CO2] conditions, based on the two year (1991, 1992) measurements.18) However, further analysis of TGC experiment data on 5 growing seasons (1991–1995) indicated that spikelet of rice grown under nearly doubled [CO2] was more sensitive to heat stress at flowering time than that grown under ambient [CO2], as shown in Fig. 4.44) Similar result was also obtained in open-top chamber experiment on cv. IR72 at International Rice Research Institute (IRRI) in Philippines.27) The T50 values estimated from the results shown in Fig. 4 for cv. Akihikari were 36.6 °C for the doubled [CO2] and 38.5 °C for the ambient [CO2], respectively. Although the exact mechanism that brought the increased spikelet sensitivity to the heat stress by elevated [CO2] is unknown, it might be that rice growing under the elevated [CO2] conditions in TGC had higher canopy temperature than that under ambient [CO2], due to a partial closure of stomata.89)
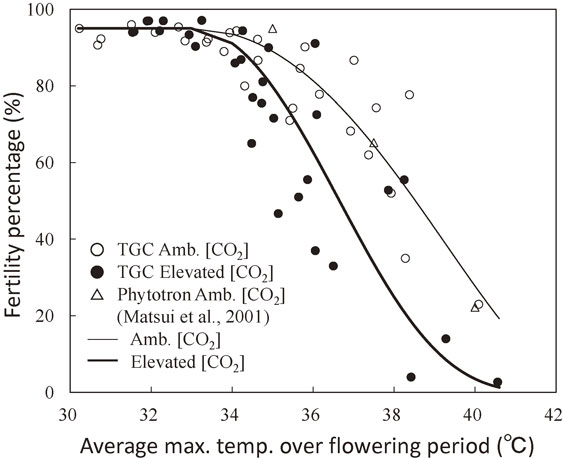
Fertility percentage of spikelet of rice (cv. Akihikari) grown under ambient (350 ppm) and elevated (700 ppm) [CO2] as a function of average maximum temperature over flowering period.44)
Further, experiments on genotypic difference in spikelet sensitivity to the heat stress at flowering period conducted in a phytotron28) showed that T50 of cv. Koshihikari was higher by 1.6 °C than cv. Akihikari which was subjected for the TGC experiment.21) We used for the subsequent simulation model for deriving the T50 value from Akihikari (T50 = 36.6 °C) as heat stress-sensitive genotype and that from Koshihikari (T50 = 38.2 °C) as tolerant genotype under doubled [CO2].
These results from the TGC experiments implied that although the projected [CO2] increase in the atmosphere has a potential to increase rice yield by about 20–30%, depending on the cultivars and environment through enhanced photosynthesis and biomass production, a rise in temperature associated with [CO2] increase will give varying effects on the yield, from negative to positive, depending on temperature conditions at flowering stage.
Since we had developed [CO2]-enriched TGC in 1991,11),83) the TGCs of various types have been built and utilized worldwide for studies on the effects of global climate change on plants.63),101)–106)
Climate effects on crop production had been analyzed and predicted by statistic models in which crop yields were regressed to combinations of climate elements based on past data. However, the projected global warming climate is unprecedented, and it exceeds the past climate range on which traditional statistic models had relied. Thus, those models have difficulty in extrapolate application for future predictions. Instead, the mechanistic process model that integrates the underlining physiological and physical processes of crop growth and yield formation, originating from de Wit et al.,107) can be found as an effective tool for the prediction of the effects of projected global climate change on crop production. On the basis of this concept, we have developed a mechanistic process model for rice, named SIMRIW for simulating climate effects on rice growth and yield.9),18) This section briefly describes about the pioneering rice model SIMRIW and its succeeding model GEMRICE24) that simulates the genotype-by-environment interaction in rice growth and yield, in order to help in understanding the subsequent studies on the effects of projected global warming on rice production in Asia and on adaptation strategies to climate change.
4.1. SIMRIW, a process model for predicting the climatic potential growth and yield of rice. The concept and main structures of the model.A crop yield under field conditions is determined by crop characteristics and environmental factors, like — climate, water, nutrients, insects, weeds and diseases. The yield, thus determined, is termed as actual yield. Except for climate, the other environmental factors can be found manageable, and so, the crop yield under an optimum management, which depends only on climate, is referred to as the potential yield, which can be considered as the upper limit of crop yield at a given location and year. Among climatic factors, the temperature and solar radiation are known to play dominating roles in crop yield determination, so that the potential yield can be defined as the maximum yield determined by crop characteristics, and temperature and solar radiation conditions.108) The objective of the model SIMRIW was to predict the potential growth and yield of irrigated rice at given locations or regions and years. The original version of SIMRIW was developed in 1987 to predict the potential rice yield under the present climate conditions and it was expanded in 1993 to make it applicable for the projected future environment of increased atmospheric [CO2] and temperature.
An important concept of SIMRIW development was to model rice growth and yield formation as simple as possible, by focusing on the essential processes through which solar radiation and temperature determine the growth and yield, in order to minimize the numbers of empirical parameters and to make the model globally applicable. On the basis of this concept, SIMRIW consists of four major processes of phenological development, biomass growth, leaf area expansion and yield formation.
The phenological development processes of rice, such as the time of panicle initiation, flowering and maturity, are primarily important in determining rice adaptability to environment, and are strongly influenced both by environment and crop genotypes. In SIMRIW, these developmental events are described through the Crop Developmental Index (DVI), in a similar way to de Wit et al.107) This variable is defined as 0.0 at crop emergence, 1.0 at heading and 2.0 at maturity. Thus, the developmental stage at any point of time in the life of a crop is represented by a value between 0.0 and 2.0.
The value of DVI at i-th day from the crop emergence is obtained by integrating the Developmental Rate (DVR) with respect to time until i-th day:
| \begin{equation} \mathit{DVI} = \int_{0}^{i}\mathit{DVR}\,dt. \end{equation} | [2] |
| \begin{align} \mathit{DVR} &= \frac{1 - \exp \{B(L - L_{c})\}}{G[1 + \exp \{-A(T - T_{h})\}]}\quad \textit{for $L \leq L_{c}$}\\ &= 0\quad \textit{for $L > L_{c}$}. \end{align} | [3] |
The values of the parameters in Eq. [3] largely differ among cultivars. These parameters were determined for eight representative rice varieties, by applying ‘simplex’ method,111) an algorithm to estimate optimal set of parameter values of non-linear functions, to rice phenology data obtained from field measurements under diverse environments across Japan.109) Figure 5 shows the DVR for cv. Nipponbare, in the photoperiod sensitive phase, as a function of T and L.10) The model could describe the days to heading of field grown Nipponbare, with a standard error of only about 2 days over a range of 75 to 145 days.10) Parameters of DVR function for the period from emergence to the onset of photoperiod sensitive phase (DVI*) or the juvenile phase and that for the grain-filling phase after the heading were similarly determined.
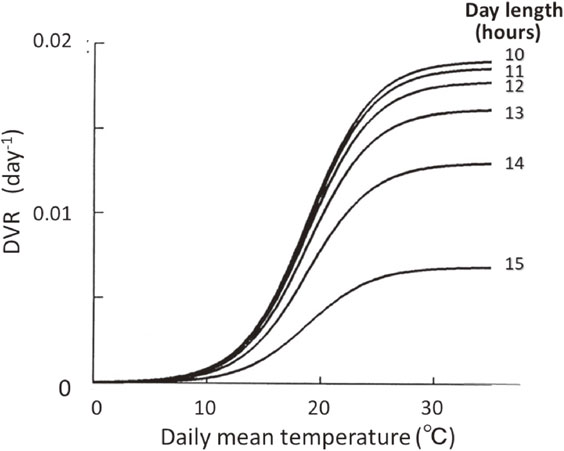
Developmental rate (DVR) of rice (cv. Nipponbare) toward heading as a function of daily mean temperature and day length, as estimated by the model application to field measurements on heading dates and environments across Japan.109)
It was shown that crop biomass production is proportional to the amount of solar radiation intercepted by a crop canopy.112),113) We have depicted that this is also valid in rice, and that the proportionality coefficient between crop biomass and intercepted radiation by crop, the radiation use efficiency, is constant until the middle of grain filling stage and thereafter, decreases curvelinearly towards zero at the maturity.114) Moreover, it was shown that the radiation use efficiency is practically unaffected by temperature in a wide range of it,18) as is also represented in Fig. 3. This is in good agreement with the result,17) in which photosynthesis-light response curves of rice crops, acclimated to season-long diverse temperature conditions, were observed practically unaffected by the growing temperatures.
On the basis of these previous studies, the biomass growth rate of rice crop (g m−2 d−1) was given by,
| \begin{equation} \frac{dW}{dt} = C_{S}\{1 - \exp (-kF)\}S, \end{equation} | [4] |
As described in the previous section, atmospheric [CO2] affects crop biomass production through the radiation use efficiency (CS) in rice, but not through the radiation interception rate. The [CO2] effect on CS was represented by the following Michaelis-Menten hyperbola, referring to Baker and Allen.17)
| \begin{equation} f(C_{a}) = 1 + \frac{R_{a}(C_{a} - 330)}{(C_{a} - 330) + K}. \end{equation} | [5] |
The Leaf Area Index (LAI), that is, the total leaf area over a unit land area, is the crop variable that determines the radiation interception rate and hence, the crop growth rate. The LAI is usually calculated by multiplying crop leaf weight per unit land area by specific leaf area (m2 g−1), that is, the ratio of leaf area to leaf weight. However, the adoption of this traditional method for crop growth model requires many empirical parameters for describing the specific leaf area and biomass partitioning to leaves as functions of DVI and environments.115) Moreover, this approach allows a strong positive feedback between the rates of crop biomass growth and leaf expansion through Eq. [4], so that any small bias in the empirical equations that relate crop biomass with LAI, could result in large errors in the simulated values of W and LAI over a period of time. In order to avoid these problems, the leaf expansion growth was modeled independently of biomass growth in SIMRIW, although, it is doubtless that the leaf expansion needs substances. The major environmental factors that limit leaf expansion growth under field conditions are known to be temperature, water and nitrogen nutrient. In irrigated rice under optimally managed conditions of plant nutrients, the leaf expansion growth until heading was modeled as a function of only daily mean temperature as follows:9)
| \begin{align} \frac{dF}{dt} &= Q[1 - \exp \{-Kr(T - Tr)\}]\left\{1 - \left(\frac{F}{Fm} \right)^{\eta} \right\}F\\ &\qquad \textit{for $T > Tr$}\\ &= 0\quad \textit{for $T \leq Tr$}. \end{align} | [6] |
The yield is a part of the whole biomass weight that a crop accumulated until the maturity. SIMRIW employs this principle for modeling the yield formation process of rice. Namely,
| \begin{equation} Y = H_{v}W, \end{equation} | [7] |
By taking into account the spikelet sterility induced by these harmful temperatures, the harvest index (Hv) was modeled as a function of the fraction of sterile spikelet (γ) and DVI:18)
| \begin{align} H_{v} &= H_{m}(1 - \gamma)[1 - \exp \{-K_{h}(\mathit{DVI} - 1.20)\}]\\ &\qquad \textit{for $\mathit{DVI} > 1.20$}\\ &= 0\quad \textit{for $\mathit{DVI} \leq 1.20$}, \end{align} | [8] |
The time step of one day is used for integration of the simultaneous differential equations described above. The model terminates when either DVI reaches 2.0 (full maturation) or when the crop encounters three days with daily mean temperature less than a critical temperature for growth (premature cessation of growth). The critical temperature ranges 10–13 °C, depending upon the genotypes.
The performance of SIMRIW.To examine the model validity over a wide range of environments, the potential rice yields were evaluated by SIMRIW for major rice producing regions in Japan and in the U.S.A. They were compared to the actual yields of those regions averaged over 5-year period from 1980 to 1984 (Fig. 6, top).9) The potential yields were evaluated by using crop physiological parameters determined for cv. IR36, one of the highest yielding rice cultivars in the 1980s and normal climate data in the respective regions at that time. The potential yields were also compared to the actual yields of the respective regions averaged over the 5-year period from 2010 to 2014, assuming that the potential yields under the normal climates were unchanged (Fig. 6, bottom).117) In the 1980 to 1984 period, SIMRIW well explained the variation in the average rice yield over the respective prefectures in Japan and that over the respective states in the U.S.A. However, the relationship between the evaluated potential yield and the actual yield for the respective regions were clearly on different regression lines between Japan and the U.S.A. The following regression equation could be applied for the actual yields (Ya) against the potential yields (Yp), both in Japan and the U.S.A.:
| \begin{equation} Y_{a} = C_{t}Y_{p}, \end{equation} | [9] |
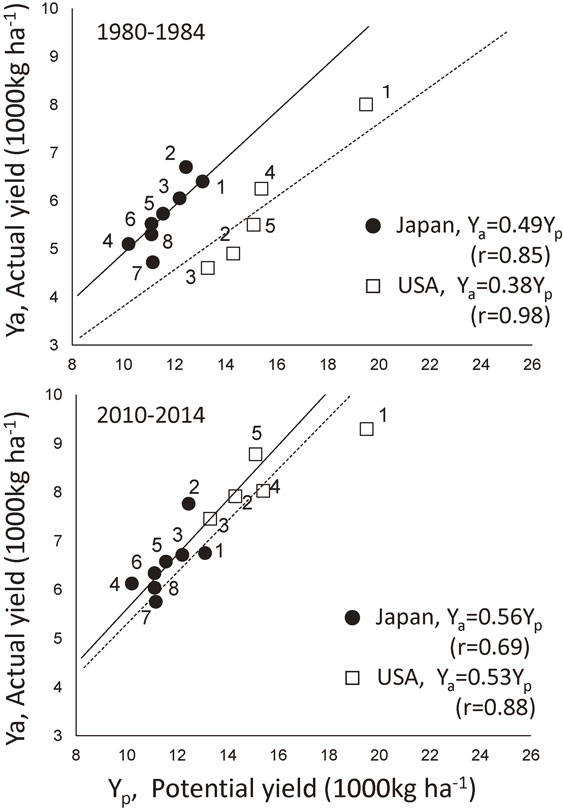
Relationship between the potential rice yields simulated by SIMRIW and the actual 5-year mean yields for different prefectures in Japan and that for different states in the U.S.A., for the period 1980 to 1984 (top)9) and for 2010 to 2014 (bottom).117) The potential yields were estimated from the normal climates of the respective prefectures and states and assumed to be same for both periods. The prefecture and the state average yield of the respective years from the Agricultural Statistics of MAFF, Japan and USDA, respectively, were used for the actual yields.
The potential yields evaluated by SIMRIW for Japan are close to the records of contest-winning yield of 12–13 t ha−1 (in paddy) in the late 1950s in Japan. Those yields are nearly twice the actual rice yields averaged over Japan for the recent years (about 6.7 t ha−1 in paddy). Those high yields were achieved by growing the prevailing rice cultivars at that time under exclusively intensive crop and resource managements. SIMRIW evaluated very high potential yield for California under a moderate temperature and very high solar radiation. Under such climates, very high rice yields of 15–16 t ha−1 were actually obtained in Nile Delta, Egypt118) and Taoyuan at high land of Yunnan, China,119) and that of above 13 t ha−1 in New South Wales, Australia.120) SIMRIW evaluated that potential yields in the tropics were generally lower than those in temperate regions, but at maximum, three rice crops per year are possible in the tropics, so that annual rice yields are about two times as large as those in the temperate.9) The large yield gap between the potential and the actual yields is shown in Fig. 6, which suggests that there are still large rooms to increase rice yield by the management.
It was shown that SIMRIW not only evaluates well the locational variation in rice yield, but also it simulates well the year-to-year yield variations of rice in various climatic regions in Japan,18),19) and seasonal variation of rice yield in Philippines,19) based on weather.
SIMRIW and its component modules have been widely utilized in diverse areas of rice production science and technologies. Those include the phenology prediction for the decision support for crop managements,121)–129) the crop monitoring and prediction in combination with remote sensing technology,130)–133) as well as the impact assessments of global climate change on rice.22),44),45),47),48),50),134),135) Also, the components of SIMRIW are adopted in the later models for various purposes.24),136)–139)
4.2. Overview of GEMRICE, a model for simulating genotype-by-environment interaction in rice growth and yield.While SIMRIW is effective for the prediction of rice growth and yield, based on climate and weather on the regional and global scale, owing to its simplicity, it has limitations in identifying genetic traits required for breeding of more adaptive genotypes to the given environments. For this reason, the succeeding rice model named GEMRICE (Genotype-by-Environment Interaction Simulation Model for Rice: Yoshida et al.24)) was developed, based on more basic rice physiology than SIMRIW.
Development of genotype-by-environment database in rice growth and yield.Cross-locational field experiments named ARICENET140) (Asian Rice Network Experiment) were conducted at seven sites in 2001 and eight sites in 2002, covering major rice producing climates in Asia, using nine common representative rice cultivars for all locations. Those research sites were located in Iwate, Nagano, Kyoto and Shimane, Japan; Nanjing, China; Chiang Mai and Ubon Rachathani, Thailand in 2001, and in 2002, added Yunann, China to the sites of 2001. Rice crops at each location were grown under nearly optimum conditions with careful control over insects, disease and weeds and with application of same amount of fertilizers as basal and top-dressing over all locations. The crops were harvested in about 2-week interval during the growing season and subjected for measurements of numbers of tillers, leaf area, and dry weight and nitrogen contents of leaves, stems and panicles at all locations for all cultivars. In addition to these measurements, numbers of spikelets per m2, single grain weight, ripening percentage and yield in paddy were determined at maturity. Separately from these field experiments, photosynthetic rate, stomatal conductance and nitrogen content of the leaves of the nine cultivars were measured at Kyoto at four different development stages.
The data thus obtained showed quite a large genotypic and environmental differences in the growth attributes, in which many genotype by environment (G by E) interactions were observed. The database consisted of these data were utilized for model development. About a half of the data were used for model development and the remaining half for model validation.
The main structure of GEMRICE.The model GEMRICE consists of seven processes of rice growth and yield formation: the phenological development; the biomass growth; the LAI (Leaf Area Index) development; the plant nitrogen (N) dynamics; the plant N uptake; the spikelet number determination; and the grain yield formation. For the phenological development process, the same module as that of SIMRIW was employed.
Growth and yield of rice were modeled considering the interdependence between carbon and N accumulation in plants as shown in the conceptual model framework in Fig. 7.141) The biomass growth process was modeled basing upon the leaf photosynthetic rate as its starting point. The photosynthetic rate per unit leaf area under saturating radiation intensity (Pmax, µmol CO2 m−2 s−1) was represented by the following equation142) as a function of leaf nitrogen content per unit area (NL, g m−2) and [CO2], referring to Ohsumi et al.:38)
| \begin{equation} P_{\textit{max}} = \frac{K_{p}G_{s}(N_{L} - N_{O})}{G_{s} + K_{p}(1 + G_{s}/G_{m})(N_{L} - N_{O})}Ca \end{equation} | [10] |
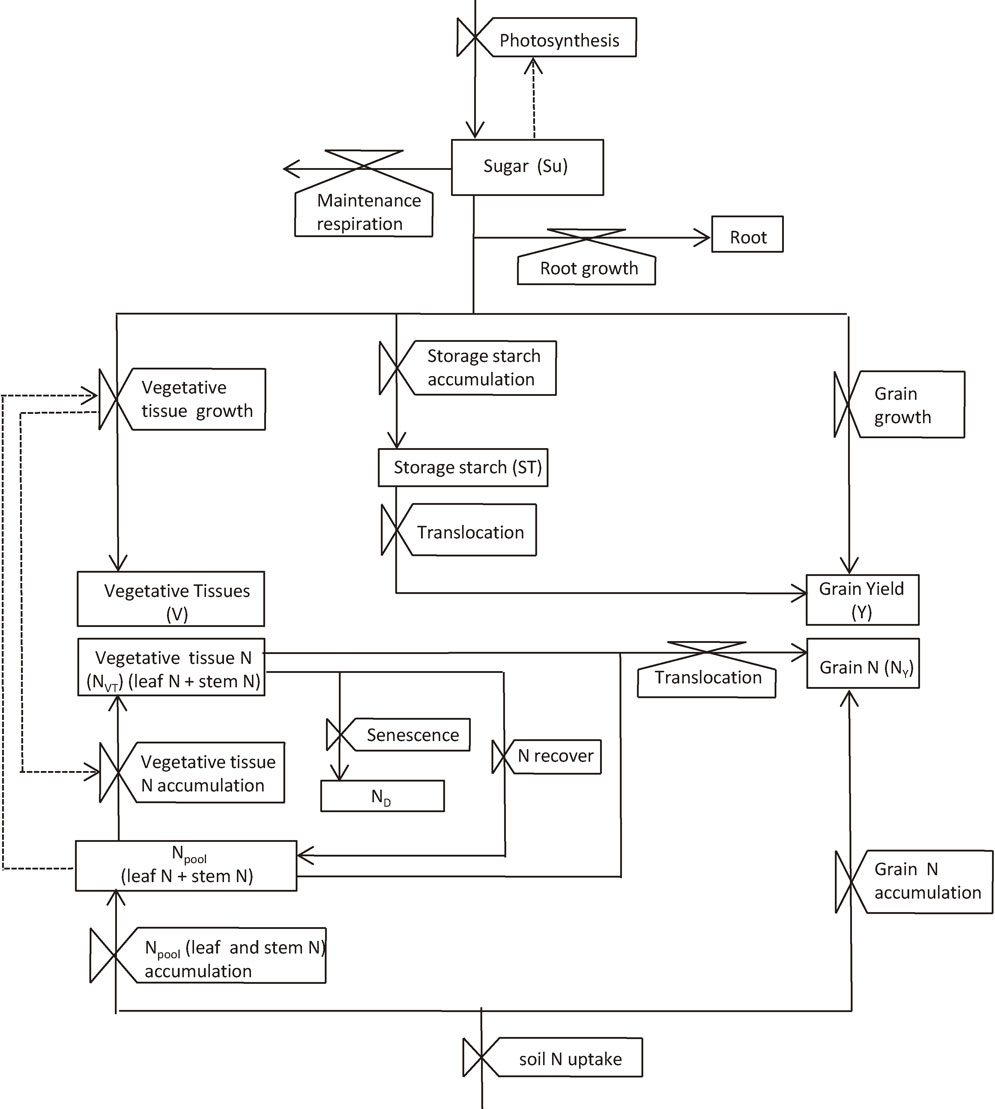
Conceptual framework of the model GEMRICE structure for carbon and nitrogen (N) dynamics within plant.141) The boxes, the valves and the arrows represent state variables, rate variables and flows of substances, respectively. Note that Nvt and Npool are constituents of leaf N and stem N.
Using Pmax thus determined, photosynthesis (P)-light (I) response curve was expressed by,
| \begin{equation} P = P_{\textit{max}}\left\{ 1 - \exp \left(\frac{\varepsilon I}{P_{\textit{max}}} \right) \right\} \end{equation} | [11] |
| \begin{equation} \Delta Pt = \int_{0}^{24} \int_{0}^{Ft}PdFdt, \end{equation} | [12] |
The carbohydrates thus produced are accumulated in sugar pool, which are then utilized for tissue growth of above-ground vegetative organs (stems and leaves), roots and panicles (when they exist) and for starch as storage; thereby a part of sugar is used for growth and maintenance respirations. The partitioning of sugar to those organs is calculated based on the principle that growth rate of an organ depends on the balance between sugar demand for growth and its availability from the sugar pool, in which the demand of panicles has the first priority. The sugar demand of an organ is determined by the size of the organ, Crop Developmental Index (DVI), plant N status and temperature. A supply of sugar to starch storage occurs when the size of sugar pool exceeds the total demand of all organs. The stored starch is utilized for the growth of panicles after the heading, for they have large sugar requirement for their growth which often exceeds the current daily photosynthesis. The detailed mathematical equations and the values of parameters for these processes were described in the previous reports.141),142)
Similarly to the carbon dynamics described above, the N uptake24) and N dynamics in plants,141) and LAI development145) were modeled in GEMRICE. The final process of grain yield determination was described by the following logistic equation:141)
| \begin{equation} \frac{dY}{dt} = \frac{K_{y}}{E_{g}}Y\left(1 - \frac{Y}{Y_{\textit{max}}} \right). \end{equation} | [13] |
| \begin{equation} Y_{\textit{max}} = S_{n}G_{w}\left( 1 - \gamma \right) \end{equation} | [14] |
The determination process of spikelet number per unit area was modeled146) on the basis of the earlier findings of Wada147) that the final number of spikelet per unit area is determined as the difference between differentiated and degenerated spikelet numbers, of which the former is proportional to the crop N content at the late spikelet differentiation stage and the latter is a function of the average crop biomass growth rate (CGR) during the period from late stage of spikelet differentiation to heading.
The values of parameters and constants describing the model were determined by ‘Simplex’ method for each of the main process of GEMRICE, independently of other processes by using the ARICENET experiment data. Namely, the values of parameters for a process (dynamics in biomass growth, leaf area development or plant N, so on) were determined using the measured data for the variables to be determined in the other processes. This cross determination procedure was applied for all the major processes that GEMRICE modeled, in order to best estimate the parameter values avoiding their multi-collinearity. The component process models of GEMRICE, thus determined, were fully reported in the independent papers on spikelet number determination,146) LAI development,145) photosynthesis and biomass growth,142) N dynamics and yields,141) and on N uptake and whole processes.24)
The performance of GEMRICE.The model was validated using the ARICENET experiment data, and was shown to well simulate, based on environment, the observed grain yield, spikelet number and biomass weight per unit area at the maturity of nine rice cultivars grown under eight widely different locations in Asia for two years.24) It also rationally simulated the observed dynamics in the crop biomass, leaf nitrogen (N) contents and LAI over the growing season.24)
Figure 8 demonstrates the response of the spikelet number per unit area to plant N content, which was deduced from the model simulation for the nine cultivars grown under eight different locations in Asia. It shows that rice spikelet number is nearly proportional to N uptake up to the late stage of spikelet differentiation, and that there is a large genotypic difference in the efficiency of spikelet production per unit plant N (N use efficiency in spikelet production). High N use efficiency in spikelet production is an indispensable trait for high yielding potential of rice.144)
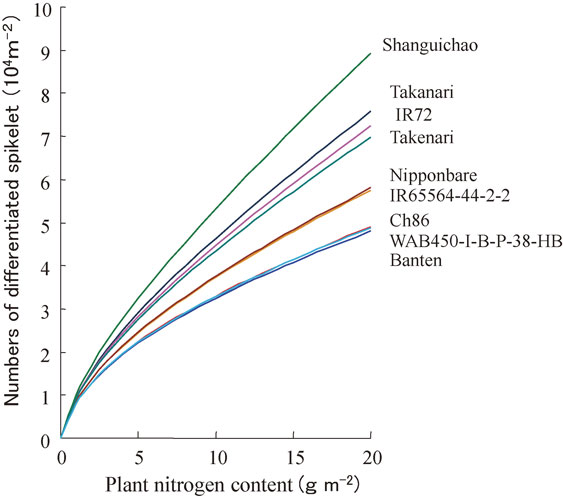
Rice genotypic difference in the numbers of differentiated spikelet per unit area as a function of plant N content at the late spikelet differentiation stage, as deduced by GEMRICE application to various genotypes grown under diverse environment conditions in Asia.146)
As it has been previously discussed, the rice model SIMRIW, for its simplicity and generality, has high applicability to global evaluation of potential rice yield based only on solar radiation and temperature, by selecting adequate cultivars installed in the model. The GEMRICE is a physiology-based model applicable for the analysis of G by E interactions in rice growth and yield formation, and for exploration of plant genetic traits and crop management strategies for increased yield under given locations, where soil N data as well as climate data are available.*
The first worldwide project focusing on climate variation and agriculture were organized in 1983 by the International Institute for Applied Systems Analysis (IISA) headed by Dr. Martin L. Parry. The author joined this project and initiated the studies on the development of rice model SIMRIW to assess the impact of projected global warming on rice production in Japan.148) Studies in this project, however, remained in the assessment of the effects of only temperature variation and change on rice production, but did not consider the direct effects of elevated [CO2] on rice. Rozenzweig et al.,4) working with collaborators from 22 countries and using number of crop models, simulated likely changes in the production of various crops, including rice under different climate scenarios with elevated [CO2]. However, this study was limited in the number of the prediction sites (21 for rice in East and Southeast Asia).
In order to clarify potential effects of projected [CO2] increase and global warming on diverse rice producing areas in Asia and to explore adaptation measures to global warming, an international research project was initiated in 1992 by IRRI in collaborations with Wageningen University and Research Institute for Agrobiology and Soil Fertility, The Netherlands, Laboratory of Crop Science, Kyoto University, Japan and Environmental Research Laboratory in Covallis of United State Environment Protection Agency, U.S.A. Two rice models of SIMRIW and ORYZA1136) were used for predicting rice yield change under projected global warming in various rice producing areas in Asia. In this section, the results of this collaborative study20)–23) are reviewed in the light of the relevant studies that have been made since this study in the mid. 1990s.
5.1. Climate scenarios used for the impact assessment.The climates under doubled [CO2] conditions predicted by three General Circulation Models (GCMs) of earth’s atmosphere, that were available in the beginning of 1990s, were employed for the evaluations of global warming effects on rice production in Asia. Those GCMs were GFDL (Geophysical Fluid Dynamics Laboratory),2) GISS (Goddard Institute for Space Studies)1) and UKMO (United Kingdom Meteorological Office)3) models. The increases in global mean temperature under doubled [CO2] predicted by these GCMs were 4.0, 4.2 and 5.2 °C in GFDL, GISS and UKMO, respectively. While GFDL predicted a slight decrease in annual total radiation, other GCMs did a slight increase in it, with UKMO having a larger increase than GISS.
The change in annual mean temperature under doubled [CO2] predicted by GISS is represented in Fig. 9 for the area covering Japan. The GISS predicted that 3–4 °C increase in the annual mean temperature in the north and west Japan, and 2.5–3 °C increase in the south and east Japan under doubled [CO2] conditions. The larger temperature rise in the north than in the south was common over all GCMs.
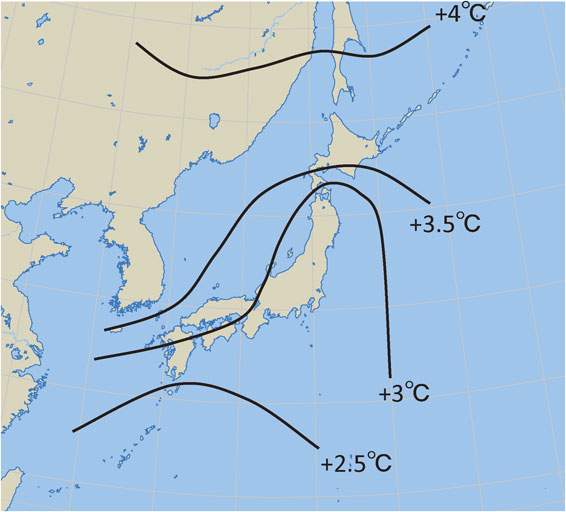
Graphical representation of the rise of annual mean surface temperature around Japan, predicted by GISS general circulation model for doubling atmospheric [CO2].1)
The changes in the temperature and solar radiation predicted by GCMs were presented on grid points over the earth surface; the grid size in latitude by longitude was 4.44° × 7.5° in GFDL, 7.83° × 10.0° in GISS and 5.0° × 7.5° in UKMO. The corresponding climate change at each weather station was estimated by interpolating the predicted change at surrounding grid points. The annual courses of daily maximum and minimum temperatures or daily solar radiation at a given weather station under doubled [CO2] conditions were synthesized by adding the temperature changes or by multiplying percentage radiation change to the observed daily maximum and minimum temperatures or solar radiation at the station, and used for the subsequent impact studies.
5.2. The effects on Japan. Climate data and crop parameters.Weather data of daily maximum and minimum temperatures and daily solar radiation from nine weather stations (Sapporo, Akita, Sendai, Maebashi, Toyama, Nagoya, Hiroshima, Kochi, Miyazaki) for 12 years from 1979 to 1990 were used as base line for predicting potential effects of elevated [CO2] and global warming on rice production by rice model SIMRIW. These weather stations are representing major Agro-Ecological Zones (AEZs) in Japan proposed by Ozawa.149) From these data, the average climate for each location was synthesized by averaging daily weather values over the 12 years for each location and was used as the base climate. Doubled [CO2] climate corresponding to each GCM was synthesized for each location, by using the baseline climate by the procedure already explained, and subjected to the impact evaluation studies.
Crop parameters for four rice cultivars that were dominating in the respective rice producing regions in 1980s were used for simulating the yield. Those are Ishikari for Hokkaido island, Sasanishiki for northern Honshu (Main Island), Koshihikari for central Honshu, Nipponbare for west Honshu and Shikoku island, and Mizuho for Kyushu island, respectively. The major difference in crop parameters among these cultivars exists in the parameters describing crop phenological development given by Eq. [3], for these parameters are primarily important in determining crop adaptability to regional climates. For the parameter representing crop sensitivity to high temperature stress (T50: the 50% spikelet sterility temperature), however, the values for Akihikari and Koshihikari determined for doubled [CO2] by the procedure described in the section 3.3 were employed for all the cultivars, because T50 values for other cultivars were unknown in the early 1990s. Furthermore, the T50 values determined for both cultivars under doubled [CO2] (36.6 °C for Akihikari and 38.2 °C for Koshihikari) were also applied for ambient [CO2] conditions, because it was unclear in the mid. 1990s that rice grown under ambient [CO2] has higher T50 than that under doubled [CO2]. This, however, effected a little on the simulated yield, for heat-induced spikelet sterility scarcely occurred under the climate in Japan in the last century.
It had been shown that T50 of cultivars obtained under constant temperatures in phytotron, ranged from 33.5 °C in BKN6624-46-2, a lowland selection variety from Thailand, to 39 °C in N22, an upland variety from India.98) Considering this range of genetic variability of T50, cv. Akihikari belonged to relatively sensitive and Koshihikari to the tolerant groups to the heat stress. This classification of the two cultivars in the sensitivity to the heat stress was justified in the later studies.33),60) Hereafter, the yield simulated with using T50 value from Akihikari and that from Koshihikari are denoted as sensitive and tolerant cultivars, respectively.
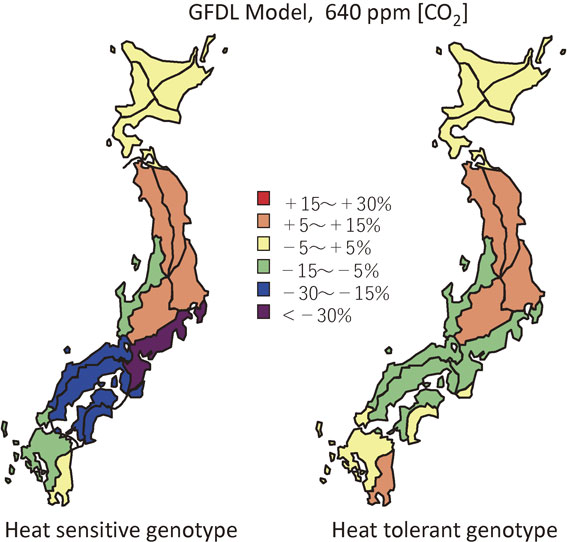
The effects of doubled [CO2] (640 ppm) climate on regional rice production were represented as percentage change of the yield simulated under doubled [CO2] climates to those under the current climate for each cultivar.
Predicted rice yield change in Japan.The effects of doubled [CO2] climate on rice yield in Japan predicted by SIMRIW significantly depended on climate scenarios, adopted cultivars and regions. Figure 10 shows relative changes in rice yield over Japan simulated for the sensitive (left) and the tolerant (right) cultivars to the heat stress, under GFDL climate scenario.20),21) It was predicted that the GFDL doubled [CO2] climate would give moderately positive effects on rice yield in northern Japan, and negative effects on south-central and southwestern Japan.20),21) Although the predicted effects of doubled [CO2] climate on rice yield in Japan were quantitatively different among climate scenarios of GFDL, GISS and UKMO, the direction of effects were similar.
The positive effects of doubled [CO2] and temperature rise in northern Japan were because the base temperature over there is relatively low or cool, under which conditions the direct effect of doubled [CO2] exceeded negative effects of shortened growth duration by the projected warming. The decrease in yield in the south-central and southwestern Japan were due to temperature rise predicted by GCMs being high enough not only to shorten rice growth duration but also to bring about extensive spikelet sterility. These results suggested that heat-induced spikelet sterility will become the serious problem for rice production in south-central and southwestern Japan under projected global warming climate.
The heat-induced spikelet sterility of rice had rarely occurred in Japan, but it was observed in south-central Japan in a hot summer year of 2007, under a warming trend in Japan from around 1990. In Tsukuba which is located in south-central Japan, cv. Koshihikari that headed during the period with 33–39 °C daily maximum temperatures suffered 10–24% spikelet sterility.61) If it had occurred under doubled [CO2], more extensive sterility and severe yield reductions would have been brought about, because elevated [CO2] increased rice sensitivity to heat stress at flowering stage, as shown in Fig. 4. The observation of heat-induced spikelet sterility under the current climate condition in Japan suggests the reality of our predictions based on SIMRIW.
It was found that the genotypic difference in crop sensitivity to heat-induced spikelet sterility brought significantly large difference in the simulated yield change under doubled [CO2] climate, as is shown in Fig. 10. For high temperature sensitive genotypes, severe yield reductions by 17% in GFDL, 12% in GISS and 33% in UKMO climate from the present were predicted, respectively, on average over south-central and southwestern Japan. When high temperature tolerant genotype was adopted, those negative effects of doubled [CO2] climate decreased to less than 10% in GFDL and UKMO, or reversed into positive in GISS. Considering the difference in the heat stress sensitivity (T50) between the sensitive (Akihikari) and tolerant (Koshihikari) genotype was only 1.6 °C, a slight difference in T50 between rice cultivars significantly affected the simulated rice yields under doubled [CO2] climate.21) As more frequent hot and cold extreme temperatures are predicted by IPCC81) under global warming, further enhancement of rice tolerance to heat-induced spikelet sterility is the primarily important target for development of adaptive rice cultivars to anticipated global warming.
Another important point shown in Fig. 10 is that positive effect of doubled [CO2] climate on rice yield in Hokkaido was significantly smaller than that in Tohoku region (northern Honshu). This was because the cv. Ishikari grown in Hokkaido is a short growth duration genotype, owing to its insensitivity to photoperiod, for adapting to short growing season under the cool climate, to which projected global warming will accelerate crop development, thereby resulting in further shortened duration of growth. It will become possible, however, to grow a photoperiod sensitive and longer growth duration cultivar in Hokkaido under projected warming climate, by utilizing the benefit of extended rice growing season. A 50% yield increase was predicted for Hokkaido under doubled [CO2] climates, by growing cultivar Koshihikari, a much longer growth duration cultivar with advanced transplanting date.21) The effects of altered cultivars and cropping seasons under doubled [CO2] climate were similarly simulated for other regions in Japan. The results showed that these adaptation measures will alleviate the negative effects and enlarge the positive effects of global warming to some extent, but not so large as in Hokkaido.21) These results imply that global warming has a potential to largely increase the rice yield in northern limit area of rice culture, where the current cool temperatures have been limiting the growing season.
On the basis of the simulation study described above, we can conclude that the projected increase in [CO2] in the atmosphere and global warming will substantially increase rice yields in northern Japan, but in south-central and southwestern Japan, it will reduce the yield through spikelet sterility induced by higher temperatures at flowering stage.
Recent studies on the effects of global warming on rice production in Japan.Since our studies in mid. 1990s on the impact evaluation of projected global warming on rice production, similar studies have actively been made in Japan by using SIMRIW with modified crop parameters, under various climate scenarios provided by many newly developed GCMs.44),45),47),48),135) As those studies predicted rice yield change in Japan under different climate scenarios from ours, direct comparison of those predictions with ours is difficult. However, the yield changes predicted by them for late 21st century have generally agreed with our previous prediction that the projected increase in [CO2] and associated global warming will increase rice yield in northern Japan and decrease in south-central and southwestern Japan, although the degree of yield change varied depending on climate scenarios.
On the other hand, the trend of temperature increase, especially the minimum temperature, had become remarkable in Japan from the year 1990, whereby the adverse effects on rice quality became noticeable. It was found that mean temperature above 26–27 °C during the 20-day period after heading caused an increase of chalky grain due to reduced supply of carbohydrates to rice grain.150) Rice model GEMRICE had rationally simulated percentage of chalky grain, observed under field conditions, based on climate and dynamics in carbohydrates and nitrogen during grain filling period,151) hence, suggesting the model applicability for the prediction of yield and grain quality. Also, a study was made55) to predict effects of climate change on rice yield and grain quality for various regions in Japan, under six GCM climate scenarios by three Representative Concentration Pathways (RCPs) of greenhouse gases, using rice model H/H.152) The result showed that rice yield over Japan will slightly increase under most climate scenarios, but risks of grain quality degradation will increase from year 2031 onwards in many regions. Based on this, it was inferred that rice producing areas in Japan will be segregated into suitable and unsuitable areas.55)
These recent studies suggest that the projected global warming will not only reduce the rice yield in the south-central and southwestern Japan, but also degrade the grain quality.
5.3. The effects on irrigated rice in Asia. The method.The effects of projected [CO2] increase and global warming on rice production in major rice producing regions in Asia were evaluated by a similar way as in Japan. Daily climate data were collected from 68 weather stations in 15 countries of Asia and compiled into rice-weather database. The number of years that the database covered was different among locations from only 2 to 32 years, but more than 10 years in majority of the locations. Two rice models of SIMRIW and ORYZA1136) were used for the impact evaluation. The ORYZA1 is a more physiology-based process model than SIMRIW, which is simulating the rice growth based on single leaf photosynthesis as a function of solar radiation, temperature, [CO2] and nitrogen (N) content of leaves, by a similar way as described for GEMRICE. It utilized the same module as that of SIMRIW for simulating the effects of high and cool temperatures on spikelet sterility of rice.
Both models adopted the crop parameters on cv. IR58 for simulating the yields in indica rice growing regions and Ishikari in japonica rice regions in Asia. The parameters for IR58 for both models were obtained by calibrating simulation results to field measurement data at IRRI under diverse environmental conditions,19),136) and those for Ishikari to the data from field experiments conducted across Japan, as previously described. For the crop sensitivity parameter to the heat stress at flowering stage (T50), however, the value on cultivar Akihikari was assumed for both cultivars in both the models.
Using rice-weather database, doubling [CO2] weather conditions corresponding to GFDL, GISS and UKMO climate were synthesized for each day of each year at each weather station, by the method already explained. Rice yields were simulated by each model, both under the present and each doubled [CO2] climate for each location for all the years that the rice-weather database covered. Relative yield change from the present for each climate scenario at each location was obtained by averaging the yearly relative yield changes over all years.22) In those regions where double or triple cropping of rice is practiced in the tropics, the simulations were done for double and triple crops, by using prevailing cropping seasons in the respective regions.
The predicted yield change in Asia.The relative yield changes, predicted by SIMRIW under GFDL, GISS and UKMO climate scenarios for all the regions in Asia are shown in Table 1,22) following the Agro-Ecological Zones (AEZs) of FAO.153) The predicted yield change under doubled [CO2] climate largely varied among the regions and climate scenarios employed. In general, UKMO climate was observed likely to give the most unfavorable effects on rice production across Asia, GISS to give intermediate and GFDL the mildest effects. This is consistent with the predictions by ORYZA1. It was predicted that rice yields in the regions surrounding the equator (Indonesia and Malaysia) will increase under all climate scenarios of GFDL, GISS and UKMO. This agreed well with the prediction by ORYZA1. The yield increase predicted by SIMRIW for these two countries ranged from 5.9% to 26.8%, depending on GCM climate scenarios. The positive effects of doubled [CO2] climate on rice yield in these regions was due to the present mean temperatures in the hottest months being less than 30 °C, and also to GCMs predicting smaller temperature increase in the south than in the north on the earth, although annual mean temperatures are high in these regions. Under such a climate, positive effects of elevated [CO2] were likely to exceed negative effects of increased temperatures.
| Country | AEZ | Current production × 1,000 t | GFDL | GISS | UKMO | |||
|---|---|---|---|---|---|---|---|---|
| Change (%) | × 1,000 t | Change (%) | × 1,000 t | Change (%) | × 1,000 t | |||
| Bangladesh | 3 | 27,691 | 8.0 | 29,914 | −10.2 | 24,869 | −9.0 | 25,200 |
| China | 5 | 8,854 | −1.7 | 8,700 | 7.3 | 9,501 | −1.4 | 8,730 |
| 6 | 79,872 | 9.7 | 87,596 | −30.7 | 55,332 | −17.2 | 66,162 | |
| 7 | 91,828 | 1.0 | 92,768 | −10.0 | 82,600 | −8.4 | 84,158 | |
| 8 | 2,361 | −10.0 | 2,125 | 9.7 | 2,590 | −5.8 | 2,223 | |
| India | 1 | 32,807 | −8.2 | 30,104 | −19.5 | 26,417 | −14.8 | 27,964 |
| 2 | 49,949 | 9.1 | 54,473 | 10.5 | 55,192 | −3.2 | 48,366 | |
| 5 | 227 | −1.7 | 223 | 7.3 | 244 | −1.4 | 224 | |
| 6 | 26,628 | −19.9 | 21,339 | −36.9 | 16,804 | −92.4 | 2,011 | |
| 8 | 1,011 | −10.0 | 910 | 9.7 | 1,109 | −5.8 | 952 | |
| Indonesia | 3 | 44,726 | 17.5 | 52,543 | 9.8 | 49,093 | 6.9 | 47,816 |
| Japan | 8 | 12,005 | −10.0 | 10,804 | 9.7 | 13,172 | −5.8 | 11,303 |
| Malaysia | 3 | 1,744 | 12.0 | 1,953 | 1.7 | 1,774 | 14.7 | 2,001 |
| Myanmar | 2 | 13,807 | 15.6 | 15,961 | −13.8 | 11,896 | −4.9 | 13,134 |
| Philippines | 3 | 9,459 | 9.4 | 10,345 | −13.7 | 8,163 | −5.4 | 8,944 |
| South Korea | 6 | 8,192 | 1.6 | 8,323 | 13.8 | 9,323 | −8.8 | 7,468 |
| Taiwan | 7 | 2,798 | 2.4 | 2,866 | 5.1 | 2,941 | 20.7 | 3,378 |
| Thailand | 2 | 20,177 | 6.4 | 21,461 | −11.6 | 17,842 | −7.3 | 18,696 |
| Total | 434,136 | 452,409 | 388,860 | 378,730 | ||||
| Change (%) | +4.2 | −10.4 | −12.8 | |||||
The regions where more than 10% yield reduction were predicted by SIMRIW under more than two GCM climate scenarios were AEZ 1 and 6 in India and AEZ 6 in China. In India, the AEZ 1 is located in south India including Tamil Nadu state, and AEZ 6 in northwest India including Punjab and Uttarakhand states, where daily maximum temperature in May and June often exceeds 40 °C under the current climate. The AEZ 6 in China is located in central China including those provinces of Hunan and Hubei, where daily maximum temperature in July and August occasionally exceeds 40 °C under the current climate. In those regions, considerable amount of spikelet sterility due to heat stress at flowering period were predicted under GISS and UKMO climate scenarios. These predictions by SIMRIW for AEZ 1 in India and AEZ 6 in China agree well with the prediction by ORYZA1, but that for AEZ 6 in India has not been authenticated. While SIMRIW predicted extensive spikelet sterility due to heat stress for AEZ 6, ORYZA1 did less severe spikelet sterility. As the two rice models used same module for simulating spikelet sterility, the disagreement was likely to be affected by the difference in the simulated heading date between the two models, and also by the limited number of years for weather data (only 3 years) for this region. Under such a circumstance, a difference in the heading date might differentiate the fate of rice panicles whether their headings encounter heat stress period or escape from it. More studies including on-site investigation are necessary on heat-induced spikelet sterility in AEZ 6 in India.
Recently, impact assessment studies of projected global climate change on rice production have actively been made in India and China, using various climate scenarios and rice models. Many of recent studies in India predicted remarkable yield reductions in northwest India (AEZ 6),41),52),54) and Tamil Nadu state (AEZ 1),53) qualitatively agreeing with our previous predictions. In China, positive effects of global warming in the late period of this century were predicted for southern China154) and for eastern China,50),155) and negative effects for middle and lower reaches of Yangze River,156) and for central China,56) which generally agree with those of our previous study findings. Also, observations of extensive heat-induced spikelet sterilities were reported in India,68),157) and in China58),59),158)–160) under the current climate. These observations may support the reality of our previous predictions.
Effects of heat-stress tolerant cultivar on the predicted yield change.It should be noted that the yield changes as shown in Table 1 were predicted by assuming that all the cultivars growing in Asia had a same sensitivity to heat stress at flowering stage (T50: 50% sterility temperature) as that of Akihikari obtained under doubled [CO2] conditions (Fig. 4), because heat-stress sensitivities of thousands of rice cultivars growing in Asia are unknown. In order to examine the effects of the parameter T50 on the simulated rice yields under doubled [CO2] climate, a further analysis was made by SIMRIW, using T50 value of 38.2 °C from Koshihikari, a tolerant cultivar to heat stress, together with that of Akihikari (T50 = 36.6 °C), a sensitive cultivar. The analysis was done for representative rice cultivation locations of Southeast Asia, south and east China and Japan, including those locations where double rice cropping is currently practiced.23) The results showed that, when heat-stress tolerant cultivars were assumed, the yield of main (wet) season or single season rice under all doubling [CO2] climate scenarios will increase at most locations investigated, and also the yields of second (dry) season rice at Guangzhou, China, Pingtung, Taiwan, Tanjung Karang, Malaysia and Ciledug, Indonesia, with more pronounced yield increases than those shown in Table 1.
However, it was predicted that doubled [CO2] climate will drastically decrease the yield of second (dry) season rice at Khon Kaen, Thailand, Pyay and Yezin, Myanmar which are located in the continent of Southeast Asia.23) Global warming in this region not only will reduce the yield but also drastically increase its year-to-year variation (CV).23) The current climates in the continent of Southeast Asia, are very hot in March to May period, so that further temperature increase will largely reduce the yield of dry season rice that flowers during hottest period, due to heat-induced spikelet sterility. In this region, observations of heat-induced spikelet sterility in dry season rice were reported.68),161),162)
A further analysis was made for Khon Kaen, Thailand on critical transplanting period for suffering heat stress during the flowering period. In this area of Thailand, rain-fed rice culture is mainly practiced in rainy season from June to September using traditional cultivars having high photoperiod sensitivity, but irrigated rice culture is also practiced partly, where rice is usually double cropped using modern high-yielding cultivars similar to IR36 for the second crop. Figure 1123) represents rice yield simulated for IR36, with assuming two different T50 values for heat-stress sensitivity, transplanted at 1st day of each month, under the current and GISS doubled [CO2] climate. The GISS climate model predicted 5 °C or more temperature increase during December to May period (dry season) than the current temperatures in Khon Kaen. Such temperature conditions in Khon Kaen will bring about extensive spikelet sterility and yield reduction, for rice planted during December to March period, even though the cultivar was assumed to be heat stress tolerant. Similar results were also obtained at Pyay and Yezin, Myanmar under all climate scenarios. These results on the Southeast Asian continent may suggest that the projected global warming climate would make difficult to continue double rice cropping currently practiced, unless effective adaptive technologies would be developed.
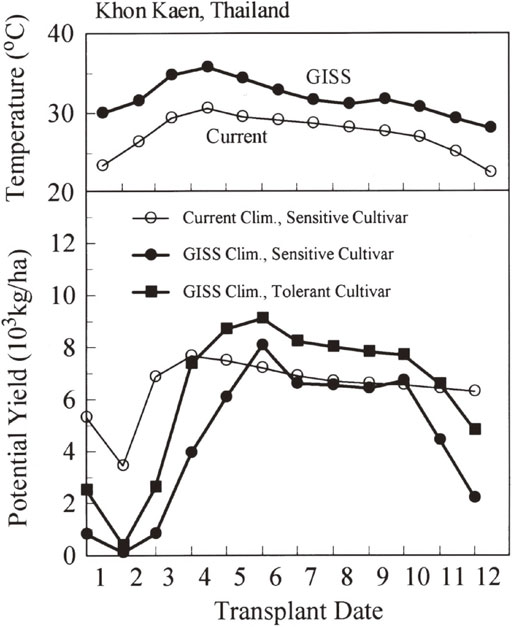
Annual change in the monthly mean temperature in the current climate and that in the doubled [CO2] climate predicted by GISS for Khon Kaen, Thailand (top), and simulated rice yields by SIMRIW for heat-stress sensitive and tolerant genotypes transplanted at first day of each month under the current and GISS climates (bottom).23)
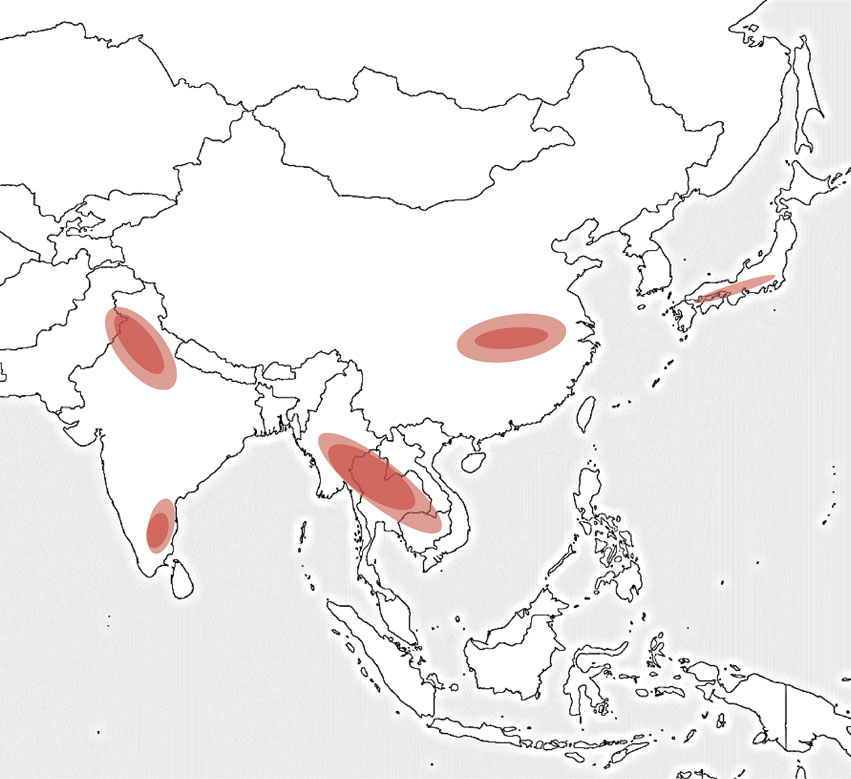
On the basis of our previous predictions,20)–23) and the later impact assessment studies41),44),45),47)–49),52)–54),56),135),156),163) and also on the observations of spikelet sterilities58),59),61),68),157)–162) discussed earlier, five high risk regions for rice production in Asia to global warming may be pointed out as illustrated in Fig. 12. Namely, rice cultures in southeast India (AEZ 1), northwest India (AEZ 6), continent of Southeast Asia (AEZ 2), central China (AEZ 6) and south-central to southwestern Japan are likely to suffer significant yield reductions by the projected global warming, mainly through increased spikelet sterility and shortened growth duration, unless effective adaptation measures are developed.
In conclusion, the projected doubling [CO2] and associated global warming will substantially increase the yields of wet and single season rice in most Asian regions due to [CO2] fertilizing effects, but reduce the yields in the regions as shown in Fig. 12, mainly due to heat stress at flowering stage. Further, enhancement of rice tolerance to and/or escape from the heat-induced spikelet sterility is the key for the adaptation of rice culture in those high risk regions to projected global warming. Also, further enhancement of the [CO2] fertilizing effects on rice yield is important for adaptation to climate change, given the increasing rice demand in Asia.
5.4. Recent studies on the humidity effect on heat-induced spikelet sterility.Lower spikelet sterilities than that expected from the measurements in phytotrons were recently reported for Ndiae, Senegal,164) and Riverina, Australia,64) where daily maximum temperatures occasionally exceeded 40 °C and relative humidity fell below 20% during the flowering period of rice. The lower than expected spikelet sterilities observed at these hot and dry sites were ascribed to significantly cooler panicle temperatures than the air temperatures due to transpiration cooling.64),164) It is well accepted that such hot and dry air conditions, as in Senegal and Riverina, may reduce rice canopy temperatures as much as 6 °C below the air temperature, based on the prediction (Fig. 13) by the previous model MICLAM (Crop Microclimate and Leaf Action Model),165) in which energy and mass transfer processes within crop canopy were modeled as a function of environmental conditions, and also, on the recently developed model IM2PACT166) to predict panicle temperature. However, a careful consideration is necessary in comparing the spikelet sterility obtained from phytotron experiments with that observed in a field, because phytotron data were based on the measurements on the spikelets that flowered98) or on the panicles that emerged28),32) during a constant temperature treatment period, but the sterility observed in a field is an averaged value over flowering period of about 10 days in which individual spikelet encountered different temperature conditions at flowering time.
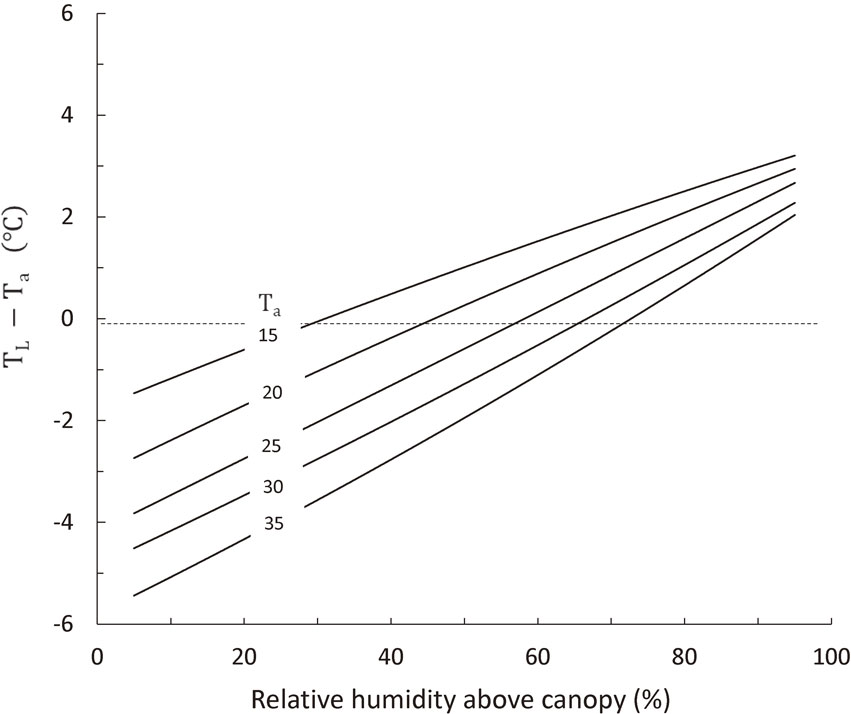
Leaf canopy (TL) – air temperature (Ta) difference as a function of relative humidity and air temperature, as simulated by the Crop Microclimate and Leaf Action Model (MICLAM) for rice with 4 in LAI, at 1 m s−1 in wind velocity and 697 W m−2 in solar radiation.165)
Attempts were made to estimate heat-induced spikelet sterility of rice based on panicle temperatures at flowering time as a function of temperature and humidity.164),167) Application of MICLAM or IM2PACT for the prediction of spikelet sterility based on the panicle temperature at flowering time, however, requires many number of empirical relations for describing flowering time in a day, frequency distribution in the heading day of tillers in a field, canopy architecture and stomatal responses to environment as a function of genotype and environment, of which generalizations need further studies. For the sake of simplicity, the heat-induced spikelet sterility was modeled in SIMRIW only by one variable of averaged daily maximum temperature over flowering period (TM) as a temperature index (does not necessarily mean flowering time temperature) and one genetic parameter T50. It is worth to note that the TM over flowering period observed in Senegal was lower than 35 °C,164) and that SIMRIW (Eq. [1]) estimates percentage spikelet sterility in Senegal to be 20.3% for heat-stress sensitive cultivar and 6.1% for heat-stress tolerant cultivar by using 35 °C for TM, which agrees well with the observed sterility percentage of about 10% to 20%.164) Considering this and the panicle temperature being an unstable variable affected by frequently changing wind and clouds, a simple model, such as spikelet sterility as a function of TM and mean minimum humidity over flowering period, may be practically useful for the global estimation of spikelet sterility in hot and dry areas. Crop microclimate models such as MICLAM and IM2PACT are effective for in-depth analysis of transpirational cooling effects on the spikelet sterility at a given location.
The results at Riverina showed that, despite panicle temperature inside the field became minimum (lower than 35 °C) by transpiration cooling, still spikelet sterilities of 14% to 24% were observed depending on the distance from the field edge.64) Further, it was shown that spikelet sterility observed in Riverina was mainly due to extremely low pollen germination percentage (less than 2%) on the stigma,64) while the sterility under humid conditions was mainly due to reduced number of pollen grains shed on the stigma.28),98) These results suggest that some negative effects of extremely high water-vapor pressure deficit of air might be involved in the sterility observed in Riverina. There are some reports that suggest direct effects of extremely high vapor pressure deficit on the sterility: the stigma desiccation under hot and dry conditions;161) pollen desiccation;168) and that extensive spikelet sterility observed in Sudan was negatively correlated with relative humidity at flowering.169) Also, observations of spikelet sterility were reported in such dry areas as India, Pakistan, Iran, Iraq, Saudi Arabia, Egypt, Mauritania, Senegal, Mali, Niger and U.S.A.99) Further studies are needed both on the direct (desiccation) and indirect (transpirational cooling) effects of high vapor pressure deficit on the spikelet sterility.
The review described above suggested number of adaptation measures for irrigated rice cultures in Asia to the projected increase in the atmospheric [CO2] and associated global warming. Those include — (1) altered cultivars and cropping seasons to avoid environmental stresses; (2) application of enough N fertilizers to maximize [CO2] fertilizing effects;43),71) (3) development of heat stress tolerant or escapable genotypes; and (4) development of high yielding cultivars under elevated [CO2]. While the former two measures are applicable on farm level, provided that fertilizers and water are available and cropping systems are allowed for, the latter two measures require strategic research and development. For this reason, this review focuses on the adaptation of the latter two measures and describes recent research progresses towards the development of adaptive rice genotypes.
6.1. Research for development of heat-stress tolerant and escapable cultivars.The studies by rice model SIMRIW on the effects of projected climate change on Asian rice production18),21)–23) revealed the heat-induced spikelet sterility is the key plant factor for adaptation of rice culture to global warming in hot regions in Asia, and highlighted the previous work of Satake and Yoshida (1978).98) They showed that high temperatures above 35 °C at flowering stage induced spikelet sterility in rice through inhibition of pollination, and that there were large genotypic difference in the spikelet sensitivity to heat stress at flowering time, but spikelets of all the cultivars were investigated as being 100% sterilized above 41 °C. Interestingly, heat stress sensitivities of rice genotypes during flowering were not related to their origin,99) indicating that indica cultivars from tropics are not necessarily more tolerant to the heat stress than japonica cultivars from temperate regions. These previous results were confirmed by our TGC and phytotron experiments.11),14),28),44) Further, it was shown that there was also a large genotypic difference in the flowering time of day, and that genotypes that flowered early in the morning before temperature rise escaped heat stress of midday.68),99),158) Therefore, development of rice genotypes having higher heat tolerance and/or earlier flowering traits than existing cultivars are the key for adaptation to global warming of rice cultures, in high risk areas of heat-induced spikelet sterility.
A series of processes take place from anther dehiscence at flowering to seed sets in rice: anther dehiscence, pollen shedding, pollination, pollen germination, fertilization and onset of grain growth. A failure in any one process leads to spikelet sterility. Extensive studies were made at IRRI around 1980 to clarify genotypic difference in rice heat tolerance and to identify the major process and traits associated with the genetic difference in the tolerance.99) It was found that the difference in the tolerance was closely related to the difference in the number of pollen grains shed on stigma.98),99) Genetic analysis for this trait, by the crossing of tolerant and susceptible genotypes, showed that this trait was controlled by more than one gene.170) Also, an attempt was made to incorporate early-flowering characteristics of O. glaberrima (African rice) to O. sativa by crossing, thereby resulting in producing earlier flowering progeny by about one hour than the sativa parent IR 36.171) Unfortunately, the research at IRRI for breeding of more tolerant to and/or escapable from the heat stress at flowering, terminated in early 1980s, presumably due to the passing away of Dr. Yoshida in 1984 who had been taking the leadership of the research.
After confirming the previous result98),99) that major genetic difference in the tolerance existed in the number of pollen grains shed on the stigma, our group made in-depth investigations on the mechanism and genetic difference in the anther dehiscence of rice (Matsui et al.28)–32),34)). The results showed that the dehiscence is a water requiring process, in which pollen grains rapidly swell in response to floret opening at first, and then, the pressure produced by the pollen swelling raptures the septum and splits the anther theca at the stomium,29),30) wherein high temperature suppressed pollen swelling and inhibited anther dehiscence.31) It was found that a heat-stress tolerant cultivar had an easily rupturing septum structure with larger dehiscence cavity surrounded by thinner cell layers than the susceptible cultivar.32) Further, it was indicated that the length of dehiscence in the basal part of anther (see Fig. 14) was highly correlated with pollination viability under a hot and humid condition, over a wide range of rice genotypes, and that the dehiscence length under hot and humid conditions was highly correlated to that under ambient conditions,34),57) indicating that the basal dehiscence length is a stable genetic trait. On the basis of these results, the length of the basal dehiscence of anther at flowering time was proposed as the selection marker for heat tolerant genotypes.
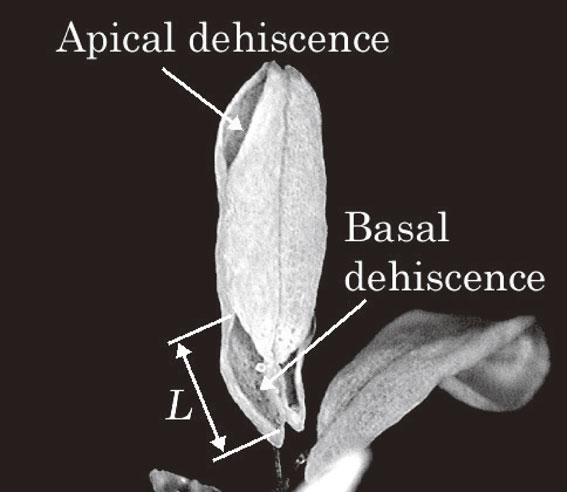
Photograph of rice anther showing the apical and basal dehiscence, and the length of basal dehiscence.34)
The proposed trait of the length of basal dehiscence well explained genetic variability in heat-induced spikelet sterility observed in China under field conditions,58),59) and also, in a phytotoron experiment in Japan.60) The trait was subjected for Quantitative Trait Locus (QTL) analyses using Backcross Inbred Lines (BILs) and Chromosome Segment Substitution Lines (CSSLs), resulted in the detection of some effective QTLs for future marker-assisted breeding of heat-tolerant genotypes.65),69)
On the other hand, attempts were made by the group of Institute of Crop Science, National Agriculture and Food Research Organization, Japan,66),172) to introduce Early Morning Flowering (EMF) trait of wild rice into cultivated rice, to escape heat stress at midday. An introgression line was developed by transferring the EMF trait from wild rice O. officials into the genetic background of O. sativa cv. Koshihikari, flowered a few hours earlier than Koshihikari in a greenhouse.172) By using flower opening time QTL designated in the EMF introgression line, Near Isogenic Lines (NILs) for EMF were developed in the indica-type genetic background.66) The EMF isogenic lines of cultivars Nanjing11 and IR64 flowered 1.5 to 2 hours earlier than Nanjing11 and IR64, and the EMF isogenic line of IR64 escaped from the heat-induced spikelet sterility, while IR64 severely suffered spikelet sterility in the growth chamber.66) This promising achievement is expected to be tested for its effectiveness under field conditions in the high risk areas of heat-induced spikelet sterility in Asia.
Since our model analysis with SIMRIW first pointed out the heat-induced spikelet sterility as the key plant factor for the adaptation of Asian rice culture to projected global warming, marked progress has been achieved in these 20 years in the research for development of adaptive genotypes to global warming.
6.2. Research for development of high-yielding cultivars under elevated [CO2].Development of rice cultivars that exhibit much higher yield under elevated [CO2] is supremely important for the adaptation of Asian rice farming to the projected climate change, given the increasing rice demand associated with population growth and economic development. As shown already, a wide cultivar difference was observed in the biomass and yield responses to elevated [CO2] in TGC,44),173) and FACE73),76) experiments. We suggested that rice genotypes that have high yield potential under the ambient [CO2] also exhibit high yield under elevated [CO2].25)
Plant traits associated with higher yield responses to [CO2] in rice were explored, by using the rice model GEMRICE (Fig. 7) with ARICENET (section 4.2) experiment data on various genotypes grown under diverse environments in Asia. The model simulation suggested that genotypes having larger number of spikelets per unit area under ambient [CO2] responded more to elevated [CO2] in the yield over diverse growing environments across Asia (Fig. 15).26) This agreed well with the measurements in FACE.73),76),78) The large number of spikelet per unit area is also an indispensable character for high yielding rice under ambient [CO2]. The analysis by GEMRICE also showed that rice genotypes having higher response to [CO2] have higher nitrogen (N) use efficiency in spikelet production,26) as spikelet number produced per unit area was proportional to plant N content at the late stage of spikelet differentiation as shown in Fig. 8.
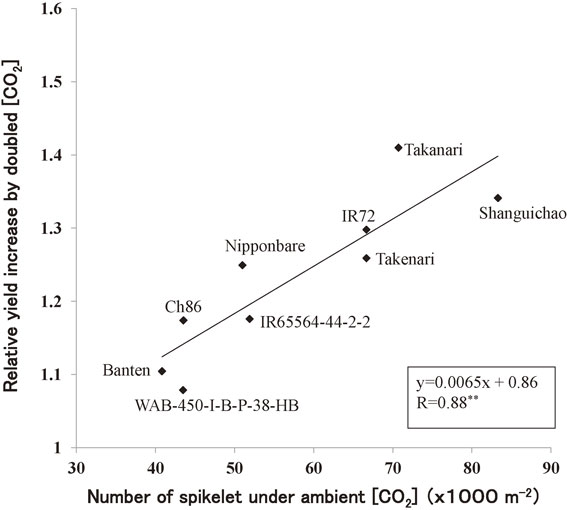
Relationship between the numbers of spikelet under ambient [CO2] and the relative yield enhancement by doubling [CO2] for different rice cultivars, predicted by GEMRICE.26)
We made further investigation to explore genetic resources for the high N use efficiency in spikelet production, using Rice Diversity Research Set of germplasm (RDRS) developed by National Institute of Agro-biological Sciences (NIAS), Japan.174) The RDRS consisted of 64 diverse rice genotypes selected from about 30,000 accessions of NIAS gene bank, based on diversity in genome-wide Restriction Fragment Length Polymorphism (RFLP).174) The results showed that there is a significantly large genotypic variability in the N use efficiency, and that genotypes with high N use efficiency are mostly found in aus-type indica, but not in japonica (Fig. 16).40) The genotypes that showed highest N use efficiency in spikelet production in RDRS are ARC7291 and Nepal555 (aus-type indica from India) and Takanari (an improved indica from Japan). Further, higher N use efficiency of genotypes was significantly correlated with panicle morphological traits of larger number of secondly rachis-branch differentiated on a primary rachis-branch, and with larger number of spikelet on a secondary rachis-branch.40) A gene was identified that increases spikelet number per panicle through accumulation of cytokinin in inflorescence meristems in rice by Ashikari et al.175)
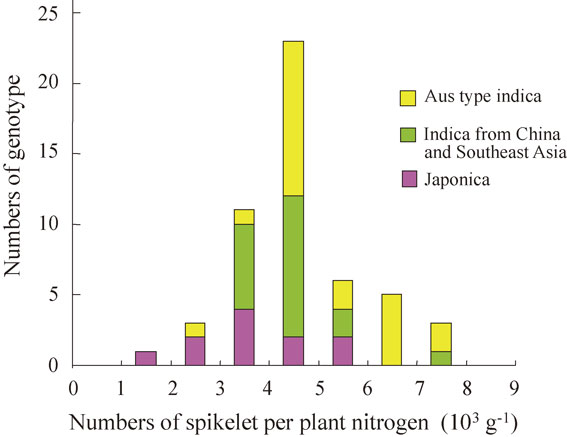
Further investigation was made for other plant traits associated with high yielding potential under ambient [CO2], and revealed that high yielding cultivars also had higher leaf photosynthetic rate, which in turn was associated with higher stomatal conductance and leaf N content.35)–39),176) Using RDRS, we explored rice genetic resources for the two important traits of high stomatal conductance and high leaf N, and identified Tupa729 (japonica from Bangladesh), Keiboba (non-aus type indica from China) and Shoni (aus type indica from Bangladesh) for high stomatal conductance, and Rexmont (japonica, from U.S.A.), Urasan1 (japonica, from Japan) and Padi Kuning (non-aus type indica from Indonesia) for high leaf N content.39)
As shown above, useful gene sources for the traits associated with high yields under elevated [CO2] were identified in diversely different rice genotypes over the world. It is expected that these traits and genetic resources will be subjected to further genetic studies to identify effective genes for breeding of cultivars having higher yield under elevated [CO2], which is highly required for sustaining increasing rice demands in Asia.
The brief reviews so far made on the studies on the effects of climate change on rice production in Asia, in relation to our previous studies, revealed that still a number of subjects are left for further studies, for better understanding of climate change effects on rice. In concluding this review, the author would like to point out further research needs, focusing on the three areas: the measurement of temperature and [CO2] effects on rice, modeling the growth and yield responses of rice to projected global warming, and the research towards development of genotypes adaptive to global warming under increasing rice demand.
7.1. More measurements of rice responses to high temperatures and [CO2].Recent studies indicated that heat-induced sterility is not only affected by air temperature but also by air humidity through its transpirational cooling effects on panicles.64),164) It is well accepted that panicle temperature can be remarkably lowered than the air temperature under hot and extremely dry conditions, which may alleviate heat induced spikelet sterility. On the other hand, as discussed in the section 6.2, there are some reports suggesting negative effects of high water-vapor pressure deficit of air on spikelet sterility, through desiccation of floral organs. Therefore, more research is necessary on the direct (desiccation) and indirect (transpirational cooling) effects of high vapor pressure deficit on rice spikelet sterility at flowering stage, in order to form basis for a more general model for predicting heat-induced spikelet sterility.
New experiment system FACE, that enabled to observe elevated [CO2] effects on rice under field conditions, indicated lower responses of rice to elevated [CO2], in biomass production and yield, than those observed in growth chambers. Further studies are needed for clarifying the mechanism that caused this quantitative difference between FACE and other enclosure experiments like TGC, including the research on the effects of largely fluctuating [CO2] in FACE on crop physiology, growth and yield.
However, most important research needs exist in scarcity of measurement on interacting effects of increased temperature and [CO2] on rice, that is the central issue on global warming and rice production. Measurements suggesting the interacting effect of temperature and [CO2] on heat-induced spikelet sterility are limited to those of Fig. 444) and other reports14),27) of nearly 20 years ago, despite it has potential effects more than offsetting the positive effects of elevated [CO2] on rice. Figure 4 implies that heat-induced spikelet sterility, which is observed on not a few occasions under the current climate in hot areas, would occur more frequently and severely under elevated [CO2]. More research is necessary on the interacting effects of high temperature and elevated [CO2] on the spikelet sterility and on other growth and yield formation processes.
7.2. Increasing the certainty of rice model.In the mid. 1990s, when we evaluated the climate change effects on rice production in Asia, the General Circulation Models (GCMs) were limited to those of GISS, GFDL and UKMO, and the rice models to those of SIMRIW (Horie, 1987),9) CERES-Rice (Singh et al., 1993)177) and ORYZA1 (Kropff et al., 1995).136) Since then, various kinds of GCMs and rice models have been developed, and now are recognized as 42 GCMs81) and 16 rice models.88) Using various climate scenarios provided by diverse GCMs and many rice models, a large number of studies have been made to predict the effects of projected climate change on rice production in various regions of Asia, as already discussed in the previous sections. The situations are similar in other crops as in wheat, maize and soybean and large variations are recognized in the projected future crop productions under projected climate change, depending on climate scenarios and crop models.178) Further, it was indicated that there are large uncertainties in crop yields predicted by different crop models for same environment conditions.88),178) Therefore, increasing the certainty of rice models is the important subject of further studies, for better understanding of the projected climate change effects on rice production in Asia.
As far as the author’s reviews are concerned, there are two causes that are considered for the uncertainty of rice models: inadequacy in modeling the important process of yield determination, and insufficiency in model calibration and validations. It was suggested that inadequacy in modeling leaf area development caused large difference in the simulated biomass yield of rice.88) It was also suggested that inadequacy in the model description of heat-induced spikelet sterility caused a large variation in simulated rice yields,167) and that many crop models did not even account for the stress temperature effects on the yield.179) Since the heat-induced spikelet sterility gives critical effects on rice yield and there is a large genetic variability in the heat stress sensitivity of spikelet at flowering stage,33),60),98),99) this process should adequately be modeled with explicit genetic parameters for the spikelet sensitivity to heat, as in T50 in SIMRIW.
The insufficiency in model calibration and validation could be seen in many modeling studies, in which model calibrations and validations were made against limited number of data sets obtained under narrow range of environments, despite the models that contained more than 20 empirical parameters. Model calibration is required to be conducted against sufficiently larger number of datasets than the number of empirical parameters. Further, model calibration and validation should be done for each process, independently of other process, to avoid multi-collinearity of parameters, by inputting measured data for the variables that are the outputs from other processes. Some studies calibrated SIMRIW against yearly changes of actual regional yield to modify the parameters built in the model.48),50) This needs to be done very carefully, however, because the actual yield variations generally include those effects of damages by insects, diseases, typhoons and floods, and crop managements, which SIMRIW does not account for. Since SIMRIW is a model to predict the potential rice yield that is determined by rice physiology and climate, but not the actual yield, such calibrations might impose those non-climate effects on physiological parameters, which might reduce model generality and applicability to unprecedented environments of global warming.
Calibrations of the model for simulating climate change effects on rice should be done against sufficient numbers of data-sets from well-managed field experiments that cover wide range of environment as in ARICENET and from temperature by [CO2] treatment experiments as in TGC. However, accumulations of such data-sets are scarcely seen in this 20-year period, except those from FACE only on [CO2] effects on rice, so that the situation is ‘so many models, but so few measurements’. Clearly, more experiments and measurements are necessary. Also, crop models need to be more objective oriented and simple structured, with minimum numbers of empirical parameters, because number of empirical parameters increase with the increase in model complexity, which not only makes it difficult to obtain necessary data for setting parameters, but also it may limit model applicability beyond the environments under which the data were obtained.
Model development in tandem with measurements is required for the development of this newly emerged science in the right way.
7.3. Development of adaptive rice genotypes to global warming.The most remarkable progress in this area is seen in the development of near isogenic lines of indica and japonica cultivars that have early flowering traits for escaping from heat-induced spikelet sterility.66),172) Further investigation is required for testing the effectiveness of these near isogenic lines under field conditions in heat-stress-prone areas in Asia. Development of heat-stress-tolerant cultivar is also important to ensure stable rice productions under global warming, for it is yet uncertain if early flowering trait alone could minimize the predicted heat-induced spikelet sterility under global warming. Significant progress is also seen in the studies on heat stress tolerance: the clarification of the mechanism for heat-stress tolerance,29),57) the identification of the length of basal dehiscence of anther as a genetic trait for the tolerance,34),60) and the identification of QTLs for controlling the dehiscence length.65),69) Further study is needed towards development of heat-stress-tolerant genotypes using those QTLs identified, while exploring for other traits that may also be associated with the heat-stress tolerance.
Significant progress is also seen in the research towards development of high yielding cultivars under elevated [CO2]. It was indicated that three genetic traits were associated with high yielding rice under elevated [CO2]: the high N use efficiency in spikelet production, the high stomatal conductance and the high leaf N content.26),36),39),176) Further, genetic resources for each of these traits were identified from the investigation over a wide range of rice germplasms.39),140) It is important to identify from the genetic resources, the genes that control these traits, and, by integrating the identified genes in a plant, to develop cultivars that have high yield potential under elevated [CO2]. These studies are highly requested for ensuring food security in Asia, under increasing population and projected global warming.
I would like to express my sincere appreciations to Dr. Koichiro Tsunewaki, Prof. Emeritus of Kyoto University and member of Japan Academy, for encouraging me to write this article to Proceedings of the Japan Academy, Series B.
This review is mainly based on the series of collaborative studies on climate change and rice, conducted at Laboratory of Crop Science, Kyoto University. I deeply thank Dr. Hiroshi Nakagawa and Dr. Hiroe Yoshida at National Agriculture and Food Research Organization, Prof. Tsutomu Matsui at Gifu University, Dr. Junichi Nakano, former Associate Prof. of Kyoto University, Prof. Hang-Yong Kim at Chonnan National University, Korea, Prof. Koki Homma at Tohoku University, Dr. Masao Ohnishi at Ministry of Education, Culture, Sports, Science and Technology, and many former students at Kyoto University, for their significant contributions to the studies.

Takeshi Horie was born in 1942 in Shimane Prefecture, Japan and graduated from Faculty of Agriculture, Kyoto University in 1965. He worked as a researcher for National Institute of Agricultural Sciences (1965–1983), a senior researcher for National Institute of Agro-Environmental Sciences (1983–1984), and the head of Laboratory of Agricultural Meteorology for Hokuriku National Agricultural Experimental Station (1984–1985). He received his doctor's degree from Kyoto University in 1981.
He worked as a professor at Faculty of Agriculture (1985–1997) and Graduate School of Agriculture (1997–2006) of Kyoto University. He conducted researches on measurements and modeling of crop responses to environments throughout his career and developed a dynamic model to predict rice growth and yield based on environments. He clarified potential effects of the projected climate change on rice production in Asia by using the model and identified rice physiological and morphological traits required for breeding of rice genotypes adaptive to climate change. He became the president of National Agriculture and Food Research Organization of Japan, and steered the development and conduction of many national research projects for technology developments for agriculture and food industries (2006–2014). He also contributed to international agriculture research as a member of the Board of Trustees for the Africa Rice Center (2001–2006) and the Independent Science Panel for the International Research Program: Climate Change, Agriculture and Food Security (2012–2014). Due to these significant contributions, he was awarded the prize of the Society of Agricultural Meteorology of Japan in 1986, the Japan Prize of Agriculture Science in 1999, the Nippon Agricultural Research Institute Prize in 2016 and the Japan Academy Prize in 2018.