Abstract
Renal counterbalance, involving compensatory hypertrophy of the healthy kidney and atrophy of the injured one, remains incompletely understood, particularly at the glomerular level. In this study, we employed NEP25 mice, which selectively express human CD25 in podocytes, enabling precise induction of unilateral podocyte injury through the administration of LMB2, a CD25-targeted immunotoxin. Using a two-kidney, one-nephropathy (2K1N) model, we demonstrated that asymmetric changes in renal blood flow and proteinuria, with histological and transcriptomic analyses uncovering distinct pathological and molecular features between the injured and contralateral healthy kidneys. Notably, an imbalance in intrarenal angiotensin (Ang) II levels was observed, and angiotensin-converting enzyme inhibition ameliorated the glomerular damage and restored perfusion. These findings indicate that local Ang II dysregulation is a key factor in renal counterbalance. Our study provides the first glomerulopathy-based experimental platform to dissect asymmetric renal adaptation, offering fundamental insight into the homeostatic mechanisms of renal function in health and disease.

1. Introduction
Chronic Kidney Disease (CKD) is a significant public health challenge worldwide that significantly affects global morbidity and mortality rates.1) Recent advances in the understanding of the pathophysiology involved in acute kidney injury (AKI) and its progression to CKD highlight the critical importance of early detection and therapeutic intervention in halting the progression of CKD. The pathophysiological mechanisms underlying AKI, including renal hypoperfusion, nephrotoxicity, and immune response, lead to cellular stress, inflammation, and tissue damage.2) Furthermore, various molecules are critical in inflammation and hypoxia, contributing to maladaptive repair processes such as mitochondrial dysfunction, immune system responses, and cellular senescence of renal cells. Moreover, research has probed into the molecular underpinnings of the transition from AKI to CKD.3),4)
Despite significant advances in understanding the intricate pathophysiology of AKI and its transition to CKD, considerable knowledge gaps remain, particularly concerning the adaptive responses of kidneys to unilateral injuries. Conventional research models, such as unilateral ureteral-obstruction (UUO) and unilateral ischemia-reperfusion injury (IRI) models, have been instrumental in elucidating the mechanisms underlying renal impairment.5) Researchers estimate that these unilateral kidney injury models have a lower mortality risk and methodological simplicity, facilitating an in-depth investigation of renal injury and its repair mechanisms. For example, comparisons between the injured and the healthy contralateral kidney have demonstrated the upregulation of tumor necrosis factor (TNF) -α, monocyte chemotactic protein (MCP) -1, and transforming growth factor (TGF)-β1, along with the downregulation of hypoxia inducible factor (HIF)-1α in the injured kidney.6),7) However, these conventional approaches often do not capture the full spectrum of the response of a damaged kidney, including its participation in critical compensatory processes.
When one renal unit experiences renal dysplasia (impaired function) or renal artery stenosis, it prompts ‘hyperfiltration’ in the other renal unit, illustrating renal compensatory mechanisms. Hinman observed that, following ureteroduodenal anastomosis of the right kidney, the right kidney underwent atrophy, whereas the left kidney exhibited compensatory hypertrophy.8) This dynamic underscores the competitive interplay between the kidneys’ reserve capacities as they strive to reestablish equilibrium between the right and left renal tissues in response to an altered workload. Consequently, one kidney undergoes hypertrophy while the other experiences atrophy, introducing the concept of ‘renal counterbalance’.9) Although numerous studies have examined the disparities between an impaired kidney and its healthy counterpart, research on the differential effects of unilateral and bilateral injuries to elucidate the precise underlying mechanisms remains limited. Moreover, the predominant focus has been on tubulointerstitial injury models such as UUO and unilateral IRI, with other injury response types and their significance in kidney disease progression receiving less consideration.
This study aimed to enhance our understanding of these dynamics using NEP25 mice that express human CD25 in podocytes.10) These mice exhibited focal segmental glomerulosclerosis (FSGS) in a dose-dependent manner upon administration of LMB2. We introduced a novel NEP25 mouse model incorporating two distinct kidneys through advanced transplantation techniques and monitoring: one kidney is an NEP25 kidney and the other is a wild-type (WT) kidney that functions normally. LMB2 injection into the mice could induce unilateral glomerular injury at the intended time. By comparing renal outcomes and pathophysiology in mice with a unilateral nephropathic kidney (two-kidney, one-nephropathy (2K1N)) and those with bilateral nephropathic kidneys (two-kidney, two-nephropathy (2K2N)), we provided a detailed perspective on renal counterbalance mechanisms.
2. Materials and methods
2.1. Ethics statement.
All animal experiments in this study were approved by the Animal Use and Care Committee of the University of Tsukuba (Protocol no. 130163).
2.2. Mice.
The podocyte injury model used in this study, involves NEP25 mice expressing human CD25 specifically in podocytes.10) Injection of anti-human CD25 antibody variable region conjugated with Pseudomonas exotoxin (LMB2), which binds to human CD25, induces selective podocyte injury. NEP25 mice subsequently develop proteinuria and FSGS lesions resembling human diseases, histologically characterized by segmental hyalinosis. NEP25 and WT mice used in this study had a C57BL/6N genetic background. All mice were maintained under a 12-hour light-dark cycle, and water and standard rodent chow were available ad libitum. Each cage housed one individual.
2.3. Two-kidney, one-nephropathy; two-kidney, two-nephropathy models.
Eight- to twelve-week-old male mice were subjected to allograft kidney transplantation as previously described, but with modifications (Supplementary Methods).11),12) Briefly, kidneys from WT donor mice (transplanted WT kidneys, non-nephropathic kidneys) were transplanted into recipient NEP25 mice (2K1N, n = 5). In this model, a non-nephropathic kidney is transplanted into a recipient mouse with one native NEP25 kidney, which functions as a WT kidney unless LMB2 is administered. As controls, kidneys from NEP25 mice (transplanted NEP25 kidneys, nephropathic kidneys) were transplanted into NEP25 recipient mice (2K2N, n = 5), with one native NEP25 kidney removed during the procedure. All transplanted kidneys were examined using ultrasonography to rule out atrophy and hydronephrosis before LMB2 administration.
2.4. Nephropathy model.
Ultrasonography was performed approximately two weeks after renal transplantation, and LMB2 (1.75 ng/g per body weight) was injected via the tail vein three weeks after kidney transplantation. Vehicle (PBS containing 0.1% BSA) was injected as a control. Twenty-four-hour urine samples were collected in metabolic cages at 0, 5, 8, and 12 days post-injection. Kidney tissues were collected after the mice were euthanized on day 8 or 12. Serum samples were collected by cardiac puncture on day 12. The total protein and creatinine concentrations in the collected urine and serum samples were measured outside the laboratory (SRL, Tokyo, Japan).
2.5. Ultrasonography.
The transplanted kidneys of the recipient mice were examined using an ultrasound imaging system (Vevo 2100 Visual Sonics, Inc, Toronto, Ontario, Canada) with a 40-MHz central frequency transducer. Standard B-mode examination of the kidneys was performed in the long-axis view to measure width and length. The renal blood flow (RBF) was evaluated by acquiring 3D data by creating a series of 0.5-mm intervals of the color Doppler mode sections and then combining these sections into a whole image on days 0, 6, and 11 after the LMB2 administration. Kidneys that met the following criteria were regarded as having hydronephrosis, atrophy, or hypofunction and were excluded from the experiment: left and right kidney size differences > 2 mm in the short or long axis.
2.6. Blood pressure measurement.
Conscious systolic blood pressure was measured using the tail cuff method with a BP-98A (Softron, Tokyo, Japan) before LMB2 injection and on days 5, 8, and 12 after injection. Blood pressure was measured 10–15 times in a single session per day, and the average value was used as the result. The mice were not trained in the blood pressure system prior to the measurement. The measurements were conducted with heating, maintaining a temperature of 38 °C. As previously reported, blood pressure was not affected by LMB2 in NEP 25 mice.13)
2.7. Quantitative (q) real-time PCR.
First-strand complementary DNA was synthesized from 200 ng total RNA by reverse transcription using the ReverTra Ace system (Toyobo, Osaka, Japan). The qPCR was performed using SYBR Green PCR Master Mix and the Thermal Cycler Dice Real Time System (TaKaRa Bio Inc, Shiga, Japan) under the following conditions: 95 °C for 30 s, followed by 40 cycles at 95 °C for 5 s and 60 °C for 30 s, and then at 95 °C for 15 s and 60 °C for 30 s, and finally at 95 °C for 15 s. The relative expression level to that of GAPDH was determined using the ΔΔCt method (Supplementary Table 1).
2.8. Western blot analysis.
Frozen kidney samples were crushed using a Multi-Beads Shocker (Yasui Kikai Co.) and dissolved in lysis buffer (25 mM Tris-HCl [pH 7.4], 150 mM NaCl, 1% NP-40, 1 mM EDTA, 5% glycerol, and 1x protease inhibitors [Nacalai Tesque, Kyoto, Japan]) using a bath-type sonicator (Cosmobio, Bioruptor UCD-250). After centrifugation at 13,200 rpm at 4 °C for 10 min, the protein concentration of the supernatant was determined by Bradford assay using Bio-Rad protein assay dye reagent concentrate (Bio-Rad). The samples were mixed with Laemmli sample buffer containing DTT (final concentration, 100 mM) and denatured at 99 °C for 5 min. The samples, containing approximately 10 µg of proteins, were resolved using 10% SDS-PAGE. Immunoblot analysis was performed as previously described.14) The primary antibodies used were anti-renin antibody and anti-GAPDH antibody (Supplementary Table 2).
2.9. Angiotensin-converting enzyme inhibitor administration.
2K1N mice were divided into two groups (n = 4 each): vehicle and angiotensin converting enzyme inhibitor (ACEI). Mice in the ACEI group were orally administered captopril dissolved in water (25 ng/g body weight/day). Mice in the vehicle group were orally administered water.
2.10. Histological analysis.
The mice were perfused with 4% paraformaldehyde, and renal tissues were subsequently fixed in 4% paraformaldehyde and embedded in paraffin for light microscopic examination. Kidney sections were stained with periodic acid-Schiff (PAS) and periodic acid-methenamine silver (PAMS) for histopathological evaluation. For immunohistochemistry, anti-p57, anti-renin, and anti-Tagln antibodies were used in conjunction with an Avidin/Biotin Blocking Kit (Vector Laboratories, Burlingame, CA, U.S.A.) and a Histofine kit (Nichirei Bioscience, Tokyo, Japan). Sections were counterstained with Mayer’s hematoxylin (Supplementary Table 2). Kidney sections were imaged using a NanoZoomer Digital Pathology System (Hamamatsu Photonics, Shizuoka, Japan) to assess the percentage of glomeruli exhibiting minor abnormalities, glomerulosclerosis with hyaline deposits (FSGS), and collapsing glomerulosclerosis. For transmission electron microscopy, kidney samples were fixed in glutaraldehyde and processed using standard procedures.
2.11. RNA preparation and sequencing.
Both 2K2N and 2K1N mice were divided into two groups (n = 4 each): LMB2 and vehicle injections on day 0. The mice were sacrificed on day 8 and their kidneys were immediately harvested, frozen in liquid nitrogen, and crushed into powder using a multi-bead shocker (Yasui Kikai Co., Osaka, Japan). Total RNA was extracted using the Isogen II reagent (Nippon Gene, Tokyo, Japan) in accordance with the manufacturer’s instructions and quantified using a NanoDrop 2000 instrument (Thermo Scientific, MA, U.S.A.). RNA-Seq analysis was performed as previously described.14) The sequenced reads were mapped to the mouse reference genome mm10 and quantified using the CLC Genomics Workbench version 10.1.1 (Qiagen, Hilden, Germany).
2.12. Identification of differentially expressed genes (DEGs).
Distinct gene expression patterns were compared using principal component analysis (PCA) and volcano plots using the CLC Genomic Workbench software, version 10.1.1 (Qiagen). To estimate the expression pattern of the transcripts, read counts were normalized by calculating the number of reads per kilobase per million (RPKM) for each transcript in individual samples using the CLC Genomic Workbench software. These RPKM values with a log 2-converted fold-change of 2 and -2 and a false discovery rate (FDR) at P < 0.05, were considered to be DEGs based on gene expression in the transplanted WT kidneys (transplanted WT kidney) of the 2K1N mice.
2.13. Measurement of renal Ang II content.
Frozen kidney powder was used to measure renal Ang II content. Renal Ang II content was measured using radioimmunoassay, as previously described.15) The value for the internal control sample measured in the present study was similar to that measured in a previous study (188 vs. 191 fmol/g of tissue).16)
2.14. Statistical analysis.
T-tests, one-way and two-way ANOVA, and mixed-effects models were conducted using Prism software (version 10, GraphPad Software). Pairwise comparisons for RNA-seq data analysis were performed with CLC Genomics Workbench (version 10). Statistical significance was defined as P < 0.05.
3. Results
3.1. Renal counterbalance phenomena in the two-kidney, one-nephropathy model.
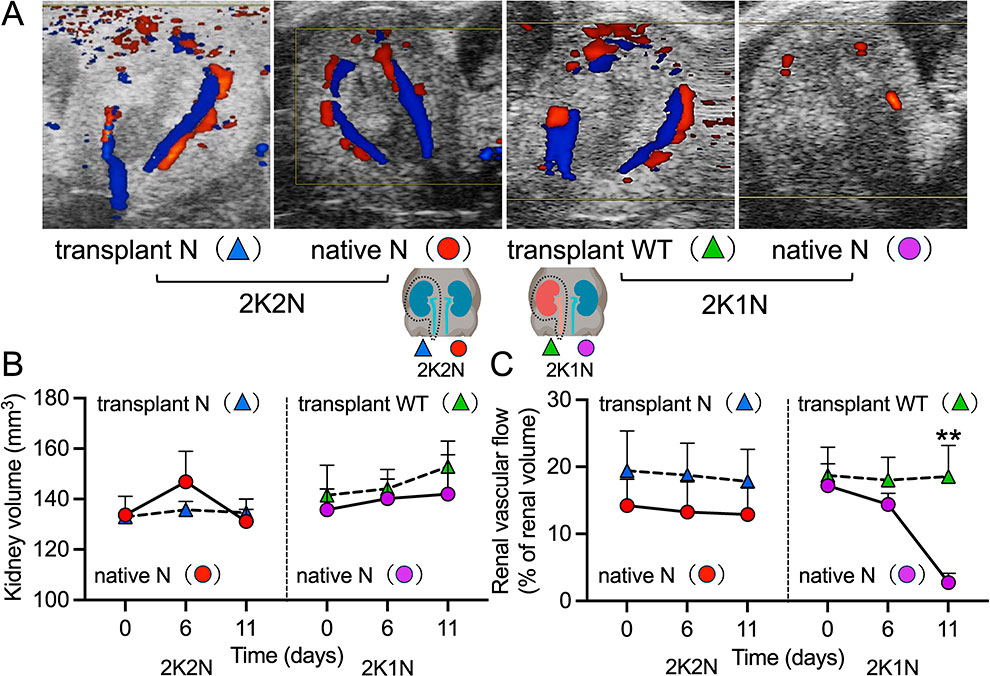
To investigate the renal counterbalance phenomenon between two renal units within an individual, we developed a model where a diseased kidney and a healthy kidney coexist in the same organism. We established a precise kidney transplantation model by transplanting kidneys from WT mice into NEP25 mice. The mice were injected intravenously with LMB2, which induced podocyte injury only in the NEP25 kidney (Fig. 1A). The mice had both WT and nephropathic kidneys (hereafter designated as 2K1N: 2-kidney, 1-nephropathy). Kidneys from NEP25 mice were transplanted into other NEP25 mice, and the mice (designated as 2K2N: 2-kidney, 2- nephropathy) were used as controls. As a disease-free control reference, we injected vehicle into both the mice having WT and NEP25 kidneys (designated as 2K0N: 2-kidney, 0- nephropathy) and the mice having two NEP25 kidneys (designated as 2K0N‘: 2-kidney, 0- nephropathy) (Supplementary Fig. 1A–G).

To distinguish injury-specific responses from effects related to the transplantation procedure, both LMB2-treated and vehicle-treated groups were established in the 2K1N and 2K2N models. Transcriptional changes observed in the vehicle groups were subtracted from those in the corresponding LMB2-treated groups, allowing for the assessment of podocyte injury–dependent alterations while controlling for transplant-related variability.
After LMB2 injection, 2K2N mice developed extraordinary ascites and peripheral edema with body weight gain on day 12. In contrast, 2K1N mice showed no ascites or edema and their body weight tended to decrease (Fig. 1B); however, the changes in body weight between the two groups were not statistically significant. No significant differences in systolic blood pressure were observed between 2K2N and 2K1N mice during the experiment (Fig. 1C). The urinary protein/creatinine ratio was continuously elevated in 2K2N mice. In contrast, the urinary protein/creatinine ratio in 2K1N mice increased on days 5 and 8 and decreased on day 12 (Fig. 1D). At the end of the experiment, no significant differences in creatinine levels were observed between the two groups (Fig. 1E). The total serum protein levels were significantly lower in 2K2N mice than in 2K1N mice (Fig. 1F). The kidney volume was not significantly different between the 2K2N and 2K1N groups on ultrasonography (Fig. 2A, B). RBF, assessed with color Doppler ultrasonography (Fig. 2A, C), remained constant in both kidneys of 2K2N mice. In 2K1N mice, the blood flow of the transplanted WT kidney showed a similar constant pattern; however, that of the native nephropathic kidney decreased slightly on day 6 and was almost disrupted on day 11, which likely caused a remarkable decrease in proteinuria in 2K1N mice on day 12.
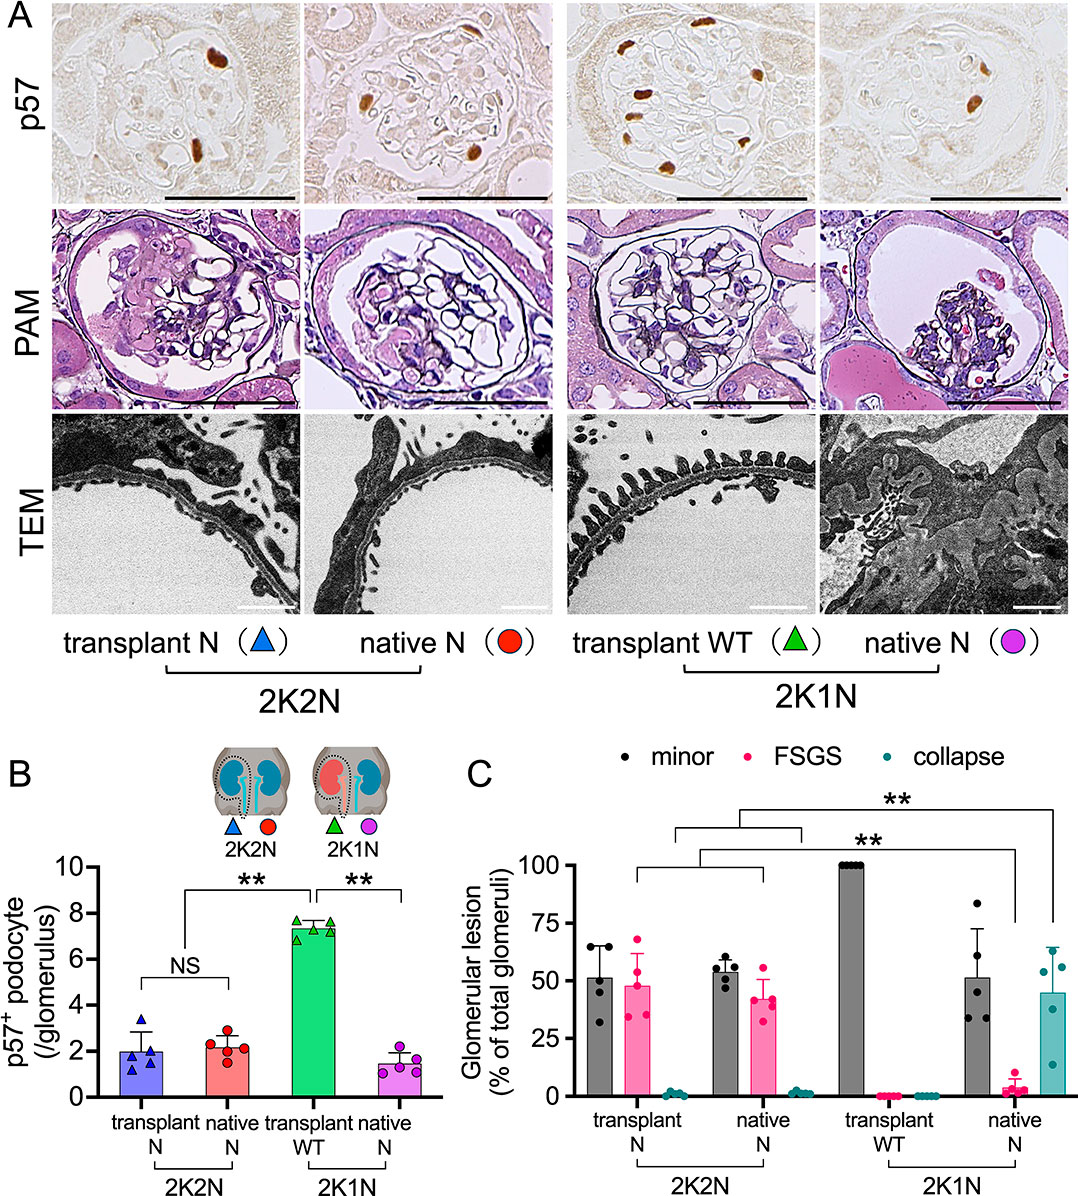
Next, we evaluated the transplanted and native kidneys of 2K1N and 2K2N mice histologically. p57 is a cyclin-dependent kinase inhibitor that serves as a specific marker of terminally differentiated podocytes. Its expression reflects cellular quiescence and podocyte maturity, and loss of p57 expression is associated with podocyte injury. Both the kidneys of the 2K2N mice and the native nephropathic kidney of the 2K1N mice exhibited significantly reduced p57 positive podocytes compared to the transplanted WT kidneys of the 2K1N mice; however, no significant differences were observed among the three types of transgenic kidneys (Fig. 3A, B). Regarding FSGS lesions, both the transplanted and native kidneys of 2K2N mice showed typical segmental hyaline formation of FSGS, consistent with findings in NEP25 mice injected with LMB2 without a kidney transplant (Fig. 3A, C). As expected, the transplanted WT kidneys of the 2K1N mice were normal. Notably, the native nephropathic kidneys of 2K1N mice mainly showed collapsing glomerulosclerosis (collapse). Transmission electron microscopy (TEM) revealed that both the kidneys of 2K2N mice and the native nephropathic kidney of 2K1N mice showed similar diffuse foot process effacement. In addition, only native kidneys of 2K1N mice exhibited wrinkling of the glomerular basement membrane (Fig. 3A).
Our findings suggest that renal counterbalance in the 2K1N model can reduce blood flow to the nephropathic native kidney and halt urinary protein excretion. To explore the underlying mechanisms, we conducted RNA-seq analysis at an earlier time point (day 8) prior to the development of histological lesions (Supplementary Fig. 2A–C). Principal component analysis (PCA) of RNA-seq data revealed distinct clustering of native 2K1N and 2K2N nephropathic kidney samples, separated from transplanted WT kidney (2K1N) samples (Fig. 4A). A heatmap showed the differentially expressed genes among them (Fig. 4B). Kirrel2, Tagln, and Ren1 were identified as candidate genes involved in kidney injury via pairwise comparisons (Fig. 4C–E). The mRNA levels of Kirrel2, Tagln, and Ren1 were measured using quantitative real-time PCR (Fig. 4F–H). Kirrel2 is a member of the nephrin-like protein family (showing homology with nephrin and Neph1) and is localized in the podocyte slit diaphragm, suggesting that Kirrel2 functions as a component of the filtration barrier of the slit membrane. Kirrel2 upregulation may not be directly associated with the podocyte injury in this study, because a previous study showed that Kirrel2 mRNA is downregulated in kidney biopsy samples from patients with focal segmental glomerulosclerosis or membranous glomerulopathy.17) Tagln (also known as SM22α) was expressed mainly in the visceral and vascular smooth muscle cells (SMCs) (Supplementary Fig. 2C) involved in calcium-independent SMCs contraction18) and Ang II-induced vascular contraction,19) suggesting that the elevated Tagln mRNA in our study could be associated with RBF regulation. Among the three genes examined, Ren1 showed significantly different expression levels among the four kidney groups: the transplanted and native nephropathic kidneys of 2K2N mice, the native nephropathic kidneys of 2K1N mice, and the transplanted WT kidneys of 2K1N mice. Ren1 mRNA levels were significantly lower in transplanted kidneys compared to native nephropathic kidneys, suggesting a common mechanism such as denervation via transplantation (Fig. 4H and 5A).20) Given that local activation of the renin-angiotensin system (RAS) plays an important role in the pathogenesis of kidney injury,21) Ren1 mRNA expression in native nephropathic kidneys (2K1N) differs from that in native nephropathic kidneys (2K2N), and that Ang II directly regulates RBF, we next focused on the RAS.

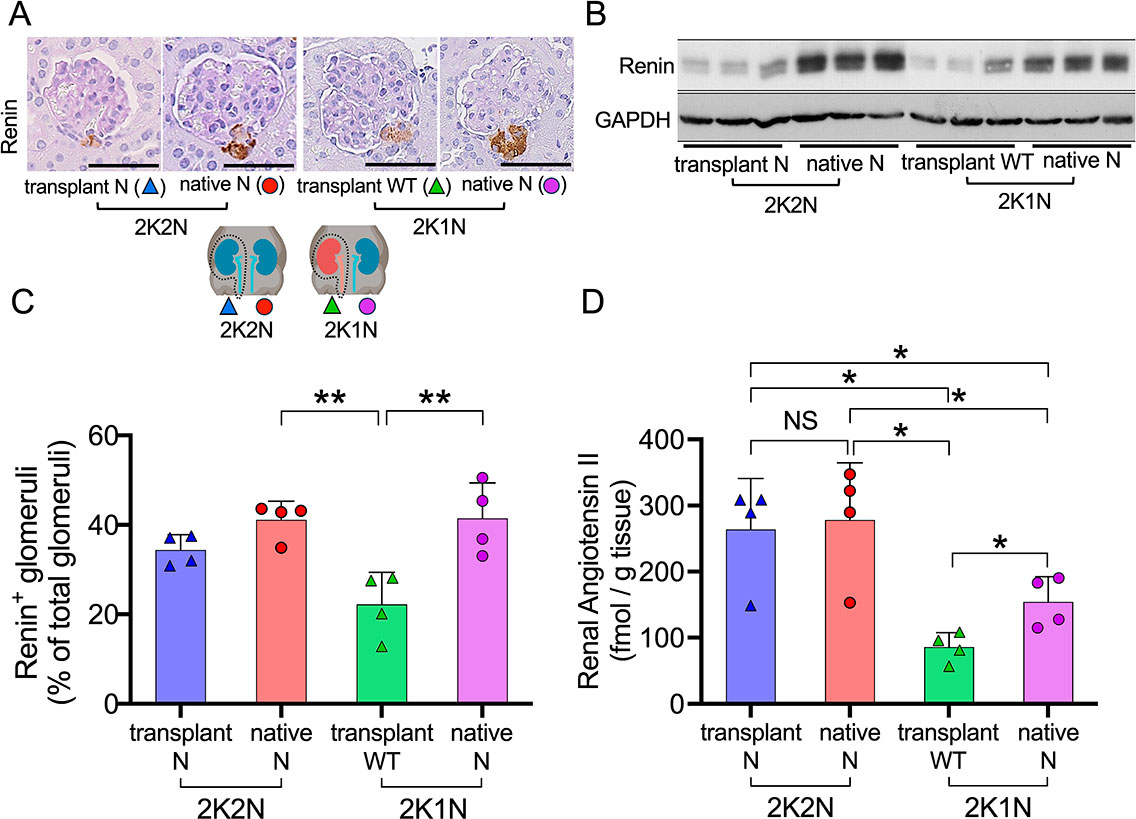
Immunostaining and western blot analyses indicated that the transplanted kidneys of both 2K1N and 2K2N mice contained smaller amounts of renin protein than the native kidneys (Fig. 5A–C), probably owing to denervation caused by the kidney transplant.20) Importantly, our previous study indicated that podocyte injury enhances intrarenal Ang II generation, independent of renin, by increasing the leakage of plasma angiotensinogen into the tubular lumen.13) Therefore, we analyzed renal Ang II levels using radioimmunoassay.
Without LMB2 injection, the levels of Ang II were similarly low in both the transplanted and native kidneys of 2K1N and 2K2N mice, with no significant differences observed (Supplementary Fig. 3A, B). After LMB2 injection, both transplanted and native kidneys of 2K2N mice contained similarly high levels of Ang II (Fig. 5D). Transplanted WT kidneys of 2K1N mice showed low levels of Ang II. Importantly, native nephropathic kidneys contained significantly higher levels of Ang II than the transplanted WT kidneys of 2K1N mice, indicating that Ang II generation was locally upregulated. These findings suggested that a significant imbalance in renal Ang II developed between the transplanted WT kidneys and the nephropathic native kidneys of 2K1N mice, but not in 2K2N mice. Such an imbalance may have caused disruption of RBF and collapsing glomerulosclerosis in the nephropathic native kidneys of 2K1N mice.
3.4. ACEI induce renal counterbalance relief.
To test the hypothesis that an imbalance in renal Ang II disrupts RBF and causes glomerulosclerosis in the nephropathic native kidney of 2K1N mice, 2K1N mice were either left untreated or treated with an ACEI from day 1 to day 12 after LMB2 injection (Fig. 6A). Notably, ACEI treatment attenuated glomerular lesions, reducing both hyalinizing and collapsing glomerulosclerosis (Fig. 6B–D). Urinary protein levels did not significantly differ among the groups, except on day 8 (Fig. 6C), suggesting a point of no return for RBF shutdown in the 2K1N model and highlighting distinct pathophysiological differences between vehicle and ACEI groups. Systemic blood pressure showed no significant differences over time (Fig. 6E). The blood flow in the native kidney in the control group reproducibly showed a dramatic decrease on day 11, which was maintained in the ACEI group (Fig. 6F), suggesting a relief of renal counterbalance. Importantly, all 2K1N mice in both groups maintained body weight without edema or ascites (Fig. 6G), as well as their plasma total protein (Fig. 6H) and serum creatinine levels (Fig. 6I).

4. Discussion
In this study, we aimed to elucidate the systemic and local responses associated with unilateral podocyte injury, focusing on the mechanisms of renal counterbalance between the injured and contralateral renal units. To achieve this, we employed a specialized experimental model that enables precise induction and analysis of podocyte-specific injury. This study utilized the NEP25 mouse model, which selectively expresses human CD25 in podocytes, enabling the targeted induction of podocyte-specific injury through administration of LMB2. This precise control allows for the initiation of injury at defined time points and the subsequent analysis of glomerular damage at various stages before it extends to other renal structures. The model provides a robust platform for investigating early pathological events, permitting clear assessment of differential responses between the two kidneys and the associated compensatory mechanisms, collectively referred to as renal counterbalance. Importantly, this model is not designed to replicate a specific renal disease but instead offers a specialized system for artificially reproducing unilateral podocyte injury. This capability is critical for elucidating both systemic and local responses during the progression of asymmetric renal lesions.
Hinman’s concept of renal counterbalance describes how an injured kidney undergoes atrophy while the contralateral kidney undergoes compensatory hypertrophy.8) Renal counterbalance involves four factors: renal reserve capacity, workload distribution (renal competition), compensatory hypertrophy, and disuse atrophy. This phenomenon has been demonstrated in unilateral ureteral obstruction (UUO) and unilateral ischemia-reperfusion injury (IRI) models, where unilateral injuries tend to exacerbate damage more severely than bilateral injuries.8),22) Although these models are commonly used as CKD models due to their technical simplicity and suitability for long-term studies,23),24) they often overlook the compensatory dynamics of renal counterbalance.
Previous studies have highlighted this oversight. For example, the presence of a healthy contralateral kidney in unilateral IRI reduces single-nephron glomerular filtration rate (GFR), limiting the clearance of tubular debris and exacerbating tubular cast formation.25),26) Polichnowski et al. demonstrated that in unilateral IRI, the contralateral kidney mitigates hypoxia and reduces the expression of HIF-1α, vascular endothelial growth factor (VEGF), and phosphatase and tensin homolog (PTEN).7) Conversely, contralateral nephrectomy increases GFR relative to RBF, leading to hypoxia and upregulating these factors, facilitating capillary and tubule repair. Despite these findings, only two studies have directly compared bilateral and unilateral kidney injuries, and the underlying mechanisms remain poorly understood.7),27)
In contrast to previous tubular injury models, our study employed a glomerulopathy-focused approach using NEP25 mice to induce unilateral kidney injury. This shift from tubular interstitial injury to glomerular pathology allowed us to demonstrate renal counterbalance phenomena in a nephropathic setting. To our knowledge, this is the first study to elucidate glomerular lesion patterns under renal counterbalance, revealing distinct mechanisms compared to conventional models.
RNA-seq analysis revealed multiple differentially expressed genes, including Kirrel2 and Tagln. However, we focused our mechanistic investigation on the RAS for several reasons. First, RAS directly regulates RBF, which is a key physiological variable in our model. Second, unlike RAS components, Kirrel2 and Tagln cannot currently be modulated pharmacologically in vivo, and generating double transgenic NEP25 mice with gene knockouts would be technically challenging. Third, the clear therapeutic effect observed with ACEI treatment strongly supports the biological and translational relevance of the RAS pathway. This rationale supports our emphasis on RAS dysregulation in renal counterbalance. We selected captopril, an ACEI, rather than an angiotensin receptor blocker (ARB), based on both pharmacodynamic rationale and experimental considerations. ACEIs act upstream in the RAS cascade and are considered to suppress overall Ang II production more comprehensively. Importantly, ACEIs have been shown to reduce intrarenal Ang II levels more effectively than ARBs.28) Moreover, prior studies in NEP25 mice demonstrated that ARB treatment induces a more pronounced systemic hypotensive effect.29) Because systemic blood pressure can significantly influence renal perfusion, we selected captopril to minimize the confounding impact of marked hypotension on glomerular hemodynamics.
Our findings align with previous reports. Guan et al. observed elevated renal Ang II levels in non-clipped kidneys relative to clipped kidneys in a two-kidney, one-clip (2K1C) model,30) while Allred et al. reported increased renal Ang II levels in ischemic kidneys compared to contralateral healthy kidneys in unilateral IRI models.31) Similarly, in our two-kidney, one-nephropathy (2K1N) model, we identified renal Ang II imbalances between nephropathic and healthy kidneys. Notably, ACEI treatment ameliorated RBF deficits and glomerular lesions, suggesting renoprotective effects beyond conventional mechanisms, potentially by correcting renal Ang II imbalances.
This study has several limitations. First, we did not measure circulating Ang II levels. It is well established that Ang II concentrations are substantially higher within renal tissue than in plasma, where locally produced Ang II exerts significant autocrine and paracrine effects on sodium reabsorption, oxidative stress, and tissue injury.21) To accurately quantify intrarenal Ang II without artifactual degradation, we prioritized immediate tissue harvesting and freezing post-mortem, which precluded blood sampling. Although we expect that circulating Ang II levels would be comparable between transplanted and native kidneys, future studies should aim to quantify both systemic and renal Ang II levels to more comprehensively characterize renin–angiotensin system dynamics.
Second, in the ACEI-treated group, we were unable to obtain sufficient tissue for reliable quantification of Ren1 expression and intrarenal Ang II levels due to the limited number of mice and our prioritization of histological and perfusion analyses.
Nevertheless, it is well recognized that ACE inhibition generally enhances renin production while reducing renal Ang II levels. In our previous study using NEP25 mice, massive proteinuria led to elevated renal Ang II levels due to filtered angiotensinogen uptake, even in the presence of suppressed renin expression.15) Furthermore, in an earlier model combining podocyte injury and ureteral obstruction, reduced glomerular filtration significantly decreased renal Ang II levels, supporting the notion that filtered angiotensinogen is a major contributor to local Ang II production.32) These observations suggest that ACE inhibition may confer renoprotection by reducing glomerular pressure and angiotensinogen leakage, thereby lowering intrarenal Ang II levels, even without direct assessment of tissue Ang II content in the present study.
Third, kidney weights were not recorded due to rapid tissue processing; instead, kidney volume was used as a proxy. Future investigations should incorporate more precise assessments of kidney hypertrophy and atrophy.
Our findings call into question the conventional reliance on unilateral kidney injury models, such as unilateral IRI and UUO, for studying the transition from AKI to CKD. These models emphasize tubular interstitial injury, whereas our data suggest that reduced RBF and glomerular lesions are primary drivers of disease progression under renal counterbalance. Although unilateral models remain valuable for specific conditions such as unilateral renal artery stenosis or tumor-induced UUO, their broader application in CKD research warrants caution due to fundamental differences in the pathophysiology of unilateral and bilateral kidney injuries.
In conclusion, this study elucidates the mechanisms underlying renal counterbalance, particularly the role of renal Ang II imbalances in exacerbating unilateral kidney injury. By employing a glomerulopathy-focused model, we demonstrated that RBF decline, and glomerular lesions are central to injury progression under renal counterbalance. Importantly, our findings suggest that therapeutic correction of renal Ang II imbalance may represent a promising strategy for asymmetric renal diseases.
Acknowledgements
The authors would like to thank Professor Flaminia Miyamasu, Medical English Communications Center, University of Tsukuba, and Editage (www.editage.jp) for the English language review, and Abe Fumie, for her technical support. This work was supported by JSPS KAKENHI Grant Number JP25K19492 (to K.S.) a JST START University Promotion Type, Grant Number JPMJST2052 (to K.K.), JSPS KAKENHI Grant Number JP17K09685 (to N.M.), AMED-CREST Grant Number JP21gm1410010 (to J.-D.K. and A.F.), and the Cooperative Research Project Program of Life Science Center for Survival Dynamics, Tsukuba Advanced Research Alliance (TARA).
Author contributions
KK, and MN conceptualized this work. Methodology belongs to KS, KK, and J-DK. Execution of experiments was conducted by KS, KK, J-DK, TM, MK, ST, and SM. Data analyses were done by KS, KK, and J-DK. KS, KK, and J-DK wrote the original draft and KS, KK, J-DK, TM, and AF reviewed and edited the draft. All the authors have approved this work for publication.
Conflict of interest
The authors declare that they have no financial relationships or employment affiliations with any organizations or entities that could be perceived as a potential conflict of interest during the past three years.
Notes
Edited by Tadao KAKIZOE, M.J.A.
Correspondence should be addressed to: K. Kawanishi and M. Nagata, Institute of Medicine, University of Tsukuba, 1-1-1 Tennodai, Tsukuba, Ibaraki 305-8577, Japan (e-mail: kukawanishi@md.tsukuba.ac.jp (K.K.) and nagatam@md.tsukuba.ac.jp (M.N.)).
Footnotes
Current address (K.S.): Division of Nephrology and Kidney Center, Kobe University Graduate School of Medicine, Kobe, Hyogo, Japan.
K.S. and K.K. contributed equally to this work.
References
- 1) Bikbov, B., Purcell, C., Levey, A.S., Smith, M., Abdoli, A., Abebe, M. et al. (2020) Global, regional, and national burden of chronic kidney disease, 1990–2017: a systematic analysis for the Global Burden of Disease Study 2017. Lancet 395, 709–733.
- 2) Kellum, J.A., Romagnani, P., Ashuntantang, G., Ronco, C., Zarbock, A. and Anders, H.J. (2021) Acute kidney injury. Nat. Rev. Dis. Primers 7, 52.
- 3) He, L., Wei, Q., Liu, J., Yi, M., Liu, Y., Liu, H. et al. (2017) AKI on CKD: heightened injury, suppressed repair, and the underlying mechanisms. Kidney Int. 92, 1071–1083.
- 4) Habshi, T., Shelke, V., Kale, A., Lech, M. and Gaikwad, A.B. (2023) Hippo signaling in acute kidney injury to chronic kidney disease transition: Current understandings and future targets. Drug Discov. Today 28, 103649.
- 5) Fu, Y., Tang, C., Cai, J., Chen, G., Zhang, D. and Dong, Z. (2018) Rodent models of AKI-CKD transition. Am. J. Physiol. Renal Physiol. 315, 1098–1106.
- 6) Zager, R.A., Johnson, A.C.M. and Lund, S. (2009) Uremia impacts renal inflammatory cytokine gene expression in the setting of experimental acute kidney injury. Am. J. Physiol. Renal Physiol. 297, F961–F970.
- 7) Polichnowski, A.J., Griffin, K.A., Licea-Vargas, H., Lan, R., Picken, M.M., Long, J. et al. (2020) Pathophysiology of unilateral ischemia-reperfusion injury: importance of renal counterbalance and implications for the AKI-CKD transition. Am. J. Physiol. Renal Physiol. 318, F1086–F1099.
- 8) Hinman, F. (1923) Renal counterbalance: An experimental and clinical study with reference to the significance of disuse atrophy. J. Urol. 9, 289–314.
- 9) Hinman, F. (1926) Renal counterbalance. Cal. West. Med. 24, 333–335.
- 10) Matsusaka, T., Xin, J., Niwa, S., Kobayashi, K., Akatsuka, A., Hashizume, H. et al. (2005) Genetic engineering of glomerular sclerosis in the mouse via control of onset and severity of podocyte-specific injury. J. Am. Soc. Nephrol. 16, 1013–1023.
- 11) Rong, S., Lewis, A.G., Kunter, U., Haller, H. and Gueler, F. (2012) A knotless technique for kidney transplantation in the mouse. J. Transplant. 2012, 127215.
- 12) Tian, Y., Chen, J., Gaspert, A., Segerer, S., Clavien, P.A., Wüthrich, R.P. et al. (2010) Kidney transplantation in mice using left and right kidney grafts. J. Surg. Res. 163, E91–E97.
- 13) Matsusaka, T., Niimura, F., Pastan, I., Shintani, A., Nishiyama, A. and Ichikawa, I. (2014) Podocyte injury enhances filtration of liver-derived angiotensinogen and renal angiotensin II generation. Kidney Int. 85, 1068–1077.
- 14) Ohkuro, M., Kim, J.D., Kuboi, Y., Hayashi, Y., Mizukami, H., Kobayashi-Kuramochi, H. et al. (2018) Calreticulin and integrin alpha dissociation induces anti-inflammatory programming in animal models of inflammatory bowel disease. Nat. Commun. 9, 1982.
- 15) Matsusaka, T., Niimura, F., Shimizu, A., Pastan, I., Saito, A., Kobori, H. et al. (2012) Liver angiotensinogen is the primary source of renal angiotensin II. J. Am. Soc. Nephrol. 23, 1181–1189.
- 16) Koizumi, M., Ueda, K., Niimura, F., Nishiyama, A., Yanagita, M., Saito, A. et al. (2019) Podocyte injury augments intrarenal angiotensin II generation and sodium retention in a megalin-dependent manner. Hypertension 74, 509–517.
- 17) Ihalmo, P., Schmid, H., Rastaldi, M.P., Mattinzoli, D., Langham, R.G., Luimula, P. et al. (2007) Expression of filtrin in human glomerular diseases. Nephrol. Dial. Transplant. 22, 1903–1909.
- 18) Je, H.D. and Sohn, U.D. (2007) SM22α is required for agonist-induced regulation of contractility: evidence from sm22α knockout mice. Mol. Cells 23, 175–181.
- 19) Xie, X.L., Nie, X., Wu, J., Zhang, F., Zhao, L.L., Lin, Y.L. et al. (2015) Smooth muscle 22α facilitates angiotensin II-induced signaling and vascular contraction. J. Mol. Med. 93, 547–558.
- 20) Holmer, S., Rinne, B., Eckardt, K.U., Le Hir, M., Schricker, K., Kaissling, B. et al. (1994) Role of renal nerves for the expression of renin in adult rat kidney. Am. J. Physiol. 266, F738–F745.
- 21) Kobori, H., Nangaku, M., Navar, L.G. and Nishiyama, A. (2007) The intrarenal renin-angiotensin system: From physiology to the pathobiology of hypertension and kidney disease. Pharmacol. Rev. 59, 251–287.
- 22) Koletsky, S. (1954) Effects of temporary interruption of renal circulation in rats. AMA Arch. Pathol. 58, 592–603.
- 23) Yang, H.C., Zuo, Y. and Fogo, A.B. (2010) Models of chronic kidney disease. Drug Discov. Today Dis. Models 7, 13–19.
- 24) Liang, J. and Liu, Y. (2023) Animal models of kidney disease: challenges and perspectives. Kidney 360, 1479–1493.
- 25) Finn, W.F. (1980) Enhanced recovery from postischemic acute renal failure. Micropuncture studies in the rat. Circ. Res. 46, 440–448.
- 26) Finn, W.F. and Chevalier, R.L. (1979) Recovery from postischemic acute renal failure in the rat. Kidney Int. 16, 113–123.
- 27) Lee, K., Jang, H.R., Jeon, J., Yang, K.E., Lee, J.E., Kwon, G.Y. et al. (2022) Repair phase modeling of ischemic acute kidney injury: recovery vs. transition to chronic kidney disease. Am. J. Transl. Res. 14, 554–571.
- 28) Lin, H., Geurts, F., Hassler, L., Batlle, D., Mirabito Colafella, K.M., Denton, K.M. et al. (2022) Kidney angiotensin in cardiovascular disease: formation and drug targeting. Pharmacol. Rev. 74, 462–505.
- 29) Matsusaka, T., Asano, T., Niimura, F., Kinomura, M., Shimizu, A., Shintani, A. et al. (2010) Angiotensin receptor blocker protection against podocyte-induced sclerosis is podocyte angiotensin II type 1 receptor-independent. Hypertension 55, 967–973.
- 30) Guan, S., Fox, J., Mitchell, K.D. and Navar, L.G. (1992) Angiotensin and angiotensin converting enzyme tissue levels in two-kidney, one clip hypertensive rats. Hypertension 20, 763–767.
- 31) Allred, A.J., Chappell, M.C., Ferrario, C.M. and Diz, D.I. (2000) Differential actions of renal ischemic injury on the intrarenal angiotensin system. Am. J. Physiol. Renal Physiol. 279, F636–F645.
- 32) Okabe, M., Miyazaki, Y., Niimura, F., Pastan, I., Nishiyama, A., Yokoo, T. et al. (2015) Unilateral ureteral obstruction attenuates intrarenal angiotensin II generation induced by podocyte injury. Am. J. Physiol. Renal Physiol. 308, F932–F937.
Non-standard abbreviation list
2K1Ntwo-kidney, one-nephropathic
2K2Ntwo-kidney, two-nephropathic
ACEIangiotensin-converting enzyme inhibitor
AKIacute kidney injury
Ang IIangiotensin II
angiotensin receptor blockerARB
CKDchronic kidney disease
FDRfalse discovery rate
FSGSfocal segmental glomerulosclerosis
HIFhypoxia inducible factor
IRIischemia-reperfusion injury
MCPmonocyte chemotactic protein
PASperiodic acid-Schiff
PAMSperiodic acid-methenamine silver
PCAprincipal component analysis
PTENphosphatase and tensin homolog
RBFrenal blood flow
RPKMreads per kilobase per million
TEMtransmission electron microscopy
TGFtransforming growth factor
TNFtumor necrosis factor
UUOunilateral ureteral obstruction
VEGFvascular endothelial growth factor
WTwild-type


