Abstract
Tetrodotoxin (TTX), the pufferfish toxin, has the potential to cause fatal food poisoning because of its potent voltage-gated sodium channel (Nav) blocking activity. 4-epiTTX, 11-norTTX-6(S)-ol, and 11-oxoTTX are the major TTX analogues found in marine animals; thus, their chemical properties and biological activities should be determined. In this study, these three TTX analogues were purified to a high level (purity >97%) from pufferfish and newts. The ratios of the hemilactal to the 10,7-lactone forms were determined using 1H NMR, and 13C NMR data were also obtained. 4-epiTTX underwent considerable transformation to TTX in physiological conditions. The Nav blocking activity of these analogues was evaluated by whole-cell patch-clamp recording using a human Nav1.2, colorimetric cell-based assay and mouse bioassay. The toxicity equivalency factors (TEFs setting TTX 1) of the three analogues were estimated; 4-epiTTX (0.06), 11-norTTX-6(S)-ol (0.02), and 11-oxoTTX (1.2) using patch-clamp recording, and 11-norTTX-6(S)-ol (0.50) and 11-oxoTTX (0.42) using the mouse bioassay. These data confirmed the low Nav blocking activity of 4-epiTTX and high activity of 11-oxoTTX.
1. Introduction
Tetrodotoxin (TTX, 1),1),2) known as pufferfish toxin, has the potential to cause fatal food poisoning, due to its potent and specific voltage-gated sodium channel (Nav) blocking activity. However, eating pufferfish as a delicacy as part of traditional culture in Japan and other Asian countries. The chemistry of TTX has been studied extensively in Japan. Tahara3) partially purified TTX from pufferfish ovary in 1909, and Yokoo et al.4) first crystallized TTX in 1950. Tsuda et al.,5) Goto et al.,6) and Woodword7) first reported the structure of TTX in 1964. Several groups have succeeded in the total synthesis of TTX.8)–16)
TTX has been identified in many marine animals other than pufferfish, including crabs, octopuses, flatworms, snails, ribbon worms, and others,17)–19) as well as in terrestrial animals, such as newts20)–23) and frogs.24),25) Recently, TTX was detected in bivalves from Europe, New Zealand, China, and Japan.26)–28) In response to this, the European Food Safety Authority (EFSA) established the regulatory concentration of TTX in shellfish meat as 44 µg TTX equivalents/kg.29) TTX-producing bacteria have been reported in marine30),31) and terrestrial32) environments. However, the genes responsible for the biosynthesis of TTX have not yet been identified. In such situation, our current approach for achieving TTX-biosynthesis is through the isolation and structural determination of natural TTX analogues and related compounds from pufferfish,33)–42) newts,43)–48) and frogs.49) By comparing the structures of the obtained natural TTX-related compounds, the authors proposed different biosynthetic pathways for TTX biosynthesis in marine (stepwise oxidation pathway)41) and terrestrial (monoterpene pathway)44),45) environments.
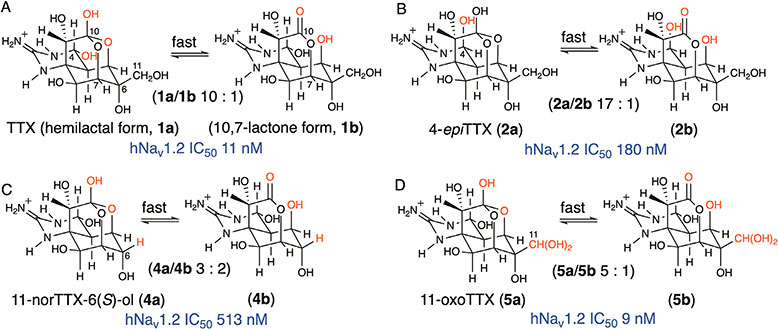
Understanding the chemical properties of TTX analogues is necessary for their analysis and for the study of their structure-activity relationship (SAR). TTX generally exists as a mixture of the slow equilibrium analogues 4-epiTTX (2) and 4,9-anhydroTTX (3) (Fig. 1A).5)–7) Besides these, natural analogues, such as 11-norTTX-6(S)-ol (4),34) 11-oxoTTX (5),50) 11-deoxyTTX (6), 6-deoxyTTX (7), 4,4a-anhydroTTX (8), 9-epiTTX (9), 5-deoxyTTX, 5,11-dideoxyTTX, 6,11-dideoxyTTX (10), and 5,6,11-trideoxyTTX have been identified from marine animals.33)–42) Furthermore, 11-oxoTTX (5), which can cause food poisoning, was detected at high concentration in the pufferfish genus Arothron and the snail Nassarius glans nipponensis.39),51) 6-epiTTX (11), 11-deoxyTTX (6),21) and 11-oxoTTX (5)52) have been isolated from newts. TTX and its analogues (Fig. 1) are usually detected as a fast exchangeable equilibrium tautomers with hemilactal and 10,7-lactone forms by NMR, except for 9-epiTTX (9), which was identified as a mixture of the hemilactal (9a) and 10,8-lactone (9b) forms.42) The hemilactal form, which contains 10-OH, was suggested to be the biologically active form based on previous SAR studies of TTX analogues.37),53),54)

The Nav blocking activity and SAR of TTX analogues have been studied by electrophysiological methods,55)–57) cell-based assays (CBAs),58)–60) binding assays,53) and mouse bioassays.17),37),49),61) Examination of the competitive binding of ten TTX analogues to a rat brain membrane with [3H-saxitoxin] suggested the contribution of all six hydroxyl groups in TTX to its activity.53) Furthermore, the binding of eleven TTX analogues to human Nav subtypes Nav1.1–Nav1.7 was evaluated using whole-cell patch-clamp recordings.54) However, 4-epiTTX (2), 11-norTTX-6(S)-ol (4), and 11-oxoTTX (5) were not examined using this method.
In this study, firstly, 4-epiTTX (2), 11-norTTX-6(S)-ol (4), and 11-oxoTTX (5) were purified to the high level from pufferfish and newts. 11-norTTX-6(S)-ol (4) was also chemically derived from TTX. The purity and quantity of these analogues were determined using 1H NMR and liquid chromatography-mass spectrometry (LCMS). The ratios of the hemilactal form to the 10,7-lactone form (H/L) of 4-epiTTX (2) and 11-oxoTTX (5) were determined to identify the structural factors influencing the H/L ratio. Additionally, 13C NMR data for these three analogues were collected. Secondly, the stability of 4-epiTTX (2) in physiological conditions was examined to select an appropriate assay method for evaluating the biological activity of this unstable analogue. Thirdly, the Nav blocking activity of these three analogues was evaluated using whole-cell patch-clamp recordings on human Nav1.2 expressed in HEK293T cells. The activity of 11-norTTX-6(S)-ol (4) and 11-oxoTTX (5) was also evaluated using a colorimetric CBA60) and mouse bioassay. Finally, the toxicity equivalency factor (TEF) of the three analogues was estimated and compared with previously reported data.
2. Results and discussion
2.1. Purification, preparation, and quantitation of 4-epiTTX (2), 11-norTTX-6(S)-ol (4), and 11-oxoTTX (5).
4-epiTTX (2) (72 µg, 97% LCMS based purity, Fig. S24) was purified from the ovary of the pufferfish Takifugu flavipterus and the body of the newt Cynops ensicauda popei. 11-norTTX-6(S)-ol (4) (48 µg, 98% LCMS based purify, Fig. S25) was purified from the ovary of the pufferfish T. flavipterus, and 11-norTTX-6(S)-ol (4) (72 µg, 98% LCMS based purify) was chemically derived from TTX (1 mg) using the previously reported method.53) 11-oxoTTX (5) (82 µg, 99% purify by LCMS, Fig. S26) was purified from the skin of the pufferfish Arothron manilensis (36 g). The purity of these compounds was also confirmed using NMR spectra (Figs. 2-1, 2-2, 2-3). These three analogues were quantified using 1H NMR spectroscopy with TTX as a standard, in accordance with the quantitative nuclear magnetic resonance (qNMR) method for TTX62) reported previously.
2.2. Newly obtained NMR data of 4-epiTTX (2), 11-norTTX-6(S)-ol (4), and 11-oxoTTX (5).
Purified 4-epiTTX (2), 11-norTTX-6(S)-ol (4), and 11-oxoTTX (5) were analyzed using 1H NMR, COSY, TOCSY, NOESY1D, HSQC, and HMBC spectra (Figs. 2-1, 2-2, 2-3, and Supplementary materials). The 10,7-lactone forms of 4-epiTTX (2b) and 11-oxoTTX (5b) were first identified using NMR spectroscopy. 1H NMR signals corresponding to the 10,7-lactone forms of these compounds (2b and 5b) were assigned based on the NOESY1D spectra (Supplementary materials Figs. S2–S8, S18–S21), where the signals of the 10,7-lactone forms (2b and 5b) by irradiating the corresponding signals of the hemilactal forms (2a and 5a) were detected as a result of population transfer.21) Therefore, the time for conversion can be estimated as less than 500 ms, which was set as the mixing time for NOESY1D measurement. In addition, 13C NMR signals of the hemilactal and 10,7-lactone forms of these three TTX analogues (2a,b, 4a,b, and 5a,b) were assigned based on the HSQC (Figs. 2-1, 2-2, and 2-3) and HMBC (Supplementary materials Figs. S11, S13–S14, and S22) correlations, although some quaternary 13C signals remained unassigned. The HSQC spectrum of the hemilactal form of 4-epiTTX coexisting with TTX has been partially reported previously.62) The data obtained in this study are in agreement with these data. The 13C and 1H NMR data for 2a,b, 4a,b, and 5a,b are summarized in Tables 1-1, 1-2, 1-3. The NMR data obtained in this study are expected to be used for future structural determination of new TTX analogues from natural and synthetic sources.
Table 1-1. NMR data of 4-
epiTTX (
2)
| position |
hemilactal (2a) |
mul. J (Hz) |
10,7-lactone (2b) |
mul. J (Hz) |
| 13C |
1H |
13C |
1H |
| 2 |
155.4 |
|
|
N.D. |
|
|
| 4 |
74.4 |
5.15 |
d 5.0 |
75.0 |
5.22 |
br d |
| 4a |
35.5 |
2.86 |
d 5.0 |
35.5 |
2.86 |
br d |
| 5 |
75.1 |
4.31 |
d 1.7 |
72.8 |
4.17 |
d 2.2 |
| 6 |
74.7 |
|
|
N.D. |
|
|
| 7 |
79.2 |
4.08 |
t 1.7 |
82.5 |
4.55 |
br s |
| 8 |
74.1 |
4.28 |
d 1.7 |
72.4 |
4.46 |
br s |
| 8a |
57.9 |
|
|
N.D. |
|
|
| 9 |
69.9 |
3.98 |
s |
73.5 |
4.61 |
s |
| 10 |
110.0 |
|
|
N.D. |
|
|
| 11 |
65.2 |
4.03 |
s |
65.2 |
4.03 |
s |
Table 1-2. NMR data of 11-norTTX-6(
S)-ol (
4)
| position |
hemilactal (4a) |
mul. J (Hz) |
10,7-lactone (4b) |
mul. J (Hz) |
| 13C |
1H |
13C |
1H |
| 2 |
156.4 |
|
|
N.D. |
|
|
| 4 |
74.1 |
5.50 |
d 9.4 |
74.1 |
5.52 |
d 9.4 |
| 4a |
40.0 |
2.18 |
d 9.4 |
45.7 |
2.24 |
dd 9.4, 2.2 |
| 5 |
73.1 |
4.36 |
br s |
68.4 |
4.16 |
br s |
| 6 |
66.0 |
4.37 |
br s |
71.4 |
4.27 |
t 3.2 |
| 7 |
79.1 |
4.20 |
br s |
82.3 |
4.64 |
br t |
| 8 |
71.9 |
4.17 |
br s |
70.4 |
4.32 |
d 2.0 |
| 8a |
59.2 |
|
|
59.4 |
|
|
| 9 |
70.8 |
3.98 |
s |
73.4 |
4.58 |
s |
| 10 |
110.0 |
|
|
175.4 |
|
|
Table 1-3. NMR data of 11-oxoTTX (
5)
| position |
hemilactal (5a) |
mul. J (Hz) |
10,7-lactone (5b) |
mul. J (Hz) |
| 13C |
1H |
13C |
1H |
| 2 |
156.0 |
|
|
N.D. |
|
|
| 4 |
74.7 |
5.50 |
d 9.5 |
74.7 |
5.50 |
d 9.5 |
| 4a |
40.7 |
2.31 |
d 9.5 |
46.3 |
2.31 |
d 9.5 |
| 5 |
73.6 |
4.37 |
br s |
68.4 |
4.16 |
br s |
| 6 |
72.6 |
|
|
N.D. |
|
|
| 7 |
79.7 |
4.19 |
br s |
83.1 |
4.63 |
br s |
| 8 |
72.7 |
4.27 |
br s |
71.7 |
4.42 |
br s |
| 8a |
59.2 |
|
|
N.D. |
|
|
| 9 |
70.6 |
3.98 |
s |
73.8 |
4.58 |
s |
| 10 |
110.4 |
|
|
N.D. |
|
|
| 11 |
89.5 |
5.74 |
s |
89.5 |
5.74 |
s |
N.D. denotes not determined. 600 MHz, 20 °C, CD3COOD-D2O (4:96, v/v), CHD2COOD was set at 2.06 ppm for 1H NMR, 13CD3COOD was set at 22.4 ppm for 13C NMR.
The H/L of 4-epiTTX (2a/2b) (H/L 17) and 11-oxoTTX (5a/5b) (H/L 5.0) was determined by integration of the 1H NMR signals acquired in CD3COOD-D2O (4:96, v/v) at 20 °C in this study, and that of 11-norTTX-6(S)-ol (4a/4b) (H/L 1.5) was confirmed, which was in agreement with a previous report.34) The H/L values are summarized in Table 2, along with previously reported data for TTX, 11-deoxyTTX (6), 6-epiTTX (11),21) 6-deoxyTTX (7),39) 4,4a-anhydroTTX (8)40) and 6,11-dideoxyTTX (10)37) (structures are shown in Fig. 1). The hemilactal form is usually the major form of TTX analogues, except for 4,4a-anhydroTTX (8) (H/L 0.7). Among these analogues, the H/L value was largest for 4-epiTTX (H/L 17), whereas the H/L value of 4,4a-anhydroTTX (8) was the smallest (H/L 0.7). Because the H/L values of TTX (1a/1b) (H/L 10) and 4-epiTTX (2a/2b) (H/L 17) were considerably larger than those of the other analogues, the equatorial substitution at C-6 of TTX and 4-epiTTX (CH2OH) was predicted to stabilize the hemilactal forms. In contrast, 4,4a-anhydroTTX (8) (H/L 0.7) favors the 10,7-lactone form over the hemilactal form, in which the C4-C4a double bond causes steric constraints in the hemilactal structure. As reported previously, 9-epiTTX (9, Fig. 1) forms the 10,8-lactone (9b) instead of 10,7-lactone, which can be explained by the higher Boltzmann average energy of 10,7-lactone compared with that of 10,8-lactone for 9-epiTTX (9).42) The ratio of hemilactal (9a) to 10,8-lactone in 9-epiTTX (9b) was 0.7:1.0 (mol/mol) based on 1H NMR analysis. As described in the introduction section, the hemilactal form has been suggested to be the biologically active form based on previous SAR studies.37),53),54)
Table 2. The ratio of the hemilactal form to the 10,7-lactone form (H/L) of TTX and its analogues (CD
3COOD-D
2O (4:96, v/v), 20 °C)
| |
Compound
no. |
H/L |
| TTX |
1 |
10 |
| 4-epiTTX |
2 |
17 |
| 11-norTTX-6(S)-ol |
4 |
1.5 |
| 11-oxoTTX |
5 |
5.0 |
| 11-deoxyTTX |
6 |
2.3 |
| 6-deoxyTTX |
7 |
3.0 |
| 4,4a-anhydroTTX |
8 |
0.7 |
| 6,11-dideoxyTTX |
10 |
2.0 |
| 6-epiTTX |
11 |
1.5 |
The stability of 4-epiTTX (2) was examined to determine the appropriate method for evaluating the Nav blocking activity of this analogue. Purified 4-epiTTX (2) (Fig. 3A) was incubated in phosphate-buffered saline (PBS(−) without Ca2+, Mg2+, pH 7.4) for 24 h at 37 °C. The chromatogram acquired by liquid chromatography-fluorescence detection (LC-FLD) analysis for TTXs63),64) after incubation showed that 46% of 4-epiTTX (2) was converted to TTX, but not to 4,9-anhydroTTX (3), and 28% of 4-epiTTX (2) remained (Fig. 3B). The peak at around 10 min can be assigned as tetrodonic acid or tetrodotoxinic acid5),6) which were both previously reported as degradation compounds of TTX. This result suggested that CBAs are not suitable for evaluating the Nav blocking activity of 4-epiTTX (2), because the test compound should be incubated in cell-culture medium for longer than 24 h at 37 °C in a CBA. Therefore, the biological activity of 4-epiTTX (2) should be evaluated using an electrophysiological methods that require only approximately 1 hour at room temperature to determine the activity.

Two mechanisms are possible to explain for conversion between TTX and 4-epiTTX. One is an imine formation between N3 and C4 as an intermediate by dehydration of N3-H and C4-OH (Fig. S27a). As another possibility, the single bond of the hemiaminal between N3 and C4 in TTX and 4-epiTTX is hydrated to form a linear amino group of the guanidinium group and C4-aldehyde as an intermediate (Fig. S27b), and then, these amino group and aldehyde form an hemiaminal again to produce both TTX and 4-epiTTX.
2.5. Nav inhibitory activity of TTX (1), 4-epiTTX (2), 11-norTTX-6(S)-ol (4), and 11-oxoTTX (5) based on whole-cell patch-clamp recordings.
The Nav inhibitory activities of TTX (1), 4-epiTTX (2), 11-norTTX-6(S)-ol (4), and 11-oxoTTX (5) were evaluated using whole-cell patch-clamp recordings of human Nav1.2 transiently expressed in HEK293T cells (Fig. 4). The peak sodium current was inhibited in a dose-dependent manner in the presence of TTX (1) with an IC50 value of 11 ± 3 nM (n = 3). Subsequently, the inhibitory effects of 4-epiTTX (2), 11-norTTX-6(S)-ol (4), and 11-oxoTTX (5) on Nav1.2 were evaluated. The IC50 values of 2, 4 and 5 were 180 ± 59, 513 ± 86, and 9 ± 3 nM, respectively (n = 3).

Evaluation of the Nav blocking activity of 4-epiTTX (2) by an electrophysiological method using a squid axon was previously reported by Kao and Yasumoto,65) suggesting that the activity of 4-epiTTX (2) was one seventh of that of TTX. In this study, the ratio was one eighteenth, which is relatively weak compared with previous results. This may be because of the high purity of 4-epiTTX (2) used in this study. Wu et al.66) evaluated the activity of 11-oxoTTX (5) based on the vaseline-gap voltage-clamp set-up technique using a single frog sartorius muscle fiber (ED50 0.7 nM versus 4.1 and 3.3 nM for TTX), suggesting more than five times higher activity of 11-oxoTTX (5) than that of TTX. In this study, the activity of 11-oxoTTX (5) was almost same as that of TTX. A comparison of the results with those of other related experiments is discussed in section 2.8.
2.6. Nav inhibitory activity of TTX (1), 11-norTTX-6(S)-ol (4), and 11-oxoTTX (5) using a CBA.
The Nav inhibitory activity of TTX (1), 11-norTTX-6(S)-ol (4), and 11-oxoTTX (5) in the Neuro-2a cell line was also evaluated using a CBA.60) In this assay, the Nav inhibitory activity of TTXs was measured based on the ability to protect cells in the presence of ouabain and veratridine (Fig. 5). The cell viability data (P) were transformed into a Hill plot of log P/(100 − P) vs. log TTX analogue concentration to obtain the 50% effective concentration (EC50) values. The EC50 values of 2, 4, and 5 were 8.4 ± 3.2, 178 ± 22, and 2.8 ± 1.2 nM (n = 3), respectively.
2.7. Toxicity of 11-norTTX-6(S)-ol (4) and 11-oxoTTX (5) in mice.
The toxicity of TTX (1), 11-norTTX-6(S)-ol (4), and 11-oxoTTX (5) in mice by intraperitoneal (i.p.) injection was estimated using ddY strain male mice according to the standard analytical methods in the food safety regulation for pufferfish toxin in Japan.67) Because of the limited amount of TTX analogues and mice used, the minimum amount of the test compound required to kill 15–20 g mice within 30 min (LD99) was estimated using 2–4 mice for each compound; the results are summarized in Table 3. The mouse unit (MU) was calculated based on the lethal time and body weight according to the specific relationship tables for TTX shown in the official manual.67) One MU is defined as the amount of toxin required to kill a mouse with the body weight of 20 g at 30 min. Based on this, the LD99 value (µg/kg) was calculated as [minimum dose to kill a mouse (µg) × 50/MU]. According to the data shown in Table 3, the average values of LD99 for TTX (1), 11-norTTX-6(S)-ol (4), and 11-oxoTTX (5) were 10 (n = 2), 24 ± 4 (n = 3), and 20 µg/kg (n = 2), respectively. We acknowledge the limitation that these LD99 values were estimated using only 2 or 3 mice for each compound. However, the LD99 value for TTX obtained in study (10 µg/kg) almost agreed with that in recently reported data that the 1 MU weight was determined as 0.17 µg (8.5 µg/kg).67),68)
Table 3. Results of mouse bioassays with TTX (
1), 11-norTTX-6(
S)-ol (
4), and 11-oxoTTX (
5)
| compound |
dose (µg) |
body
weight (g) |
lethal time
(min) |
MU |
LD99 (µg/kg) |
| TTX (1) |
0.20 |
15.0 |
18.6 |
0.89 |
11 |
| TTX (1) |
0.25 |
17.2 |
9.52 |
1.48 |
8 |
| |
| 11-norTTX-6(S)-ol (4) |
1.5 |
15.8 |
5.29 |
2.6 |
29 |
| 11-norTTX-6(S)-ol (4) |
1.5 |
17.7 |
5.08 |
3.2 |
23 |
| 11-norTTX-6(S)-ol (4) |
1.0 |
17.4 |
not died |
|
|
| 11-norTTX-6(S)-ol (4) |
2.0 |
17.2 |
3.56 |
4.8 |
21 |
| |
| 11-oxoTTX (5) |
0.40 |
16.3 |
19.2 |
0.97 |
21 |
| 11-oxoTTX (5) |
0.40 |
17.4 |
19 |
1.03 |
19 |
| 11-oxoTTX (5) |
0.20 |
15.3 |
not died |
|
|
| 11-oxoTTX (5) |
0.20 |
16.6 |
not died |
|
|
The biological activities of TTX (1), 4-epiTTX (2), 11-norTTX-6(S)-ol (4), and 11-oxoTTX (5) were evaluated using whole-cell patch-clamp recordings (human Nav1.2), CBA (Neuro-2a), and mouse bioassays. These data are summarized in Table 4a, along with a comparison of the corresponding TEFs with that of TTX. The results are also compared with previously reported related data (Table 4b).
Table 4. Comparison of biological activity and TEFs of TTXs
| a) Activity (IC50, EC50, LD99, Ko) |
| |
This study |
|
Reported data |
| Toxins |
Patch clamp
(hNav1.2) |
CBA |
Mouse
Bioassay |
|
Autopatch
(Neuro-2a)
Reverte
et al.69) |
CBA
Alkassar
et al.70) |
CBA
Saruhashi
et al.40) |
Mouse
Bioassay |
Binding
Assay53) |
IC50 nM
(mean) |
EC50 nM
(mean) |
LD99 (µg/kg) |
|
IC50 nM |
IC50 ng/mL
(mean) |
EC50 nM
(mean) |
LD99
(µg/kg) |
mouse brain
Ko nM
(mean) |
| TTX (1) |
11 |
8.4 |
10 |
|
5.4 |
1.7 |
4.7 |
1068) |
1.8 |
| 4-epiTTX (2) |
180 |
NT |
NT |
|
NT |
NT |
NT |
7061) |
68 |
| 11-norTTX-6(S)-ol (4) |
513 |
178 |
20 |
|
23 |
4.1 |
NT |
5434) |
23 |
| 11-oxoTTX (5) |
9 |
2.8 |
24 |
|
NT |
NT |
2.9 |
1652) |
1.5 |
| |
| b) Toxicity equivalency factors (TEFs) |
| |
This study |
|
Reported data |
| Toxins |
Patch clamp
(hNav1.2) |
CBA |
Mouse
Bioassay |
|
Autopatch
(Neuro-2a)
Reverte
et al.69) |
CBA
Alkassar
et al.70) |
CBA
Saruhashi
et al.40) |
Mouse
Bioassay |
Binding
Assay53) |
| TTX (1) |
1 |
1 |
1 |
|
1 |
1 |
1 |
1 |
1 |
| 4-epiTTX (2) |
0.06 |
NT |
NT |
|
NT |
NT |
NT |
0.14 |
0.03 |
| 11-norTTX-6(S)-ol (4) |
0.02 |
0.05 |
0.50 |
|
0.24 |
0.40 |
NT |
0.19 |
0.08 |
| 11-oxoTTX (5) |
1.2 |
3.0 |
0.42 |
|
NT |
NT |
1.6 |
0.63 |
1.2 |
NT denotes not tested. LD50 value of TTX by mouse bioassay (i.p.) was previously reported as 10 µg/kg.76)
In this study, the Nav inhibitory activity of 4-epiTTX (2) on human Nav1.2 expressed in HEK293T cells was evaluated using whole-cell patch-clamp recordings for the first time (IC50 180 nM). As described above, 4-epiTTX is unstable and partially converted to TTX during long-term incubation in physiological conditions. Therefore, evaluation of the activity of 4-epiTTX by CBA was not performed. The TEF of 4-epiTTX (2) estimated by whole-cell patch-clamp recordings (0.06) was close to that previously evaluated in a binding assay (0.03)53) and that of previously determined toxicity in mice (0.14),61) confirming the low activity of 4-epiTTX. The TEFs of 11-norTTX-6(S)-ol (4) obtained using whole-cell patch-clamp recordings and CBA were 0.02 and 0.05, respectively, in this study. In comparison, the reported TEFs based on autopatch analysis using Neuro-2a cells69) and CBA70) were 0.24 and 0.40, respectively, which are much higher than those obtained in this study. The purity of 11-norTTX-6(S)-ol (4) used for CBA by Alkassar et al.70) was reported to be 85% based on multiple ion monitoring LCMS, and that used for the autopatch assay by Reverte et al.69) was approximately 90%, containing 10% TTX based on LCMS analysis, documented in the Supporting Information accompanying their report. Therefore, the lower TEFs obtained in this study compared with those in the aforementioned reports is probably attributable the higher purity of 11-norTTX-6(S)-ol (4) used herein compared with that used in previous studies.54),69),71) However, because Neuro-2a cells expressed multiple Nav channels α subunits, including Nav1.2, 1.3, 1.4 and 1.7,71) the difference in the TEFs determined using whole-cell patch-clamp recordings in this study using HEK293T cells expressing Nav1.2 from those determined by autopatch in the literature using Neuro-2a cells69) may also be explained by the difference in the expressed subtypes of Nav in the cells.
Notably, in the toxicity analysis, the TEF of 11-norTTX-6(S)-ol (4) for mice in this study was 0.50, and that in the author’s previous report was 0.19. Both are much higher than the TEFs obtained using whole-cell patch-clamp recordings and the CBA in this study, suggesting that 11-norTTX-6(S)-ol (4) still has high in vivo toxicity, which should be considered with regard to regulation of the toxins. The TEFs of 11-oxoTTX (5) obtained in this study using whole-cell patch-clamp recordings, CBA, and mouse bioassays, were 1.2, 3.0, and 0.42, respectively. These values are close to those of our previous data from CBA,40) mouse bioassay,52) and binding assay results53) of 1.6, 0.63, and 1.2, respectively. These data confirm the high activity of 11-oxoTTX, consistent with the report by Wu et al.66)
We previously reported that all six hydroxy groups in TTX contribute to the Nav inhibitory activity based on a competitive binding assay with 3H-saxitoxin using purified TTX analogues, 4-epiTTX (2), 4,9-anhydroTTX (3), 6-epiTTX (7), 11-deoxyTTX (6), 11-norTTX-6,6-diol, TTX-11-carboxylic acid, 11-norTTX-6(S)-ol (4), 11-norTTX-6(R)-ol, chiriquitoxin, and TTX-8-O-hemisuccinate.53) This was supported by author’s previous report on TTX analogues using whole-cell patch-clamp recordings.54) In addition, analysis of CryoEM images of the Nav1.7-TTX complex72) confirmed this observation. Thus, the larger IC50 value of 4-epiTTX (2) compared with that of TTX confirmed in this study can be explained by the loss of one hydrogen bond from C4-OH. Likewise, the larger IC50 value of 11-norTTX-6(S)-ol (4) compared with that of TTX is plausibly attributable to the disruption of hydrogen bonding between C11-OH and Nav, although the toxicity of 11-norTTX-6(S)-ol (4) in mice is still high. The high biological activity of 11-oxoTTX (5) is plausibly attributable to an additional hydrogen bond between the hydrated aldehyde at C-11 and Nav compared with TTX as suggested previously.53)
The data obtained in this study using highly purified TTX analogues will be useful for assessing the toxicity of these analogues for regulatory purposes.
3. Conclusion
In this study, three major TTX analogues, 4-epiTTX, 11-norTTX-6(S)-ol and 11-oxoTTX were highly purified and 13C NMR data and ratios of the hemilactal and 10,7-lactone forms were determined. Nav blocking activity and toxicity of these compounds in mice were evaluated, and the TEFs were compared with previous related data. These data will contribute to chemical studies and regulatory science of TTX and its analogues.
4. Methods
4.1. Purification and preparation of TTX analogues.
4-epiTTX (2) was purified from the side fraction from which 6-deoxyTTX (7)39) was purified from the ovary (250 g) of pufferfish Takifugu pardalis. Briefly, a TTX and analogues containing fraction was obtained by extraction from the ovary with 0.2 M AcOH by heating. From the extract, 4-epiTTX (2) was purified by subsequent chromatographic purification with charcoal, ion exchange columns such as Bio-Rex 70 (BioRad), Hitachi 3011C, and 3013C (Hitachi), and a HILIC column, TSKgel amide-80 (Tosoh), as reported previously for the purification of 6-deoxyTTX (7). Similarly, the side fraction from the purification of 1-hydroxy-8-epiTTX from newt Cynops ensicauda popei (170 g)47) was also used to obtain 4-epiTTX (2). Elution of 4-epiTTX (2) was detected using LC-FLD63),64) and LCMS38),73) for TTXs. For final confirmation of purity, LCMS and NMR were used. The obtained pure 4-epiTTX (2) (72 µg, 97% purity by LCMS) was applied to NMR. Similarly, 11-norTTX-6(S)-ol (4) (48 µg, 98% purify by LCMS) was purified from the side fraction of 9-epiTTX (9) obtained from the ovary of pufferfish T. flavipterus.42) Additionally, 11-norTTX-6(S)-ol (4) (72 µg, 98% purify by LCMS) was chemically derived from TTX using the reported method53) to apply to NMR. 11-oxoTTX (5) (82 µg, 99% purify by LCMS) was purified from the skin of pufferfish Arothron manilensis (36 g).40) Purity was confirmed by 1H NMR spectra and LCMS peak areas (Figs. S24–S26). After purification, the compounds were lyophilized, kept at −30 °C, and used for assay within 6 months.
4.2. NMR analysis.
NMR spectra were recorded on an Agilent 600 MHz NMR spectrometer with a 5 mm ID probe and a Bruker AVANCE III 600 with a 5 mm CryoProbe in CD3COOD-D2O (4:96, v/v) at 20 °C. The signal of CHD2COOD at 2.06 ppm in the 1H NMR spectra and that of 13CD3COOD at 22.4 ppm in the 13C NMR spectra were used as the internal references. NMR experiments were performed in 0.18 mL of solvent using micro-bottom NMR tubes (SP-504; upper part i.d. 5 mm, lower part i.d. 3 mm, Shigemi) or an i.d. 5 mm standard NMR tube (Super Grade, Kanto Chemical Co., Inc.). The signals were assigned based on the analyses of the COSY, TOCSY (mixing time 80 ms), HSQC, HMBC (2,3JCH = 8 Hz), and NOE difference spectra or NOESY1D spectra (mixing time 500 ms).
4.3. Quantitation of TTX analogues using 1H NMR spectroscopy.
Standard TTX (0.4 mg, Wako Pure Chemical Industries) was quantified using the previously reported qNMR method62) in 400 µL CD3COOD-D2O 4:96 (v/v) in an i.d. 5 mm standard NMR tube. This TTX was used as the standard for qNMR of 4-epiTTX (2), 11-norTTX-6(S)-ol (4), and 11-oxoTTX (5) in this study. Purified analogues were individually dissolved in 400 µL CD3COOD-D2O 4:96 (v/v) and kept in an i.d. 5 mm standard NMR tube (Super Grade, Kanto Chemical Co., Inc.). The 1H NMR spectrum of standard TTX was measured using an Agilent 600 MHz NMR spectrometer, spectral width 9615.4 Hz (−2–14 ppm) and scan number 100. The 1H NMR spectra of these TTX analogues were measured continuously in the same conditions as that of standard TTX. The amounts of these analogues were calculated based on the integration value of H-4a signals (total of hemilactal and 10,7-lactone forms) compared with that of standard TTX.
4.4. LCMS for TTXs.
The purity of TTX analogues was determined using LCMS38) based on area size of the peak on LCMS as follows. MS experiments were recorded on a micrOTOF-Q II mass spectrometer (Bruker Daltonics) equipped with an ESI source. LC was performed using an LC-30AD pump (Shimadzu), SIL-30AC autosampler (Shimadzu), CTO-20AC column oven (Shimadzu), and CBM-20A communications bus module (Shimadzu). Acquisition parameters of the mass spectrometer were as follows: ion polarity: positive, capillary: 4500 V, nebulizer: 1.6 Bar, dry heater: 180 °C, dry gas: 7.0 L/min (nitrogen). To analyze TTX analogues, HILIC38),73) was performed using a TSK gel Amide-80 column (i.d. 2.0 × 150 mm, 5 µm, Tosoh) with 16 mM HCOONH4 aq./CH3CN/formic acid (30:70:0.002, v/v/v) as the mobile phase at a flow rate of 0.2 mL/min at 25 °C. The ions at m/z 320.1088 (TTX (1) and 4-epiTTX (2), 290.0987 (11-norTTX-6(S)-ol (4)), and 336.1038 (11-oxoTTX (5)) corresponding to the [M + H]+ ions were analyzed in extracted ion chromatograms. The mass tolerance width for the ions was 0.05.
4.5. LC-FLD for TTXs.
Post-column LC-FLD for TTXs was performed as described previously.63),64) The LC conditions were as follow: Develosil C30 UG-5 (0.46 cm i.d. × 25 cm) (Nomura Chemical, Seto, Japan) with 30 mM ammonium heptafluorobutyrate buffer (pH 5.0) and 10 mM ammonium formate buffer (pH 5.0) containing 1% (v/v) acetonitrile at a flow rate of 0.4 mL/min at 20 °C. For the post column reaction, 4 M NaOH flow rate of 0.7 mL/min to be heated at 105 °C in the stainless tube (0.46 mm i.d. × 3.5 m). The derived fluorophores by post column reaction were detected using a Jasco FP2025 plus fluoromonitor (Jasco, Tokyo, Japan) setting excitation wavelength at 365 nm and emission wavelength at 510 nm.
4.6. Estimation of purity of TTX analogues.
The purity of 4-epiTTX (2), 11-norTTX-6(S)-ol (4), and 11-oxoTTX (5) were first confirmed using 1H NMR to check that compounds other than TTX analogues were not detectable (<5%, S/N 2) (Figs. 2-1, 2-2, 2-3, S1, S12, and S15). Then, the purities of the TTX analogues were estimated using HRLCMS, as the value of (peak area of the corresponding TTX analogue/total peak area of other TTX analogues) × 100%, where TTX, 5,6,11-trideoxyTTX, dideoxyTTXs, deoxyTTXs, 11-norTTX-6-ols, and 11-oxoTTX (5), and anhydro-type analogues were detected on the extract ion chromatograms at m/z 320.1088 ± 0.02, 302.0983 ± 0.02, 272.1241 ± 0.02, 254.1136 ± 0.02, 288.1190 ± 0.02, 304.1139 ± 0.02, 336.1039 ± 0.05, 318.0933 ± 0.05 and 290.0987 ± 0.05, respectively.
4.7. Whole-cell patch-clamp recordings.
Human Nav1.2 was transiently expressed in HEK293T cells (RCB2202, RIKEN BioResource Research Center) in accordance with Tsukamoto T, et al.54) Whole-cell patch-clamp recordings were conducted using a whole-cell recording configuration. The extracellular buffer comprised 140 mM NaCl, 1.0 mM MgCl2·6H2O, 5.0 mM CsCl, 1.8 mM CaCl2, and 10 mM HEPES (pH 7.4, adjusted with NaOH). Intracellular buffer containing 90 mM CsF, 50 mM CsCl, 10 mM NaF, 2.0 mM MgCl2·6H2O, 10 mM EGTA, 10 mM HEPES (pH 7.4, adjusted with CsOH). Recordings were performed at room temperature using an EPC10 USB amplifier (HEKA Elektronik Dr. Schulze GmbH, Lambrecht, Pfalz, Germany) that was controlled using Patchmaster software. When a glass capillary was attached to the bath solution, the capillary resistance was 2–5 MΩ. The series resistance was compensated at more than 50%. Experimental investigations into the activities of TTX and its analogues were conducted as long as the gigaseal was retained.
Characterization and inhibition of the Nav by the test compounds described elsewhere in detail54) were conducted as follows. The holding potential was set at 100 mV, and a series of rectangular pulses consisting of 100 mV for 10 ms, test potential in the range 80 to +40 mV in 10 mV increments for 20 ms and 100 mV for 10 ms were applied to the cell every 5 s to obtain an I–V relationship. The dose-dependent inhibition of the expressed Nav by the test compound was investigated as follows. Test pulses to −10 mV for 20 ms were applied to the cell every 10 s. The cell in the whole-cell configuration was perfused with extracellular buffer containing the test compound applied to the cell using a Y-tube system,74) and the effect was evaluated by means of a decrease in the peak current. The inhibition ratio (%) was plotted against the concentration of the test compound, and the dose–response curve was fitted to the Hill equation in the form R (L) = Rmin + (Rmax − Rmin)/[1 + (IC50/L)rate], where R (L), Rmin, Rmax, L and rate represent the inhibition ratio at a concentration of the test compound, maximum inhibition ratio, minimum inhibition ratio, concentration of the test compound, and Hill coefficient, respectively. The whole-cell patch-clamp recordings were analyzed using IgorPro software (Hulinks).
4.8. CBA for Nav blocking activity.
Inhibition of Nav by TTX analogues was estimated from their reduction of the cytotoxicity induced by ouabain and veratridine in Neuro-2a cells (RCB2639, Riken BRC, Tsukuba, Japan) as reported previously.40),58)–60),75) Cultured cells were harvested with a trypsin/EDTA solution (0.05%/0.2%, w/v) (Gibco, Thermo Fisher Scientific, Waltham, MA, U.S.A.) in PBS, and cells were suspended at a density of 3–5 × 10⁵ cells/mL in growth medium (RPMI1640, Sigma-Aldrich). Preparation of the test medium, TTX analogues from stock solutions were diluted to the required concentrations with the growth medium containing ouabain (100 µM) (Sigma-Aldrich) and veratridine (55 µM) (Sigma-Aldrich). Following preculture of the cells (100 µL of medium) in 96-well plates under 5% CO2 at 37 °C for 12 h, the test medium (100 µL) was added. After continuous incubation for 24 h, the cell viability was determined using a WST-8 ((2-(2-methoxy-4-nitrophenyl)-3-(4-nitrophenyl)-5-(2,4-disulfophenyl)-2H-tetrazolium) assay with a Cell Counting Kit-8 (Dojindo, Kumamoto, Japan) (5 µL/well). Absorbance at 450 nm correcting the turbidity by setting the reference reading at 655 nm was measured for each well on a microplate reader (model 550, Bio-Rad) after incubation at 37 °C for 2 h. Triplicate sets of experiments were repeated at least three times for each compound. Cell viability of the well containing the test medium in the presence of only ouabain and veratridine (no TTX analogues) was taken as 0%, and that of the well containing medium in the absence of all toxins was taken as 100%. The EC50 values were determined from the Hill plot (where log P/(100 − P) = 0) (P = viable cells, % of control).
4.9. Mouse bioassay.
Mouse bioassays were performed as described in the result and discussion section. The mouse bioassays were approved by the Animal Ethical Committee of Tohoku University (protocol approval number 2019AgA-002-02, 2024AgA-020).
Conflict of interest
The authors declare no conflicts of interest.
Acknowledgements
This work was funded by the Ministry of Health, Labour and Welfare, Japan (No. H30-Shokuhin-Ippan-005), and by Japan Society for the Promotion of Science (JSPS) KAKENHI no. JP23H02146, JP23K26839 and JP17H06406 to M.Y.Y, no. JP17H02199 and JP17H06406 to K.K., no. JP22K14833 and JP24K08723 to Y.K. The human embryonic lung fibroblast cell line, HEK293T (RCB2202), and mouse neuroblastoma cell line, Neuro-2a (RCB2639), were kindly provided by the RIKEN BRC through the National Bio-Resource Project of the MEXT, Japan. We thank Mr. Daisuke Unabara, Institute of Multidisciplinary Research for Advanced Materials, Tohoku University, for acquiring NMR spectra using the Bruker AVANCE III 600.
Notes
Edited by Akira ISOGAI, M.J.A.
Correspondence should be addressed to: M. Yotsu-Yamashita, Graduate School of Agricultural Science, Tohoku University, 468-1 Aramaki-Aza-Aoba, Aoba-ku, Sendai, Miyagi 980-8572, Japan (e-mail: mari.yamashita.c1@tohoku.ac.jp).
References
- 1) Narahashi, T., Deguchi, T., Urakawa, N. and Ohkubo, Y. (1960) Stabilization and rectification of muscle fiber membrane by tetrodotoxin. Am. J. Physiol. 198, 934–938.
- 2) Kao, C.Y. (1966) Tetrodotoxin, saxitoxin and their significance in the study of excitation phenomena. Pharmacol. Rev. 18, 997–1049.
- 3) Tahara, Y. (1909) Studies on globefish poison. J. Pharm. Soc. Jpn. 29, 587–625 (in Japanese).
- 4) Yokoo, A. (1950) Studies on a toxin of the globefish. III. Nippon Kagaku Zassi 71, 590–592.
- 5) Tsuda, K., Ikuma, S., Kawamura, M., Tachikawa, R., Sakai, K., Tamura, C. et al. (1964) Tetrodotoxin. Vll. On the structures of tetrodotoxin and its derivatives. Chem. Pharm. Bull. 12, 1357–1374.
- 6) Goto, T., Kishi, Y., Takahashi, S. and Hirata, Y. (1965) Tetrodotoxin. Tetrahedron 21, 2059–2088.
- 7) Woodward, R.B. (1964) The structure of tetrodotoxin. Pure Appl. Chem. 9, 49–74.
- 8) Kishi, Y., Fukuyama, T., Aratani, M., Nakatsubo, F., Goto, T., Inoue, S. et al. (1972) Synthetic studies on tetrodotoxin and related compounds. IV.12 Stereospecific total syntheses of DL-tetrodotoxin. J. Am. Chem. Soc. 94, 9219–9221.
- 9) Ohyabu, N., Nishikawa, T. and Isobe, M. (2003) First asymmetric total synthesis of tetrodotoxin. J. Am. Chem. Soc. 125, 8798–8805.
- 10) Nishikawa, T., Urabe, D. and Isobe, M. (2004) An efficient total synthesis of optically active tetrodotoxin. Angew. Chem. Int. Ed. Engl. 43, 4782–4785.
- 11) Sato, K.I., Akai, S., Shoji, H., Sugita, N., Yoshida, S., Nagai, Y. et al. (2008) Stereoselective and efficient total synthesis of optically active tetrodotoxin from D-glucose. J. Org. Chem. 73, 1234–1242.
- 12) Maehara, T., Motoyama, K., Toma, T., Yokoshima, S. and Fukuyama, T. (2017) Total Synthesis of (−)-Tetrodotoxin and 11-norTTX-6(R)-ol. Angew. Chem. Int. Ed. Engl. 56, 1549–1552.
- 13) Murakami, K., Toma, T., Fukuyama, T. and Yokoshima, S. (2020) Total synthesis of tetrodotoxin. Angew. Chem. Int. Ed. Engl. 59, 6253–6257.
- 14) Hinman, A. and Du Bois, J. (2003) A stereoselective synthesis of (−)-tetrodotoxin. J. Am. Chem. Soc. 125, 11510–11511.
- 15) Konrad, D.B., Rühmann, K.P., Ando, H., Hetzler, B.E., Strassner, N., Houk, K.N. et al. (2022) A concise synthesis of tetrodotoxin. Science 377, 411–415.
- 16) Chen, P., Wang, J., Zhang, S., Wang, Y., Sun, Y., Bai, S. et al. (2024) Total syntheses of tetrodotoxin and 9-epitetrodotoxin. Nat. Commun. 15, 679.
- 17) Yasumoto, T. and Yotsu-Yamashita, M. (1996) Chemical and etiological studies on tetrodotoxin and its analogs. J. Toxicol. Toxin Rev. 15, 81–90.
- 18) Noguchi, T. and Arakawa, O. (2008) Tetrodotoxin — Distribution and accumulation in aquatic organisms, and cases of human intoxication. Mar. Drugs 6, 220–242.
- 19) Okabe, T., Saito, R., Yamamoto, K., Watanabe, R., Kaneko, Y., Yanaoka, M. et al. (2021) The role of toxic planocerid flatworm larvae on tetrodotoxin accumulation in marine bivalves. Aquat. Toxicol. 237, 105908.
- 20) Mosher, H.S., Fuhrman, F.A., Buchwald, H.D. and Fischer, H.G. (1964) Tarichatoxin—Tetrodotoxin: A potent neurotoxin. Science 144, 1100–1110.
- 21) Yasumoto, T., Yotsu, M., Murata, M. and Naoki, H. (1988) New tetrodotoxin analogues from the newt Cynops ensicauda. J. Am. Chem. Soc. 110, 2344–2345.
- 22) Mebs, D., Arakawa, O. and Yotsu-Yamashita, M. (2010) Tissue distribution of tetrodotoxin in the red-spotted newt Notophthalmus viridescens. Toxicon 55, 1353–1357.
- 23) Hanifin, C.T., Kudo, Y. and Yotsu-Yamashita, M. (2022) Chemical ecology of the North American newt genera Taricha and Notophthalmus. In Progress in the Chemistry of Organic Natural Products, Vol. 118. (eds. Kinghorn, A.D., Falk, H., Gibbons, S., Asakawa, Y., Liu, J.K. and Dirsch, V.M.). Springer, Cham, pp. 101–130.
- 24) Fuhrman, F.A., Fuhrman, G.J. and Mosher, H.S. (1969) Toxin from skin of frogs of the genus Atelopus: Differentiation from dendrobatid toxins. Science 165, 1376–1377.
- 25) Yotsu-Yamashita, M. and Tateki, E. (2010) First report on toxins in the Panamanian toads Atelopus limosus, A. glyphus and A. certus. Toxicon 55, 153–156.
- 26) Turner, A.D., Powell, A., Schofield, A., Lees, D.N. and Baker-Austin, C. (2015) Detection of the pufferfish toxin tetrodotoxin in European bivalves, England, 2013 to 2014. Euro Surveill. 20, 21009.
- 27) Biessy, L., Boundy, M.J., Smith, K.F., Harwood, D.T., Hawes, I. and Wood, S.A. (2019) Tetrodotoxin in marine bivalves and edible gastropods: A mini-review. Chemosphere 236, 124404.
- 28) Numano, S., Kudo, Y., Cho, Y., Konoki, K. and Yotsu-Yamashita, M. (2019) Temporal variation of the profile and concentrations of paralytic shellfish toxins and tetrodotoxin in the scallop, Patinopecten yessoensis, cultured in a bay of East Japan. Mar. Drugs 17, 653.
- 29) Knutsen, H.K., Alexander, J., Barregård, L., Bignami, M., Brüschweiler, B., Ceccatelli, S. et al. (2017) Risks for public health related to the presence of tetrodotoxin (TTX) and TTX analogues in marine bivalves and gastropods. EFSA J. 15, 4752.
- 30) Noguchi, T., Jeon, J.K., Arakawa, O., Sugita, H., Deguchi, Y., Shida, Y. et al. (1986) Occurrence of tetrodotoxin and anhydrotetrodotoxin in Vibrio sp. Isolated from the intestines of a xanthid crab, Atergatis floridus. J. Biochem. 99, 311–314.
- 31) Yasumoto, T., Yasumura, D., Yotsu, M., Michishita, T., Endo, A. and Kotaki, Y. (1986) Bacterial production of tetrodotoxin and anhydrotetrodotoxin. Agric. Biol. Chem. 50, 793–795.
- 32) Vaelli, P.M., Theis, K.R., Williams, J.E., O’connell, L.A., Foster, J.A. and Eisthen, H.L. (2020) The skin microbiome facilitates adaptive tetrodotoxin production in poisonous newts. eLife 9, e53898.
- 33) Yotsu-Yamashita, M. (2001) Chemistry of puffer fish toxin. J. Toxicol. Toxin Rev. 20, 51–66.
- 34) Yotsu, M., Hayashi, Y., Khora, S.S., Sato, S.I. and Yasumoto, T. (1992) Isolation and structural assignment of 11-nortetrodotoxin-6(S)-ol from the puffer Arothron nigropunctatus. Biosci. Biotechnol. Biochem. 56, 370–371.
- 35) Yotsu-Yamashita, M., Yamagishi, Y. and Yasumoto, T. (1995) 5,6,11-trideoxytetrodotoxin from the puffer fish, Fugu poecilonotus. Tetrahedron Lett. 36, 9329–9332.
- 36) Yotsu-Yamashita, M., Schimmele, B. and Yasumoto, T. (1999) Isolation and structural assignment of 5-deoxytetrodotoxin from the puffer fish Fugu poecilonotus. Biosci. Biotechnol. Biochem. 63, 961–963.
- 37) Jang, J.H. and Yotsu-Yamashita, M. (2007) 6,11-Dideoxytetrodotoxin from the puffer fish, Fugu pardalis. Toxicon 50, 947–951.
- 38) Yotsu-Yamashita, M., Abe, Y., Kudo, Y., Ritson-Williams, R., Paul, V.J., Konoki, K. et al. (2013) First identification of 5,11-dideoxytetrodotoxin in marine animals, and characterization of major fragment ions of tetrodotoxin and its analogs by high resolution ESI-MS/MS. Mar. Drugs 11, 2799–2813.
- 39) Kudo, Y., Finn, J., Fukushima, K., Sakugawa, S., Cho, Y., Konoki, K. et al. (2014) Isolation of 6-deoxytetrodotoxin from the pufferfish, Takifugu pardalis, and a comparison of the effects of the C-6 and C-11 hydroxy groups of tetrodotoxin on its activity. J. Nat. Prod. 77, 1000–1004.
- 40) Saruhashi, S., Konoki, K. and Yotsu-Yamashita, M. (2016) The voltage-gated sodium ion channel inhibitory activities of a new tetrodotoxin analogue, 4,4a-anhydrotetrodotoxin, and three other analogues evaluated by colorimetric cell-based assay. Toxicon 119, 72–76.
- 41) Ueyama, N., Sugimoto, K., Kudo, Y., Onodera, K.I., Cho, Y., Konoki, K. et al. (2018) Spiro bicyclic guanidino compounds from pufferfish: possible biosynthetic intermediates of tetrodotoxin in marine environments. Chemistry 24, 7250–7258.
- 42) Yaegashi, Y., Kudo, Y., Ueyama, N., Onodera, K.I., Cho, Y., Konoki, K. et al. (2022) Isolation and biological activity of 9-epitetrodotoxin and isolation of Tb-242B, possible biosynthetic shunt products of tetrodotoxin from pufferfish. J. Nat. Prod. 85, 2199–2206.
- 43) Kudo, Y., Yasumoto, T., Konoki, K., Cho, Y. and Yotsu-Yamashita, M. (2012) Isolation and structural determination of the first 8-epi-type tetrodotoxin analogs from the newt, Cynops ensicauda popei, and comparison of tetrodotoxin analogs profiles of this newt and the puffer fish, Fugu poecilonotus. Mar. Drugs 10, 655–667.
- 44) Kudo, Y., Yamashita, Y., Mebs, D., Cho, Y., Konoki, K., Yasumoto, T. et al. (2014) C5–C10 directly bonded tetrodotoxin analogues: Possible biosynthetic precursors of tetrodotoxin from newts. Angew. Chem. Int. Ed. Engl. 53, 14546–14549.
- 45) Kudo, Y., Yasumoto, T., Mebs, D., Cho, Y., Konoki, K. and Yotsu-Yamashita, M. (2016) Cyclic guanidine compounds from toxic newts support the hypothesis that tetrodotoxin is derived from a monoterpene. Angew. Chem. Int. Ed. Engl. 55, 8728–8731.
- 46) Kudo, Y. and Yotsu-Yamashita, M. (2019) Isolation and biological activity of 8-epitetrodotoxin and the structure of a possible biosynthetic shunt product of tetrodotoxin, Cep-226A, from the newt Cynops ensicauda popei. J. Nat. Prod. 82, 1656–1663.
- 47) Kudo, Y., Hanifin, C.T., Kotaki, Y. and Yotsu-Yamashita, M. (2020) Structures of N-hydroxy-type tetrodotoxin analogues and bicyclic guanidinium compounds found in toxic newts. J. Nat. Prod. 83, 2706–2717.
- 48) Kudo, Y., Hanifin, C.T. and Yotsu-Yamashita, M. (2021) Identification of tricyclic guanidino compounds from the tetrodotoxin-bearing newt Taricha granulosa. Org. Lett. 23, 3513–3517.
- 49) Yotsu, M., Yasumoto, T., Hae Kim, Y., Naoki, H. and Kao, C.Y. (1990) The structure of chiriquitoxin from the costa rican frog Atelopus chiriquiensis. Tetrahedron Lett. 31, 3187–3190.
- 50) Khora, S.S. and Yasumoto, T. (1989) Isolation of 11-oxotetrodotoxin from the puffer Arothron nigropunctatus. Tetrahedron Lett. 30, 4393–4394.
- 51) Taniyama, S., Isami, Y., Matsumoto, T., Nagashima, Y., Takatani, T. and Arakawa, O. (2009) Toxicity and toxin profile of tetrodotoxin detected in the scavenging gastropod Nassarius (Alectrion) glans “kinshibai”. Food Hygiene Safety Sci. (Shokuhin Eiseigaku Zasshi) 50, 22–28 (in Japanese with English Abstract).
- 52) Yotsu-Yamashita, M. and Mebs, D. (2003) Occurrence of 11-oxotetrodotoxin in the red-spotted newt, Notophthalmus viridescens, and further studies on the levels of tetrodotoxin and its analogues in the newt’s efts. Toxicon 41, 893–897.
- 53) Yotsu-Yamashita, M., Sugimoto, A., Takai, A. and Yasumoto, T. (1999) Effects of specific modifications of several hydroxyls of tetrodotoxin on its affinity to rat brain membrane. J. Pharmacol. Exp. Ther. 289, 1688–1696.
- 54) Tsukamoto, T., Chiba, Y., Wakamori, M., Yamada, T., Tsunogae, S., Cho, Y. et al. (2017) Differential binding of tetrodotoxin and its derivatives to voltage-sensitive sodium channel subtypes (Nav1.1 to Nav1.7). Br. J. Pharmacol. 174, 3881–3892.
- 55) Choudhary, G., Yotsu-Yamashita, M., Shang, L., Yasumoto, T. and Dudley, S.C. Jr (2003) Interactions of the C-11 hydroxyl of tetrodotoxin with the sodium channel outer vestibule. Biophys. J. 84, 287–294.
- 56) Kao, C.Y. (1981) Tetrodotoxin, saxitoxin, chiriquitoxin: New perspectives on ionic channels. Fed. Proc. 40, 30–35.
- 57) Narahashi, T. (2008) Tetrodotoxin — A brief history. Proc. Jpn. Acad., Ser. B, Phys. Biol. Sci. 84, 147–154.
- 58) Hamasaki, K., Kogure, K. and Ohwada, K. (1996) A biological method for the quantitative measurement of tetrodotoxin (TTX): Tissue culture bioassay in combination with a water-soluble tetrazolium salt. Toxicon 34, 490–495.
- 59) Manger, R.L., Leja, L.S., Lee, S.Y., Hungerforg, J.M. and Wekell, M.M. (1993) Tetrazolium-based cell bioassay for neurotoxins active on voltage-sensitive sodium channels: Semiautomated assay for saxitoxins, brevetoxins, and ciguatoxins. Anal. Biochem. 214, 190–194.
- 60) Yotsu-Yamashita, M., Urabe, D., Asai, M., Nishikawa, T. and Isobe, M. (2003) Biological activity of 8,11-dideoxytetrodotoxin: Lethality to mice and the inhibitory activity to cytotoxicity of ouabain and veratridine in mouse neuroblastoma cells, Neuro-2a. Toxicon 42, 557–560.
- 61) Nakamura, M. and Yasumoto, T. (1985) Tetrodotoxin derivatives in puffer fish. Toxicon 23, 271–276.
- 62) Watanabe, R., Tanioka, M., Uchida, H., Matsushima, R., Oikawa, H., Matsumiya, M. et al. (2019) Quantitation of tetrodotoxin and its analogues with a combination of liquid chromatography-tandem mass spectrometry and quantitative 1H-NMR spectroscopy. J. Agric. Food Chem. 67, 12911–12917.
- 63) Yasumoto, T. and Michishita, T. (1985) Fluorometric determination of tetrodotoxin by high performance liquid chromatography. Agric. Biol. Chem. 49, 3077–3080.
- 64) Shoji, Y., Yotsu-Yamashita, M., Miyazawa, T. and Yasumoto, T. (2001) Electrospray ionization mass spectrometry of tetrodotoxin and its analogs: Liquid chromatography/mass spectrometry, tandem mass spectrometry, and liquid chromatography/tandem mass spectrometry. Anal. Biochem. 290, 10–17.
- 65) Kao, C.Y. and Yasumoto, T. (1985) Actions of 4-epitetrodotoxin and anhydrotetrodotoxin on the squid axon. Toxicon 23, 725–729.
- 66) Wu, B.Q., Yang, L., Kao, C.Y., Levinson, S.R., Yotsu-Yamashita, M. and Yasumoto, T. (1996) 11-Oxo-tetrodotoxin and a specifically labelled 3H-tetrodotoxin. Toxicon 34, 407–416.
- 67) Kodama, M. and Sato, S. (2005) The Manual for the Methods of Food Sanitation Tests (ed. Bureau of Environmental Health. Ministry of Health and Welfare, Japan). Japan Food Hygienic Association, Tokyo (in Japanese).
- 68) Suzuki, H. (2025) Necessity of redefinition and revision of mouse unit for tetrodotoxin: Relationship between lethal time and mouse unit of tetrodotoxin in mouse bioassay. Toxicon 265, 108474.
- 69) Reverté, J., Rambla-Alegre, M., Sanchez-Henao, A., Mandalakis, M., Peristeraki, P., Molgó, J. et al. (2024) Toxicity equivalency factors for tetrodotoxin analogues determined with automated patch clamp on voltage-gated sodium channels in Neuro-2a cells. J. Agric. Food Chem. 72, 18192–18200.
- 70) Alkassar, M., Sanchez-Henao, A., Reverté, J., Barreiro, L., Rambla-Alegre, M., Leonardo, S. et al. (2023) Evaluation of toxicity equivalency factors of tetrodotoxin analogues with a Neuro-2a cell-based assay and application to puffer fish from Greece. Mar. Drugs 21, 432.
- 71) Lou, J.Y., Laezza, F., Gerber, B.R., Xiao, M., Yamada, K.A., Hartmann, H. et al. (2005) Fibroblast growth factor 14 is an intracellular modulator of voltage-gated sodium channels. J. Physiol. 569, 179–193.
- 72) Shen, H., Liu, D., Wu, K., Lei, J. and Yan, N. (2019) Structures of human Nav 1.7 channel in complex with auxiliary subunits and animal toxins. Science 363, 1303–1308.
- 73) Yotsu-Yamashita, M., Jang, J.H., Cho, Y. and Konoki, K. (2011) Optimization of simultaneous analysis of tetrodotoxin, 4-epitetrodotoxin, 4,9-anhydrotetrodotoxin, and 5,6,11-trideoxytetrodotoxin by hydrophilic interaction liquid chromatography-tandem mass spectrometry. Forensic Toxicol. 29, 61–64.
- 74) Yamaoka, K., Inoue, M., Miyahara, H., Miyazaki, K. and Hirama, M. (2004) A quantitative and comparative study of the effects of a synthetic ciguatoxin CTX3C on the kinetic properties of voltage-dependent sodium channels. Br. J. Pharmacol. 142, 879–889.
- 75) Manger, R.L., Leja, L.S., Lee, S.Y., Hungerford, J.M., Hokama, Y., Dickey, R.W. et al. (1995) Detection of sodium channel toxins: directed cytotoxicity assays of purified ciguatoxins, brevetoxins, saxitoxins, and seafood extracts. J. AOAC Int. 78, 521–527.
- 76) Brown, M.S. and Mosher, H.S. (1963) Tarichatoxin - Isolation and purification. Science 140, 295–296.
Non-standard abbreviation list
CBAcell-based assay
EC5050% effective concentration
EFSAEuropean Food Safety Authority
H/Lratio of the hemilactal form to the 10,7-lactone form
i.p.intraperitoneal
Navvoltage-gated sodium channel
NMRnuclear magnetic resonance
LC-FLDliquid chromatography-fluorescence detection
LCMSliquid chromatography-mass spectrometry
MUmouse unit
PBSphosphate-buffered saline
qNMRquantitative nuclear magnetic resonance
SARstructure-activity relationship
TEFtoxicity equivalency factor
TTXtetrodotoxin


