ABSTRACT
Objective: Although previous studies have evidenced the value of
three-dimensional gait analysis (3DGA) for evaluating gait disorder, the time-consuming
measurement process and space requirement has hampered its use in the clinical setting.
The aim of this study was to examine the feasibility of a simplified 3DGA system for
stroke patients. Methods: Thirteen pairs of stroke patients and age- (± 1
year), gender-, and gait speed- (± 0.5 m/s) matched controls were drawn from the Fujita
Health University gait analysis database. 3DGA was performed using the
KinemaTracer® treadmill gait analysis system. Comparisons of the
spatiotemporal and kinematic parameters were performed between stroke patients and matched
controls. The correlations between items from the Wisconsin Gait Scale (WGS) and 3DGA data
in stroke patients were also investigated. Results: 3DGA measurements clearly
showed reduced toe clearance, hip flexion, and knee flexion in stroke patients compared
with the matched controls. In contrast, significant increases were observed in hip
elevation, shoulder elevation, shoulder lateral shift, and step width in stroke patients.
For the four items drawn from the WGS, a significant correlation with three 3DGA
parameters was observed: stance time on the impaired side, stance width, and knee flexion
from toe off to midswing. Conclusions: In this study, significant differences
in gait parameters of stroke patients and age-, gender-, and speed-matched controls were
found using a simplified 3DGA system. A significant correlation with WGS was also
observed. These results support the validity of the clinical measurement of gait
parameters using a simplified 3DGA system.
INTRODUCTION
Previous studies have shown the usefulness of three-dimensional gait analysis (3DGA) for
the evaluation of gait after stroke.1,2,3) To facilitate the understanding of gait disturbance related to
a stroke, high-quality motion analysis systems have been used to reveal the detailed
features of hemiparetic gait patterns, i.e., stiff knee gait, hip hiking, and circumduction.
Further, several recent studies have shown the feasibility of using 3DGA as a guide for
training.4,5)
However, the use of 3DGA in daily clinical practice is still limited because of its
disadvantages such as the time required for preparation and measurement, the space
requirements, the risk of falling, and difficulty in the interpretation of the results for
clinicians who are not familiar with gait analysis.6) Therefore, several clinical trials using simpler, more
affordable systems for gait analysis have recently been carried out using systems based on
simplified optical camera systems or accelerometers.7,8,9,10)
Although these systems were developed for clinical gait analysis, a problem remains
regarding the validity of the systems for such usage because of the relatively low accuracy
of measurement compared to the systems used for research. Consequently, simplified systems
for the clinical evaluation of gait disorders need to be validated.
In this study, we investigated the feasibility of using a simple 3DGA system for the
clinical analysis of gait in stroke patients. We evaluated the gait patterns of 13 stroke
patients with hemiparesis and compared them with age-, speed-, and gender-matched controls.
The differences between controls and patients are presented in holistic illustrations, and
quantitative analysis was used to investigate whether this approach can determine the
specific features of individual gait patterns of hemiparetic patients, thereby depicting the
differences between controls and patients. Further comparisons were made between the
parameters evaluated by the simplified 3DGA system and related parameters from the Wisconsin
Gait Scale (WGS),11) which is a
scale used for clinical gait evaluation.
METHODS
Subjects
Thirteen pairs of stroke patients and age- (± 1 year), gender-, and gait speed- (± 0.5
m/s) matched controls were drawn from the Fujita Health University gait analysis database.
The inclusion criteria for stroke patients were (1) hemiplegia, (2) being able to walk on
a treadmill independently, and (3) not being dependent on assisting devices (e.g.,
handrails, canes, or orthotics). Of the 13 hemiplegic patients, 10 were men and 3 were
women, and 7 had right hemiplegia and 6 had left hemiplegia; the average age was 48 ± 15
years. 3DGA was carried out between 200 and 5453 days (median 1176 days) after the onset
of stroke. The average total score of the stroke impairment assessment set
(SIAS)12) motor test was
9.2 ± 1.2. The average total WGS score was 22.9 ± 3.5. The average gait speed on a
treadmill was 2.3 ± 0.7 km/h. The demographic variables of the hemiplegic patients are
shown in Table 1.
Table 1.
Demographic and baseline characteristics of the subjects
|
Stroke |
Controls |
P |
| Age (years) |
48.2 ± 15.0 |
48.2 ± 15.2 |
0.58 |
| Male |
10 |
10 |
|
| Female |
3 |
3 |
1.00 |
| Days since stroke |
200–5453 (median 1176) |
|
|
| Right hemiparesis |
7 |
|
|
| Left hemiparesis |
6 |
|
|
| Treadmill speed (km/h) |
2.3 ± 0.7 |
2.3 ± 0.6 |
0.48 |
| SIAS motor score |
9.2 ± 1.2 |
|
|
| Wisconsin gait scale |
22.9 ± 3.5 |
|
|
SIAS: Stroke impairment assessment set
3DGA was performed using a simplified gait analysis system, the KinemaTracer® treadmill
gait analysis system (Kissei Comtec Co., Ltd., Matsumoto, Japan). A total of 12 markers
(30 mm in diameter) were placed bilaterally on the acromion (shoulder marker), iliac crest
(pelvis marker), great trochanter (hip marker), lateral femoral epicondyle (knee marker),
lateral malleolus (ankle marker), and the fifth metatarsal head (toe marker). The
subjectively comfortable gait speed was calculated from a 10-m walk test, and the
treadmill gait speed was set according to the ground gait speed. Subjects were not allowed
to use a handrail or orthosis. Videos were recorded at a sampling frequency of 60 Hz and a
measuring time of 20 s.
Heel-strike and toe-off events were determined automatically by the system based on the
toe and ankle marker trajectories. Two experienced physical therapists checked the
accuracy of the timing and made adjustments if there was an error. From these events, the
cadence (steps/min), stride length (m), step width (m), and the durations of double stance
and single stance (the seconds of gait cycle duration) were calculated.
The elevations of the toe, knee, hip, and shoulder markers; the lateral displacement of
the ankle and shoulder markers; and the angle changes (hip, knee, and ankle) on the
paretic side were calculated. The values for elevations of the toe, knee, hip, and
shoulder markers were obtained from the Z coordinate of the appropriate marker. The
shoulder and foot lateral shifts were calculated from the X coordinate of the appropriate
marker. All parameters were calculated as changes from the kinematic midswing and
midstance, where the midswing is defined as the value when the toe marker of the swing
limb passes the lateral malleolus, and the midstance is defined as the value when the
other limb passes the lateral malleolus of the stance limb. The trajectories of markers
are shown in a holistic view, as previously reported by Ohtsuka et al. as the Lissajous
overview picture (LOP).10)
The parameters measured by the 3DGA system were compared with those obtained using the
WGS observational gait analysis method.1) WGS is a frequently used gait scale for hemiplegic gait
analysis and consists of 14 items to evaluate typical hemiplegic gait patterns, e.g.,
circumduction and hip elevation.
This study was approved by the ethical committee of our institution. Informed consent was
obtained from all the patients.
All statistical analyses were conducted using the JMP11 package (SAS Institute Inc. Cary,
NC, USA). Descriptive statistics (means and standard deviations) were computed.
Differences between the stroke and control groups were investigated using the Mann–Whitney
U-test. The Kendall rank correlation coefficient was calculated for
correlation analysis. Nonparametric statistics were used because of the small sample size
(n = 13). A P-value of less than 0.05 was considered statistically significant.
RESULTS
Representative LOPs of the stroke patients and age-matched controls are shown in Fig. 1 The LOPs provide a holistic view of gait
patterns to illustrate the features of hemiparetic gait. The arrows indicate the gait
abnormalities frequently observed in hemiparetic patients.
The spatiotemporal parameters for stroke patients and matched controls are shown in Table 2. There were no significant differences
between the two groups in stride length, cadence, and duration of the stance phase. However,
significant shortening of the single stance phase (P = 0.0031) and a prolonged swing phase
(P = 0.0498) were observed in the stroke patients.
Table 2.
Spatiotemporal parameters
|
Stroke |
Control |
P |
| Cadence (cm) |
103.8 ± 20.6 |
105.9 ± 15.7 |
0.8003 |
| Stride (cm) |
73.4 ± 21.7 |
73.9 ± 19.9 |
0.9945 |
| Stance phase (s) |
0.75 ± 0.16 |
0.78 ± 0.15 |
0.5686 |
| Single stance (s) ** |
0.29 ± 0.06 |
0.38 ± 0.05 |
0.0031 |
| Double stance (s) |
0.45 ± 0.12 |
0.40 ± 0.11 |
0.2291 |
| Swing phase (s) * |
0.45 ± 0.09 |
0.37 ± 0.05 |
0.0498 |
* P < 0.05, ** P < 0.01
Table 3 shows the kinematic parameters of the
two groups and indicates the significant differences between the groups. The stroke group
showed reduced toe clearance (3.6 vs 8.6 cm, P < 0.0001), hip flexion (1.7 vs 7.9 cm, P =
0.0083), and knee flexion (14.3 vs 55.4 cm, P < 0.0001) in the paretic limb. In contrast,
a significant increase was observed in hip elevation (3.8 vs 0.2 cm, P < 0.0001),
shoulder elevation (4.0 vs −0.3 cm, P < 0.0001), shoulder lateral shift (4.2 vs 0.6, P =
0.0009), and step width (29.2 vs 23.3 cm, P = 0.0004), which are known to be compensatory
movements frequently found in stroke patients.
Table 3.
Kinematic parameters
|
Stroke |
Controls |
P |
| Toe clearance (cm) ** |
3.6 ± 1.7 |
8.6 ± 2.9 |
< 0.0001 |
| Foot lateral shift (cm) * |
7.3 ± 3.4 |
5.0 ± 1.7 |
0.0176 |
| Knee elevation (cm) |
4.5 ± 1.2 |
3.7 ± 1.5 |
0.1971 |
| Hip elevation (cm) ** |
3.8 ± 1.3 |
0.2 ± 0.6 |
< 0.0001 |
| Shoulder elevation (cm) ** |
4.0 ± 1.1 |
-0.3 ± 0.6 |
< 0.0001 |
| Shoulder lateral shift (cm) ** |
4.2 ± 2.5 |
0.6 ± 1.3 |
0.0009 |
| Hip flexion (°) ** |
1.7 ± 8.3 |
7.9 ± 6.7 |
0.0083 |
| Knee flexion (°) ** |
14.3 ± 17.4 |
55.4 ± 9.3 |
< 0.0001 |
| Ankle plantar flexion (°) |
6.2 ± 8.3 |
10.1 ± 6.4 |
0.1343 |
| Step width (cm) ** |
29.2 ± 3.6 |
23.3 ± 2.5 |
0.0004 |
* P < 0.05, ** P < 0.01
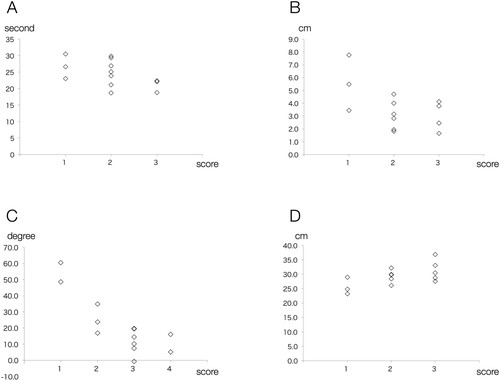
A comparison of the WGS subscales and the corresponding parameters evaluated by the 3DGA
system is shown in Fig. 2. The following subscales
in which the number of cases is two or more for every response option was employed for the
analysis: stance time on the impaired side, stance width, knee flexion from toe off to
midswing, and toe clearance.
Significant correlations between 3DGA parameters andWGS subscales were observed for stance
time on the impairedside (−0.55, P = 0.0175), stance width (0.47, P = 0.0417), and knee
flexion from toe off to midswing (−0.62, P = 0.0061). Toe clearance (−0.36, P = 0.112)
presented a weak correlation with the corresponding 3DGA parameter, and the correlation was
not significant in the present investigation.
DISCUSSION
In this study, the gait pattern of hemiparetic patients and healthy subjects was compared,
and significant differences were found between the two groups. The quantification of various
parameters illustrated reduced limb movement (e.g., knee and hip flexion) as a result of
paresis and an increase in compensatory movements (i.e., hip and shoulder elevation and
shoulder lateral shift). Despite the small sample size, significant correlations between
observational WGS scores and 3DGA kinematic parameters were observed. The LOP provides a
holistic overview of gait patterns composed from the combination of these changes.
Our results are consistent with previous studies describing the features of gait patterns
of hemiparetic patients (most typically referred to as a stiff knee gait) characterized by
reduced knee flexion and the presence of hip elevation and circumduction combined with a
shortened single-stance phase and a prolonged swing phase.1,13,14) In addition, the significant differences found between stroke
patients and age-, gender-, and speed- matched controls, together with the significant
correlations with WGS subscales, support the construct validity of the measurement method to
evaluate abnormal gait patterns in clinical settings.
A number of sophisticated studies using 3DGA systems have shown the gait mechanisms of
healthy subjects and patients suffering from gait disorders. Despite the success and
contribution of these studies to gait analysis research, 3DGA systems are still not widely
used in daily clinical practice. The main methods used to evaluate patients in daily
clinical practice are visual observation and clinical scoring. Considering the reliability
problems associated with visual observations reported in several specific
situations,15,16) the use of 3DGA in clinics would
appear to be a beneficial option for clinicians. However, there are several reasons why 3DGA
is not used for clinical gait analysis. The major reasons are space and time limitations and
safety considerations. Research-based 3DGA systems usually require a considerable amount of
preparation time to run the system and to attach multiple markers to the patient. In
addition, gait analysis systems usually require a large space to evaluate ground walking.
Because the many markers have to be tracked by a camera, supervision of the patient by a
stand-by therapist is not practical. In combination, these disadvantages limit the
application of gait analysis using 3DGA systems.
These limitations result from the pursuit of accurate measurements in a research setting.
However, the gait speed of patients with gait disorders is limited, and the focus of
clinical observations is on relatively coarse movements. Consequently, the clinical analysis
of patients with gait disorders may not need the accuracy to appraise the precise high-speed
motions associated with the measurement of sports performance. Therefore, in this study, we
employed a simple 3DGA system with a minimal subset of markers and fewer cameras than is
commonly used. Moreover, this system analyses the gait of subjects on a treadmill, which
enables a stand-by therapist to supervise. Although previous studies have shown that the use
of a treadmill affects gait patterns to some extent,17) it tends to accentuate the gait asymmetry, which makes it
easier to detect a gait disorder.18)
The size of the markers used in this study was 30 mm in diameter. This is larger than those
frequently used. In previous studies, the marker size was shown to correlate with a tendency
toward increased measurement accuracy.19,20) The use of relatively large markers in this system could
potentially contribute to improved measurement accuracy. Although the accuracy of the gait
abnormality evaluations made in the current study must be evaluated further, the significant
differences found between stroke patients and healthy subjects warrants further research to
explore the feasibility of this kind of simplified clinically oriented 3DGA system.
Another problem that prevents the use of 3DGA in clinics is the difficulty of interpreting
the results.6) Usually, gait
disorders are combinations of several movement abnormalities, and understanding such
disorders using the many graphs generated during analysis requires experience. The LOP, as
shown in this study, helps to understand intuitively the holistic patterns of patients’
gaits and promotes a focus on specific problems, as shown in previous studies.10) Moreover, not only measuring the
displacements of individual markers but also developing clinical indices for abnormal gait
patterns may facilitate the understanding of a gait disorder following stroke.21,22)
There are several limitations in this study. The item “toe clearance” in WGS had a
non-significant correlation with toe elevation as measured by the 3DGA system. This weak
correlation could have resulted from the small sample size and the relatively low
reliability of the observational evaluation of toe clearance compared with that of other
parameters, as has been shown in previous studies11,23) In this study, the marker on the fifth metatarsal head was
used as the toe marker, and, as a result, the foot position during the swing phase could
have had some influence on the measurements obtained. The application and potential
limitations of measurement using this method should be further investigated. Nonetheless,
these results, in combination with a simplified 3DGA system and the use of LOPs, may
encourage the practical, everyday use of 3DGA in rehabilitation clinics.
CONCLUSION
Comparisons between the gait patterns of stroke patients and age-, gender-, and
speed-matched controls evaluated using a simplified 3DGA system showed significant
differences between the two groups, indicating the validity of clinical measurements made
using a simplified 3DGA system. The results of the current study support the clinical use of
3DGA for the evaluation of hemiparetic gait and encourage more detailed analysis to validate
the application of 3DGA in clinical settings.
CONFLICTS OF INTEREST
The authors declare that there are no conflicts of interest.
REFERENCES
- 1. Chen G, Patten C, Kothari DH, Zajac FE: Gait
differences between individuals with post-stroke hemiparesis and non-disabled controls at
matched speeds. Gait Posture 2005;22:51–56.
- 2. Stanhope VA, Knarr BA, Reisman DS, Higginson JS:
Frontal plane compensatory strategies associated with self-selected walking speed in
individuals post-stroke. Clin Biomech (Bristol, Avon) 2014;29:518–522.
- 3. Nadeau S, Betschart M, Bethoux F: Gait analysis
for poststroke rehabilitation: the relevance of biomechanical analysis and the impact of
gait speed. Phys Med Rehabil Clin N Am 2013;24:265–276.
- 4. Nadeau S, Duclos C, Bouyer L, Richards CL:
Guiding task-oriented gait training after stroke or spinal cord injury by means of a
biomechanical gait analysis. Prog Brain Res 2011;192:161–180.
- 5. Wikström J, Georgoulas G, Moutsopoulos T,
Seferiadis A: Intelligent data analysis of instrumented gait data in stroke patients – a
systematic review. Comput Biol Med 2014;51:61–72.
- 6. Cimolin V, Galli M. Summary measures for clinical
gait analysis: a literature review. Gait Posture 2014;39:1005–1010.
- 7. Tao W, Liu T, Zheng R, Feng H: Gait analysis
using wearable sensors. Sens Basel 2012;12:2255–2283.
- 8. Carse B, Meadows B, Bowers R, Rowe P: Affordable
clinical gait analysis: an assessment of the marker tracking accuracy of a new low-cost
optical 3D motion analysis system. Physiotherapy 2013;99:347–351.
- 9. Donath L, Faude O, Lichtenstein E, Nüesch C,
Mündermann A: Validity and reliability of a portable gait analysis system for measuring
spatiotemporal gait characteristics: comparison to an instrumented treadmill. J Neuroeng
Rehabil 2016;13:6.
- 10. Ohtsuka K, Saitoh E, Kagaya H, Itoh N, Tanabe S,
Matsuda F, Tanikawa H, Yamada J, Aoki T, Kanada Y: Application of Lissajous overview
picture in treadmill gait analysis. Jpn J Compr Rehabil Sci 2015;6:33–42.
- 11. Rodriquez AA, Black PO, Kile KA, Sherman J,
Stellberg B, McCormick J, Roszkowski J, Swiggum E: Gait training efficacy using a
home-based practice model in chronic hemiplegia. Arch Phys Med Rehabil
1996;77:801–805.
- 12. Tsuji T, Liu M, Sonoda S, Domen K, Chino N: The
stroke impairment assessment set: its internal consistency and predictive validity. Arch
Phys Med Rehabil 2000;81:863–868.
- 13. Goldie PA, Matyas TA, Evans OM: Gait after
stroke: initial deficit and changes in temporal patterns for each gait phase. Arch Phys
Med Rehabil 2001;82:1057–1065.
- 14. Sheffler LR, Chae J: Hemiparetic gait. Phys Med
Rehabil Clin N Am 2015;26:611–623.
- 15. Krebs DE, Edelstein JE, Fishman S: Reliability of
observational kinematic gait analysis. Phys Ther 1985;65:1027–1033.
- 16. Brown CR, Hillman SJ, Richardson AM, Herman JL,
Robb JE: Reliability and validity of the Visual Gait Assessment Scale for children with
hemiplegic cerebral palsy when used by experienced and inexperienced observers. Gait
Posture 2008;27:648–652.
- 17. Harris-Love ML, Forrester LW, Macko RF, Silver
KH, Smith GV: Hemiparetic gait parameters in overground versus treadmill walking.
Neurorehabil Neural Repair 2001;15:105–112.
- 18. Kautz SA, Bowden MG, Clark DJ, Neptune RR:
Comparison of motor control deficits during treadmill and overground walking poststroke.
Neurorehabil Neural Repair 2011;25:756–765.
- 19. Winter DA, Quanbury AO, Hobson DA, Sidwall HG,
Reimer G, Trenholm BG, Steinke T, Shlosser H: Kinematics of normal locomotion - a
statistical study based on T.V. data. J Biomech 1974;7:479–486.
- 20. Windolf M, Götzen N, Morlock M: Systematic
accuracy and precision analysis of video motion capturing systems - exemplified on the
Vicon-460 system. J Biomech 2008;41:2776–2780.
- 21. Itoh N, Kagaya H, Saitoh E, Ohtsuka K, Yamada J,
Tanikawa H, Tanabe S, Itoh N, Aoki T, Kanada Y: Quantitative assessment of circumduction,
hip hiking, and forefoot contact gait using Lissajous figures. Jpn J Compr Rehabil Sci
2012;3:78–84.
- 22. Tanikawa H, Ohtsuka K, Mukaino M, Inagaki K,
Matsuda F, Teranishi T, Kanada Y, Kagaya H, Saitoh E: Quantitative assessment of
retropulsion of the hip, excessive hip external rotation, and excessive lateral shift of
the trunk over the unaffected side in hemiplegia using three-dimensional treadmill gait
analysis. Top Stroke Rehabil 2016; March 23. [Epub ahead of print]
- 23. Lu X, Hu N, Deng S, Li J, Qi S, Bi S: The
reliability, validity and correlation of two observational gait scales assessed by video
tape for Chinese subjects with hemiplegia. J Phys Ther Sci
2015;27:3717–3721.