ABSTRACT
Objective: The aim of the current study was to investigate the association
between the skeletal muscle mass index (SMI) and the convalescent rehabilitation ward
achievement index (CRWAI) in older patients with functional impairment.
Methods: We conducted a retrospective cohort study at a single
rehabilitation center in Japan to include patients admitted to the convalescent
rehabilitation ward because of neurological disease, motor disorder, or disuse syndrome.
Patients with missing SMI data, those who died or were transferred to other hospitals due
to comorbidities, those aged less than 65 years, and those hospitalized for <7 days
were excluded from the study. We divided patients into two groups based on their SMI – the
high SMI group (SMI ≥7.0 kg/m2 in men and SMI ≥5.7 kg/m2 in women)
and the low SMI group (SMI <7.0 kg/m2 in men and SMI
<5.7 kg/m2 in women); we then evaluated the association between SMI and
the CRWAI score.
Results: Of the 319 recruited patients, 84 (26%) were in the high SMI group.
The medians and interquartile ranges of the CRWAI scores in the high SMI and low SMI
groups were 38.6 (23.1–61) and 31.8 (10.1–57.5), respectively (P=0.029). A high SMI was
independently and negatively associated with the CRWAI score (β=− 0.16, P=0.014).
Conclusions: Our study showed that a high SMI was an independent factor
negatively influencing the CRWAI score in older patients in a convalescent rehabilitation
ward.
INTRODUCTION
Loss of muscle mass and reduced muscle strength are the diagnostic features of
sarcopenia.1) Sarcopenia is
an important risk factor for adverse outcomes, such as physical disability, poor quality of
life, and death.1,2) Sarcopenia thereby requires urgent
attention, especially in rehabilitation hospitals where it is present in almost 50% of
patients.3,4) Yoshimura et al. reported that
sarcopenia is associated with worsening of the recovery process for activities of daily
living (ADLs) in hospitalized older adults receiving rehabilitation.3) The latest consensus statement by
the Asian Working Group for Sarcopenia (2019) emphasized that diagnosing sarcopenia requires
the measurement of muscle mass, muscle strength, and gait speed.5) However, it is sometimes not possible to measure
muscle strength and gait speed in patients admitted to rehabilitation wards because of their
physical disabilities.6) In such
cases, it is important to measure the skeletal muscle mass index (SMI), which is one of the
diagnostic criteria for sarcopenia.4)
Evaluating the efficacy of rehabilitation interventions in the convalescent rehabilitation
ward is critical in determining its optimal functioning.7) For this purpose, the convalescent rehabilitation ward
achievement index (CRWAI) was introduced in convalescent rehabilitation in Japan in
2016.7) The CRWAI is
calculated once a month for the entire hospital, and a gain of ≥40 points on the CRWAI
indicates high efficacy of the convalescent rehabilitation process.8) However, to the best of our
knowledge, the association between SMI and CRWAI has not been investigated. Therefore, we
conducted a retrospective analysis to examine the association between the SMI and CRWAI
score, and, secondarily, to evaluate the association between SMI and CRWAI ≥40 in older
patients admitted to the convalescent rehabilitation ward.
MATERIALS AND METHODS
Study Design and Participants
A retrospective cohort study was conducted at the Toyonaka Heisei Hospital, Japan,
between April 1, 2019, and March 31, 2021, involving patients admitted to the convalescent
rehabilitation ward because of neurological disease, motor disorders, or disuse syndrome.
Disuse syndrome is a pathophysiological condition or group of symptoms that occurs after
prescribed or unavoidable inactivity; the syndrome affect various body processes,
including musculoskeletal, circulatory, and respiratory systems, thereby adversely
affecting the performance of ADLs.9) Patients with no SMI data, those who died or were
transferred to other hospitals due to comorbidities, and those aged <65 years of age
were excluded from the study. Additionally, patients hospitalized for <7 days were
excluded because the effects of rehabilitation cannot be determined accurately within such
short periods.
Following the definition of sarcopenia by the Asian Working Group for
Sarcopenia,5) we divided
the patients into two groups: those with a high SMI (SMI ≥7.0 kg/m2 in men and
≥5.7 kg/m2 in women) and those with a low SMI (SMI <7.0 kg/m2
in men and <5.7 kg/m2 in women). We then evaluated the association between
SMI and CRWAI.
The Research Ethics Committee of the Toyonaka Heisei Hospital approved this study in
accordance with the Ethical Guidelines for Medical and Health Research involving Human
Subjects in Japan (No. 202101).10) As per the guidelines, written informed consent was
replaced by the opt-out method.
Convalescent Rehabilitation
The rehabilitation protocols were planned for each patient according to Japan’s medical
insurance system.9) Three
20-min sessions each of physical therapy, occupational therapy, and speech/language
therapy (nine sessions per day) were conducted for patients with neurological
diseases9); three 20-min
sessions each of physical therapy and occupational therapy (six sessions per day) were
implemented for patients with motor disorders9); whereas, patients with disuse syndrome received three
20-min sessions each of physical therapy, occupational therapy, and speech-language
therapy (a total of nine sessions per day).9) The prescribed standard lengths of stay (LOS) in the
convalescent rehabilitation ward for patients with a neurological disease without hyper
brain dysfunction, with a neurological disease with hyper brain dysfunction, with motor
disorder, and with disuse syndrome was 150, 180, 90, and 90 days, respectively.9)
Data Collection
Basic information on all patients, which included age, sex, body mass index (BMI), oral
feeding status at admission, the target disease for convalescent rehabilitation, the
presence of chronic heart failure, the presence of chronic respiratory disease, and the
presence of dementia, along with laboratory findings, were recorded at admission. Oral
feeding was defined as a score of 4–7 on the Functional Oral Intake Scale.11) The target diseases for
convalescent rehabilitation were neurological disease without hyper brain dysfunction,
neurological disease with hyper brain dysfunction, motor disorder, and disuse syndrome.
The presence of chronic heart failure or chronic respiratory disease were ascertained from
the medical records. Dementia was defined as a score of ≤20 points on the Revised
Hasegawa’s Dementia scale or by the prescription of antidementia drugs.9,12,13) Laboratory data included the levels of blood hemoglobin,
creatinine, blood urea nitrogen, serum total protein, and serum albumin. Anemia was
defined as hemoglobin levels <13.0 g/dl in men and <12.0 g/dl in women, as defined
by the World Health Organization.9,14)
Within 48 h of hospitalization, patients’ hand-grip strength, skeletal muscle mass, and
functional independence measure (FIM) scores for motor function (FIM-M) and cognitive
function (FIM-C) were measured. The FIM evaluates a patient’s independence level in
performing ADLs11); the FIM
contains 18 items: 13 items are in the physical domain and 5 items relate to
cognition.11) Based on
the level of independence, each item is scored from 1 to 7, where 1 represents total
dependence and 7 indicates complete independence.11) The total FIM score ranges from 18 to 126, of which the
FIM-M score ranges from 13 to 91 points, and the FIM-C ranges from 5 to 35
points.11) Lower scores
indicate dependency in performing ADLs. Bilateral hand-grip strength was measured using a
digital grip strength meter (Grip-D T.K.K.5401, Takei Kiki Kogyo, Niigata, Japan) with the
patient in a standing or seated position, arms straight by the side; the highest value
from three measurements was recorded.4) For patients with hemiparesis, the hand-grip strength of the
non-paralyzed hand was used.4)
Values of <28 kg for men and <18 kg for women were the thresholds for classifying
the hand-grip strength as low; this is one of the diagnostic criteria for sarcopenia
defined for use in Asia.5)
Skeletal muscle mass was measured using bioelectrical impedance analysis (InBody S10,
InBody, Tokyo, Japan) with subjects in the supine position.4) Skeletal muscle mass was not measured in patients
with an implanted pacemaker and in those who could not remain relaxed during the
measurement. SMI was calculated by dividing the measured appendicular muscle mass by the
square of the height in meters.4) The FIM scores were measured again at discharge to calculate
the final gain in FIM-M during hospitalization.
Outcomes
The primary outcome measures were the CRWAI score of each patient and whether each
patient exceeded 40 points on the CRWAI; the latter is indicative of a highly efficient
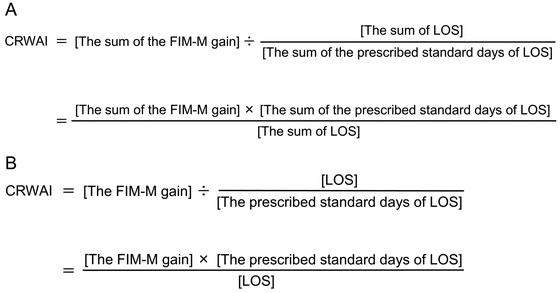
convalescent rehabilitation process.8) CRWAI is calculated by dividing the sum of the FIM-M gains
of all admitted patients at a given time by the sum of the adjusted LOS (which is
calculated by dividing the sum of LOS by the prescribed standard days of LOS, e.g., 150 or
180 days in stroke case and 90 days in patients undergoing surgery for a femur fracture)
(Fig. 1A).6) Although the actual CRWAI is calculated for an entire
hospital, the CRWAI score in this study was calculated for each patient to allow
comparisons between the two groups (Fig.
1B).
Statistical Analysis
We compared the clinical characteristics and outcomes in the high SMI and low SMI groups.
Categorical data are presented as frequencies and percentages, whereas continuous data are
given as means and standard deviations for parametric data or as medians and interquartile
ranges for nonparametric data. The number of missing observed variables is also presented.
We used the chi-squared test for group comparisons of categorical data, and, depending on
the distributions of the data, we used the Student’s t-test or Wilcoxon
rank-sum test for between-group comparisons of continuous data .
Multiple linear regression analysis was used to determine whether SMI was independently
associated with the CRWAI score. To adjust for bias, the following covariates were
selected: age, sex, BMI, hand-grip strength, oral feeding at admission, neurological
disease without hyper brain dysfunction, neurological disease with hyper brain
dysfunction, motor disorder, disuse syndrome, chronic heart failure, chronic respiratory
disease, dementia, baseline hemoglobin level, baseline serum albumin, FIM-M at admission,
and FIM-C at admission. Multicollinearity was evaluated using the Variance Inflation
Factor, where a value of 1–10 indicated the absence of multicollinearity.
We used logistic regression analysis to estimate the effects of outcomes of the high SMI
group relative to the low SMI group. The results were reported as odds ratios (ORs) with
95% confidence intervals (CIs). Clinically relevant variables were adjusted for to
estimate the adjusted OR in the multivariable logistic regression analysis. All the
aforementioned covariates were adjusted for CRWAI exceeding 40 points. To assess the
adjusted OR for each subgroup and the interaction through P values, we constructed the
same multivariable logistic regression analysis for CRWAI ≥40 in the subgroups. The
subgroups of CRWAI ≥40 included age (≥75 or <75 years), sex, BMI (≤18.5 or >18.5
kg/m2), hand-grip strength, oral feeding at admission, neurological disease
without hyper brain dysfunction, neurological disease with hyper brain dysfunction, motor
disorder, disuse syndrome, chronic heart failure, chronic respiratory disease, dementia,
anemia, and baseline serum albumin (≤3.5 or >3.5 g/dl).
All statistical analyses were performed using JMP 15 (SAS Institute, Cary, NC, USA). A
two-sided P value of <0.05 was considered to indicate statistical significance.
RESULTS
Patient Characteristics
We initially registered 445 patients for this study, of which 126 (28%) were excluded
from the final analysis, leaving a study population of 319 cases (Fig. 2) with a mean age of 82 years; 116 (36%) of the 319
participants were men (Table 1).

Table 1.
Patients' characteristics
| Variable |
All patients
(n=319) |
High SMI
(n=84) |
Low SMI
(n=235) |
P value |
| Age, years, mean (SD) |
82 (7) |
80 (7) |
82 (7) |
0.06 |
| Men, n (%) |
116 (36) |
29 (35) |
87 (37) |
0.68 |
| Body mass index, kg/m2, mean (SD) |
20.5 (3.8) |
23.8 (3.8) |
19.3 (2.9) |
<0.0001 |
| Hand-grip strength, kg, median (IQR) * |
|
|
|
|
| Men |
17 (11–22) |
22 (16–26) |
15 (10–21) |
0.0005 |
| Women |
10 (7–15) |
14 (8–18) |
10 (6–13) |
0.0019 |
| Oral feeding at admission, n (%) |
269 (84) |
79 (94) |
190 (81) |
0.0043 |
| The target disease for convalescent rehabilitation, n
(%) |
|
|
|
|
| Neurological disease without HBD |
21 (7) |
10 (12) |
11 (5) |
0.035 |
| Neurological disease with HBD |
98 (31) |
26 (31) |
72 (31) |
| Motor disorder |
102 (32) |
30 (36) |
72 (31) |
| Disuse syndrome |
98 (31) |
18 (21) |
80 (34) |
| Comorbidities, n (%) |
|
|
|
|
| Chronic heart failure |
112 (35) |
22 (26) |
90 (38) |
0.046 |
| Chronic respiratory disease |
20 (6) |
1 (1) |
19 (8) |
0.025 |
| Dementia |
207 (65) |
40 (48) |
167 (71) |
0.0001 |
| Baseline laboratory data |
|
|
|
|
| Hemoglobin, g/dl, mean (SD) |
11.4 (1.7) |
11.8 (1.7) |
11.3 (1.7) |
0.0077 |
| Creatinine, mg/dl, median (IQR) |
0.7 (0.6–1.0) |
0.8 (0.6–0.9) |
0.7 (0.6–1.0) |
0.54 |
| Blood urea nitrogen, mg/dl, median (IQR) |
17.2 (12.8–22.2) |
15.7 (12–19.5) |
17.6 (13.3–23) |
0.01 |
| Total protein, g/dl, median (IQR) |
6.4 (6.1–6.8) |
6.5 (6.1–6.9) |
6.4 (6.1–6.8) |
0.57 |
| Albumin, g/dl, median (IQR) |
3.7 (3.4–4.0) |
3.9 (3.5–4.2) |
3.6 (3.3–3.9) |
0.0004 |
| FIM, median (IQR) |
|
|
|
|
| Total |
49 (30–72) |
67 (44–87) |
45 (28–64) |
<0.0001 |
| Motor items |
29 (16–45) |
45 (23–57) |
25 (15–40) |
<0.0001 |
| Cognitive items |
19 (12–27) |
24 (15–31) |
17 (11–25) |
0.0003 |
HBD, hyper brain dysfunction; IQR, interquartile range; SD, standard deviation.
* Variables with missing data – hand-grip strength: 3 in the high SMI group and 23 in
the low SMI group.
A total of 84 (26%) patients were in the high SMI group; there were no statistically
significant differences between the two groups in terms of age (P=0.06). BMI and hand-grip
strength were significantly higher in the high SMI group than in low SMI (mean BMI,
23.8 kg/m2 vs. 19.3 kg/m2, P <0.0001; median hand-grip
strength, 22 kg vs 15 kg in men, P=0.0005; median, 14 kg vs 10 kg in women, P=0.0019,
respectively). Also, there were statistically significantly differences among the target
diseases between the two groups (P=0.035). Compared with the low SMI group, the high SMI
group had a higher proportion of patients receiving oral feeding at admission (94% vs.
81%, P=0.0043), and was less likely to have chronic heart failure (26% vs. 38%, P=0.046),
chronic respiratory disease (1% vs. 8%, P=0.025), and dementia (48% vs. 71%, P=0.0001).
Baseline hemoglobin and serum albumin levels were significantly higher in the high SMI
group than in the low SMI group (mean 11.8 g/dl vs. 11.3 g/dl, P=0.0077; median 3.9 g/dl
vs. 3.6 g/dl, P=0.0004, respectively). The median FIM and FIM-M scores were significantly
higher in the high SMI group than in the low SMI group at admission (FIM: median 67 vs.
45, P <0.0001; FIM-M: median 45 vs. 25, P <0.0001, respectively; Table 1).
Outcomes
There was no statistically significant difference between gains in FIM and FIM-M scores
between the two groups (for SMI high and low groups, respectively, median FIM gain: 26 vs
23, P=0.29; median FIM-M gain: 22 vs 19, P=0.37). Likewise, the prescribed standard LOS
days and the actual LOS between the high SMI group and low SMI groups were comparable
(median prescribed standard LOS 90 days vs. 90 days, P=0.31; median actual LOS: 64 days
vs. 76 days, P=0.28, respectively). However, the CRWAI score was significantly higher for
the high SMI group (median=38.6 vs. 31.8, P=0.029). In contrast, the proportion of
patients with a CRWAI score ≥40 was not significantly higher in the high SMI group than in
the low SMI group (49% vs. 40%, P=0.18; Table
2).
Table 2.
Comparison of data at discharge between the high SMI and low SMI groups
| Variable |
High SMI
(n=84) |
Low SMI
(n=235) |
P value |
| Gain in FIM, median (IQR) |
|
|
|
| Total |
26 (15–34) |
23 (8–38) |
0.29 |
| Motor items |
22 (13–30) |
19 (6–33) |
0.37 |
| Cognitive items |
1 (0–5) |
1 (0–5) |
0.49 |
| The prescribed standard length of stay, days, median
(IQR) |
90 (90–180) |
90 (90–180) |
0.31 |
| Actual length of stay, days, median (IQR) |
64 (44–88) |
76 (49–90) |
0.28 |
| CRWAI, median (IQR) |
38.6 (23.1–61) |
31.8 (10.1–57.5) |
0.029 |
| CRAWI ≥40, n (%) |
41 (49) |
95 (40) |
0.18 |
There was no multicollinearity between the variables. Multiple linear regression analysis
showed that SMI was independently and negatively associated with the CRWAI score (β=−
0.16, P=0.014). Oral feeding at admission, neurological disease without hyper brain
dysfunction, and neurological disease with hyper brain dysfunction were all independently
and positively associated with the CRWAI score (β=0.13, P=0.037; β=0.14, P=0.023; and
β=0.15, P=0.022, respectively). The adjusted OR (95% CIs) of the high SMI group relative
to the low SMI group for CRWAI ≥40 was 0.55 (0.26–1.16); adjusted OR (95% CIs) values for
men and hand-grip strength for CRWAI ≥40 were 0.47 (0.23–0.94) and 1.08 (1.02–1.15),
respectively (Table 3).
Table 3.
Multivariate analyses for the factors affecting CRWAI
|
CRWAI score |
|
CRWAI ≥40 |
|
β |
P |
VIF |
|
Crude
ORs |
95% CIs |
Adjusted ORs |
95% CIs |
| High SMI |
− 0.16 |
0.014 |
1.59 |
|
1.47 |
0.89−2.43 |
0.55 |
0.26−1.16 |
| Age |
− 0.046 |
0.45 |
1.3 |
|
0.95 |
0.92−0.98 |
0.96 |
0.92−1.004 |
| Men |
− 0.066 |
0.34 |
1.7 |
|
0.86 |
0.54−1.36 |
0.47 |
0.23−0.94 |
| BMI |
0.12 |
0.08 |
1.56 |
|
1.07 |
1.01−1.14 |
1.03 |
0.94−1.12 |
| Hand-grip strength |
0.12 |
0.16 |
2.47 |
|
1.09 |
1.05−1.13 |
1.08 |
1.02−1.15 |
| Oral feeding at admission |
0.13 |
0.037 |
1.36 |
|
2.75 |
1.38−5.49 |
0.76 |
0.31−1.86 |
| Neurological disease without HBD |
0.14 |
0.023 |
1.3 |
|
2.85 |
1.12−7.26 |
3.29 |
0.99−10.92 |
| Neurological disease with HBD |
0.15 |
0.022 |
1.63 |
|
0.61 |
0.37−0.99 |
1.004 |
0.48−2.09 |
| Motor disorder |
0.011 |
0.87 |
1.6 |
|
2.04 |
1.27−3.29 |
1.55 |
0.79−3.04 |
| Disuse syndrome |
Reference |
|
Reference |
Reference |
| Chronic heart failure |
− 0.036 |
0.52 |
1.15 |
|
0.53 |
0.33−0.85 |
0.67 |
0.38−1.19 |
| Chronic respiratory disease |
− 0.012 |
0.83 |
1.1 |
|
0.7 |
0.27−1.8 |
0.68 |
0.22−2.13 |
| Dementia |
− 0.14 |
0.056 |
2.03 |
|
0.3 |
0.19−0.49 |
0.96 |
0.46−2 |
| Hemoglobin |
0.025 |
0.7 |
1.46 |
|
1.11 |
0.98−1.27 |
1.02 |
0.85−1.23 |
| Albumin |
0.067 |
0.35 |
1.87 |
|
3.7 |
2.08−6.57 |
1.37 |
0.6−3.13 |
| FIM-M at admission |
0.13 |
0.14 |
2.56 |
|
1.04 |
1.02−1.05 |
1.01 |
0.98−1.03 |
| FIM-C at admission |
0.04 |
0.66 |
2.96 |
|
1.09 |
1.06−1.12 |
1.04 |
0.99−1.09 |
CI, confidence interval; OR, odds ratio; VIF, variance inflation factor.
Covariates for CRWAI and adjusters for CRWAI ≥40: age, sex, BMI, hand-grip strength,
oral feeding, neurological disease without HBD, neurological disease with HBD, motor
disorder, disuse syndrome, chronic heart failure, chronic respiratory disease,
dementia, baseline hemoglobin level, baseline serum albumin, FIM-M at admission, FIM-C
at admission.
In the subgroup analysis for CRWAI ≥40, the upper boundaries of the 95% CIs were lower
than 1 in the subgroups of patients without dementia and without anemia, and the
interaction P value was significant for dementia (Fig.
3).
DISCUSSION
Our novel investigation revealed an independent and negative association between the SMI
and the CRWAI score, but no significant association between SMI and CRWAI ≥40. This study is
the first to describe the effect of SMI on CRWAI in older patients admitted to a
convalescent rehabilitation ward.
The CRWAI score for the high SMI group was significantly higher than that for the low SMI
group, but high SMI was an independent and negative factor influencing the CRWAI score. A
probable explanation for this seeming contradiction is that patients with high SMI did not
have an advantage over patients with low SMI in terms of improvements in ADLs, a finding
that was inconsistent with previous studies reporting that muscle mass is positively
associated with ADLs of older patients.1,3,4,15) There is a possibility that patients with high SMIs had
negative effects from other factors, such as reduced lower extremity range of motion,
reduced lower limb muscle strength, and lower gait speed, than those with relatively low
SMI; this was not assessed in the current study but has been reported to be correlated with
ADLs.16,17)
In the current study, neurological disease and oral feeding at admission were independently
and positively associated with the CRWAI score. The prescribed standard LOS for patients
with a neurological disease (150 or 180 days) is longer than that for patients with a motor
disorder or disuse syndrome (90 days)9); this fact may have proved advantageous when computing the
CRWAI for patients with a longer prescribed standard LOS. Further, since dysphagia is
reportedly associated with poorer functional recovery in older hospitalized
patients,18) patients on
oral feeding may have had an advantage over those on tube feeding in improvement of
ADLs.
Notably, there was no significant association between SMI and CRWAI ≥40, but male gender
and hand-grip strength were significantly associated with CRWAI ≥40. Previous studies have
reported that there are sex differences in the association between muscle mass and
ADLs19,20) and that appendicular skeletal
muscle mass is higher in men than in women; however, the rate of decrease in appendicular
skeletal muscle mass with age was significantly greater in men than in women.20,21) Consequently, a loss of muscle mass is more likely
to affect functional outcomes in older men than in older women.20) Furthermore, several studies have reported an
association of hand-grip strength with ADLs1,3,4,6,19,22,23,24) that was retained for 1 year after hospital discharge in
longitudinal studies.6)
Therefore, hand-grip strength could be a good predictor of ADLs in patients admitted to
rehabilitation wards.1,3,4,6)
Limitations
This study had several limitations. First, it was conducted at a single rehabilitation
hospital; therefore, generalizing the results of this study should be done with caution.
Future multicenter studies are needed to clarify the effect of SMI on the CRWAI. Second,
we did not examine the interfering effect of various interventions, including
rehabilitation treatment and nutrition therapy. Rehabilitation plays a major role in
improving ADLs, and investigating the content of rehabilitation protocols is warranted in
future research. Finally, there might be unexamined confounding factors in this
retrospective study.
CONCLUSIONS
The current study showed that a high SMI is an independent factor that negatively
influences the CRWAI scores in older patients in a convalescent rehabilitation ward. Further
studies on the effect of SMI on CRWAI are needed to help improve the outcomes of
convalescent rehabilitation.
CONFLICTS OF INTEREST
The authors report no conflicts of interest for this work.
REFERENCES
- 1. Sánchez-Rodríguez D, Marco E, Miralles R, Fayos
M, Mojal S, Alvarado M, Vázquez-Ibar O, Escalada F, Muniesa JM: Sarcopenia, physical
rehabilitation and functional outcomes of patients in a subacute geriatric care unit. Arch
Gerontol Geriatr 2014;59:39–43. PMID:24726179,
DOI:10.1016/j.archger.2014.02.009
- 2. Sánchez-Rodríguez D, Calle A, Contra A, Ronquillo
N, Rodríguez-Marcos A, Vázquez-Ibar O, Colominas M, Inzitari M: Sarcopenia in post-acute
care and rehabilitation of older adults: a review. Eur Geriatr Med 2016;7:224–231.
DOI:10.1016/j.eurger.2015.11.001
- 3. Yoshimura Y, Wakabayashi H, Bise T, Nagano F,
Shimazu S, Shiraishi A, Yamaga M, Koga H: Sarcopenia is associated with worse recovery of
physical function and dysphagia and a lower rate of home discharge in Japanese
hospitalized adults undergoing convalescent rehabilitation. Nutrition 2019;61:111–118.
PMID:30710883, DOI:10.1016/j.nut.2018.11.005
- 4. Ohtsubo T, Nozoe M, Kanai M, Yasumoto I, Ueno K:
Association of sarcopenia and physical activity with functional outcome in older Asian
patients hospitalized for rehabilitation. Aging Clin Exp Res. [published online ahead of
print July 13, 2021]. PMID:34258733, DOI:10.1007/s40520-021-01934-8
- 5. Bai A, Xu W, Sun J, Liu J, Deng X, Wu L, Zou X,
Zuo J, Zou L, Liu Y, Xie H, Zhang X, Fan L, Hu Y: Associations of sarcopenia and its
defining components with cognitive function in community-dwelling oldest old. BMC Geriatr
2021;21:292. PMID:33957882, DOI:10.1186/s12877-021-02190-1
- 6. Lunt E, Ong T, Gordon AL, Greenhaff PL, Gladman
JR: The clinical usefulness of muscle mass and strength measures in older people: a
systematic review. Age Ageing 2021;50:88–95. PMID:32706848,
DOI:10.1093/ageing/afaa123
- 7. Sonoda S: Outcome indicators in comprehensive
inpatient rehabilitation. Jpn J Compr Rehabil Sci. 2017;8:1–3.
- 8. Ministry of Health, Labour and Welfare: Outline
of the revision of medical fees in 2020. [in Japanese]
https://www.mhlw.go.jp/content/12400000/000691039.pdf. Accessed 28 Sep
2021.
- 9. Arai H, Nozoe M, Matsumoto S, Morimoto T:
Exercise training for patients with severe aortic stenosis in a convalescent
rehabilitation ward – a retrospective cohort study . Circ Rep 2021;3:361–367.
PMID:34250276, DOI:10.1253/circrep.CR-21-0035
- 10. Ministry of Health, Labour and Welfare: Ethical
guidelines for medical and health research involving human subjects. [in Japanese]
https://www.mhlw.go.jp/file/06-Seisakujouhou-10600000-Daijinkanboukouseikagakuka/0000080278.pdf.
Accessed 30 Sep 2021.
- 11. Arai H, Takeuchi J, Nozoe M, Fukuoka T, Matsumoto
S, Morimoto T: Association between active gait training for severely disabled patients
with nasogastric tube feeding or gastrostoma and recovery of oral feeding: a retrospective
cohort study. Clin Interv Aging 2020;15:1963–1970. PMID:33116450,
DOI:10.2147/CIA.S270277
- 12. Matsumoto C, Ogawa H, Saito Y, Okada S, Soejima
H, Sakuma M, Masuda I, Nakayama M, Doi N, Jinnouchi H, Waki M, Morimoto T, JPAD Trial
Investigators: . Diabetes Care 2020;43:314–320.
- 13. Saw YM, Than TM, Win EM, Cho SM, Khaing M, Latt
NN, Aung ZZ, Oo N, Aye HN, Kariya T, Yamamoto E, Hamajima N: Myanmar language version of
the Revised Hasegawa’s Dementia Scale. Nagoya J Med Sci 2018;80:435–450.
- 14. Domenica Cappellini M, Motta I: Anemia in
clinical practice – definition and classification: does hemoglobin change with aging?
Semin Hematol 2015;52:261–269. PMID:26404438,
DOI:10.1053/j.seminhematol.2015.07.006
- 15. Nagano F, Yoshimura Y, Bise T, Shimazu S,
Shiraishi A: Muscle mass gain is positively associated with functional recovery in
patients with sarcopenia after stroke. J Stroke Cerebrovasc Dis 2020;29:105017.
PMID:32807432, DOI:10.1016/j.jstrokecerebrovasdis.2020.105017
- 16. Jung H, Yamasaki M: Association of lower
extremity range of motion and muscle strength with physical performance of
community-dwelling older women. J Physiol Anthropol 2016;35:30. PMID:27931244,
DOI:10.1186/s40101-016-0120-8
- 17. Mijnarends DM, Luiking YC, Halfens RJ, Evers SM,
Lenaerts EL, Verlaan S, Wallace M, Schols JM, Meijers JM: Muscle, health and costs: a
glance at their relationship. J Nutr Health Aging 2018;22:766–773. PMID:30080217,
DOI:10.1007/s12603-018-1058-9
- 18. Matsuo H, Yoshimura Y, Ishizaki N, Ueno T:
Dysphagia is associated with functional decline during acute-care hospitalization of older
patients. Geriatr Gerontol Int 2017;17:1610–1616.
- 19. Meskers CG, Reijnierse EM, Numans ST, Kruizinga
RC, Pierik VD, van Ancum JM, Slee-Valentijn M, Scheerman K, Verlaan S, Maier AB:
Association of handgrip strength and muscle mass with dependency in (instrumental)
activities of daily living in hospitalized older adults –The EMPOWER Study. J Nutr Health
Aging 2019;23:232–238. PMID:30820510, DOI:10.1007/s12603-019-1170-5
- 20. Sawada M, Kubota N, Sekine R, Yakabe M, Kojima T,
Umeda-Kameyama Y, Usami S, Akishita M, Ogawa S: Sex-related differences in the effects of
nutritional status and body composition on functional disability in the elderly. PLoS One
2021;16:e0246276. PMID:33529213, DOI:10.1371/journal.pone.0246276
- 21.Gallagher D, Visser M, De Meerrsman RE,
Sepulveda D, Baumgartner RN, Pierson RN. Appendicular skeletal muscle mass: effect of age,
gender, and ethnicity. J Appl Physiol 1985;83:229–239. ,
- 22. Wang DX, Yao J, Zirek Y, Reijnierse EM, Maier AB:
Muscle mass, strength, and physical performance predicting activities of daily living: a
meta‐analysis. J Cachexia Sarcopenia Muscle 2020;11:3–25.
DOI:10.1002/jcsm.12502
- 23. Snih SA, Markides KS, Ottenbacher KJ, Raji MA:
Hand grip strength and incident ADL disability in elderly Mexican Americans over a
seven-year period. Aging Clin Exp Res 2004;16:481–486. PMID:15739601,
DOI:10.1007/BF03327406
- 24. Liu B, Chen X, Li Y, Liu H, Guo S, Yu P: Effect
of passive finger exercises on grip strength and the ability to perform activities of
daily living for older people with dementia: a 12-week randomized controlled trial. Clin
Interv Aging 2018;13:2169–2177. PMID:30464426, DOI:10.2147/CIA.S174756