ABSTRACT
Objectives: In Japan, there is no established method to assess the ability
to read and write in English. To address this problem, we sought to develop a screening
test for the early detection of students who show difficulties in reading and writing in
English.
Methods: The participants were 425 fifth- and sixth-grade elementary school
students and 526 first- through third-grade junior high school students. While setting up
the task items, we focused on the assessment of visual information processing ability
related to letter-symbol information processing. Q1 was a letter identification task, Q2
was a letter recognition task, Q3 was a discrimination task, Q4 was a lexical decision
task, Q5 was a semantic comprehension task, Q6 was a meaningful sentence copy task, and Q7
was a nonsensical sentence copy task. Q1 to Q5 assessed reading ability and Q6 and Q7
assessed writing ability.
Results: The comparison of basic distribution between elementary and junior
high school showed that there were differences in the distribution of both reading and
writing scores between the two school types (P<0.05). At the cut-off value of −1.5 SD,
7.8% of the students were extracted for reading scores and 4.2%–5.5% for writing
scores.
Conclusions: The extraction rate of students using this screening test
supports the results of previously published studies. Thus, this screening test is
considered suitable for identifying elementary and junior high school students who face
difficulties in reading and writing in English.
INTRODUCTION
Reading and writing difficulties are classified as specific learning disorders in the
Diagnostic and Statistical Manual of Mental Disorders, 5th edition (DSM-5).1) The diagnostic criteria for reading
difficulties include reading inaccuracy, nonfluency, and difficulty in reading
comprehension. Writing difficulties include spelling, grammar, punctuation inaccuracy, and
organization of written expression for writing difficulties. Reading difficulties are
diagnosed as dyslexia when reading achievement is 1.5 SD below the grade-level equivalent
and is seen in about 7% of the population.2,3,4) In recent years, the incidence of dyslexia has been reported
to range from 4% to 20%.5) The
incidence of writing disorders is reported to be 7%–15%.6)
It has been pointed out that reading and writing skills are directly related to native and
second-language skills, and that difficulties in language skill acquisition in the native
language also indicate weaknesses in second-language acquisition.7) Furthermore, English, which is a major
foreign-language subject in Japan, is said to cause more difficulties in reading and writing
acquisition than Japanese language because of the complexity of the correspondence between
graphemes and phonemes.8) Based
on these findings, it can be assumed that children who show weaknesses in reading and
writing in Japanese may also show similar difficulties in learning English. Even children
who do not show weaknesses in learning Japanese may stumble for the first time when learning
English. It is important to predict and manage reading and writing difficulties at an early
stage, before they show any delay in learning, to effectively help these children. However,
in Japan, screening tests have not yet been established to accurately identify children who
show difficulties in reading and writing in English.
With full implementation of the Plan for the Reform of English Language Education in
Response to Globalization from the fiscal year 2020, the introduction of English as a
subject at the elementary school level and the expansion of English learning content at the
secondary school level are being promoted in Japan. In the Japanese educational curriculum,
students begin to listen to and speak English from the third grade of elementary school, and
English language studies begin in the fifth grade. The target for students is to acquire
about 600 to 700 words at the elementary school level and about 1600 to 1800 words at the
junior high school level. We are attempting to develop a screening test for the early
identification of children with difficulties in reading and writing in English. As a first
report, we discuss the issues involved around constructing a screening test. We also report
the basic distribution of indicators based on the results of a preliminary survey and
discuss the calculations to examine if there is a risk cut-off value and extraction rate
that may be used for such screening tools.
METHODS
Participants
The survey was conducted at eight public elementary and junior high schools in Kochi
Prefecture (five elementary schools and three junior high schools), where the Board of
Education and the school principals agreed to cooperate in the survey. In each school, the
survey targets were fifth graders in elementary schools to third graders in junior high
schools enrolled in regular classes. We had a total of 951 survey participants, consisting
of 425 elementary school students and 526 junior high school students. The socio-economic
status of each student was not investigated in this study. The surveyed schools were
aligned with the general English education system in Japan.
Compositional Tasks
It is critical to clarify the process of linguistic information processing that Japanese
students go through when reading and writing in English and to identify the instances
where they face challenges. In English-speaking countries, phonological processing is the
most widely known factor behind dyslexia; however, in Japan, where the language system is
different from that of English-speaking countries, morphological processing has also been
highlighted.9,10) In the present study, we relied
on a cognitive neuropsychological model and structured the tasks around assessment of
visual information processing abilities related to reading and writing that could be
conducted in groups.11)
The tasks were designed using the Psycholinguistic Assessments of Language Processing in
Aphasia (PALPA),12) the
Woodcock Reading Mastery Tests 3rd Edition (WRMT-III),13) and the Gray Diagnostic Reading Tests 2nd Edition
(GDRT-2),14) which are
widely used in English-speaking countries. Additionally, based on the results of the
Research on English Education in Elementary Schools (National Institute for Japanese
Language Education Policy, 2008),15) the required basic words in textbooks used by students
whose native language is Japanese were used. Figure
1 shows the task contents, examples, and evaluation items.
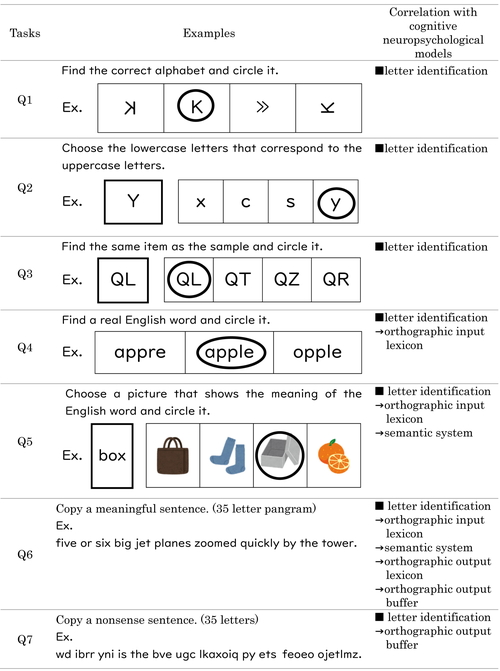
Q1. Letter identification task (upper case): 10 questions. A choice of the correct letter
from a group of symbols. While focusing on the letters used in PALPA’s Mirror Reversal
task, we used uppercase letters that elementary school students are likely to make
mistakes in identifying, as reported in the National Institute for Educational Policy
Research’s “Research on English Education in Elementary Schools.” Time limit 1 minute.
Q2. Letter recognition task (lower case): 10 questions. This was a selection task to
choose the uppercase letter of a sample stimulus and the corresponding lowercase letter.
The alphabet from PALPA’s Letter Matching task was used to assess letter identification
and letter knowledge. Time limit 1 minute.
Q3. Discrimination task: 10 questions. This was a selection task to identify and choose a
given alphabet string from a group of non-real words. We used the words used in PALPA’s
Visual Lexical Decision task, letters in words and non-words tasks, and WRMT-III’s Word
Attack task to assess morphological awareness and visual short-term memory. Time limit 2
minutes.
Q4. Lexical decision task: 10 questions. A selection task to find and select real words
from a group of stimuli containing both real and non-real words. This task assessed the
ability of students to use lexicons and lexical judgment. Only English words learned in
English textbooks at elementary school were used. There were four options: (1) the real
word, (2) a word phonetically similar to the real word, (3) similar spelling to the real
word, and (4) one letter replaced by another. Time limit 2 minutes.
Q5. Semantic comprehension task: 10 questions. For each English word presented, students
were asked to choose an illustration that indicated the correct meaning. Students were
assessed on their semantic knowledge and other abilities. Only English words learned in
English textbooks at elementary school were used. There were four options: (1) the correct
illustration corresponding to the sample word, (2) an illustration showing the meaning of
a word that is phonetically similar to the sample word, (3) an illustration showing a word
that is semantically related to the sample word, or (4) an unrelated illustration. Time
limit 2 minutes.
Q6. Visual copying task (meaningful sentences): A writing task in which participants had
to quickly and accurately copy the presented meaningful sentences repeatedly within the
time limit. A 35-letter pangram (a sentence using all 26 letters of the alphabet) was used
for this task. Time limit 2 minutes.
Q7. Visual copying task (nonsensical sentences): A writing task to quickly and accurately
transcribe the presented nonsensical sentences. A 35-character nonsensical sentence, which
was reconstructed by decomposing the pangram used in Q6, was used as the task sentence to
be copied repeatedly within the time limit. These two tasks (Q6 and Q7) assessed the
cooperation between vision, movement, and the ability to pay attention and concentrate.
Time limit 2 minutes.
Procedures
The survey was conducted between December 2020 and February 2021. It was conducted by
classroom teachers or subject teachers in each elementary and junior high school in a
group format in a classroom environment. The survey forms were A4-size booklets, one for
each student. The teacher read out the instructions according to the implementation guide
distributed in advance and proceeded with the tasks. The time required from distribution
to collection of the survey forms was approximately 20 minutes.
Analysis
Q1 to Q5 mainly assessed basic reading skills, while Q6 and Q7 mainly assessed basic
writing skills. For Q1 to Q5, the number of correct answers was scored (10 points each),
and the total of these was considered the “reading score” (50 points). For Q6 and Q7, the
average number of letters per minute was calculated from the number of letters that could
be transcribed correctly within the time limit, and the average was then further averaged
and considered the “writing score.” The Mann–Whitney U test was used to compare scores
between elementary and junior high schools, and Spearman’s correlation analysis was used
for correlations between items. Furthermore, the Wilcoxon signed rank test was used to
compare scores between Q6 and Q7, and Spearman’s correlation analysis was used to
correlate Q6 and Q7. For the cut-off values, several standard deviations and percentile
values were used in the analysis to find more appropriate values for English learners
whose native language was Japanese. The seven criteria were −1 SD, −1.5 SD, −2 SD, 5th
percentile, 7th percentile, 10th percentile, and 15th percentile. All analyses were
conducted using IBM SPSS Statistics ver. 26, and the level of statistical significance was
at P<0.05.
Ethical Considerations
This study was conducted with the approval of the Research Ethics Review Committee,
School of Allied Health Sciences, Kitasato University (No. 2020–004). We obtained written
informed consent from the schools’ principals and teachers after explaining the scope of
the survey. Prior to conducting the study, an explanatory document was distributed to
parents. If they did not wish to participate in the study, they were asked to notify us,
and the participation of the children in question was canceled accordingly. The document
clearly stated that each student’s school record would not be affected in any way
regardless of participation in the study. The teacher in-charge explained the intention of
the survey to the target students and informed them that their response to the survey
would be regarded as consent and that there would be no disadvantage if they did not
participate.
RESULTS
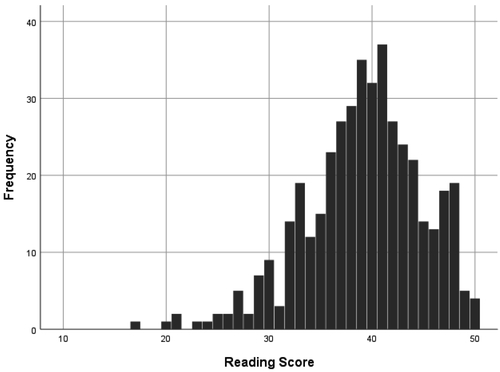
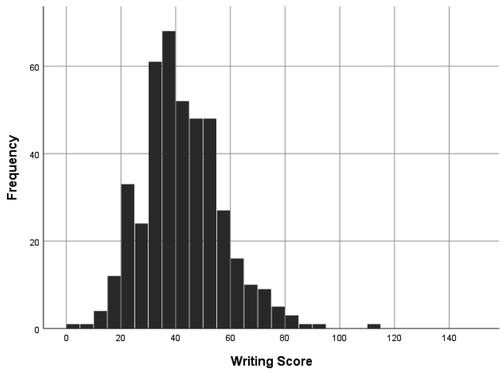
The descriptive statistics of the scores of elementary school children are shown in Table 1. The basic distribution of the reading
scores is shown in Fig. 2 and that of the writing
scores is shown in Fig. 3 The scores for Q7 were
significantly higher than those for Q6 (Z=6.13, P<0.05). In addition, there was a strong
correlation between Q6 and Q7 (ρ=0.838, P<0.05).
Table 1.
Descriptive statistics of scores for elementary school students
|
Q1 |
Q2 |
Q3 |
Q4 |
Q5 |
Q6 |
Q7 |
Reading score |
Writing score |
| Mean |
9.7 |
9 |
9.1 |
4.8 |
6.6 |
82.2 |
86.4 |
39.2 |
42.2 |
| SD |
0.8 |
1.5 |
1.1 |
2.3 |
2.5 |
32.9 |
29.5 |
5.7 |
14.9 |
| Median |
10 |
10 |
9 |
5 |
7 |
78 |
86 |
40 |
40.5 |
| Range |
0–10 |
0–10 |
3–10 |
0–10 |
0–10 |
3–280 |
0–191 |
17–50 |
0.8–113.8 |
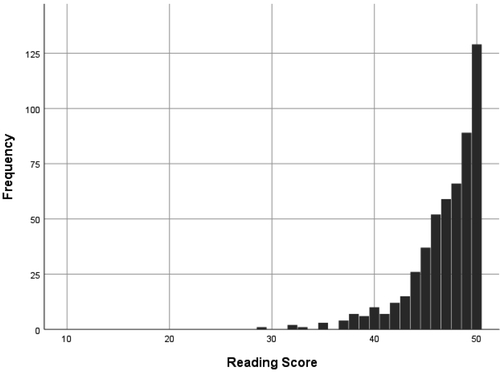
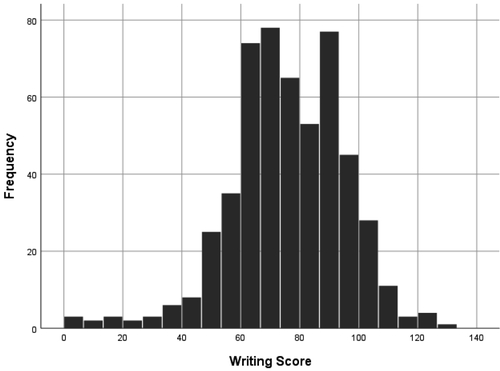
The descriptive statistics of the scores of junior high school students are shown in Table 2. The basic distribution of the reading
scores is shown in Fig. 4 and that of the writing
scores is shown in Fig. 5 The Q6 score was
significantly higher than the Q7 score (Z=−16.09, P<0.05). In addition, there was a
strong correlation between Q6 and Q7 (ρ=0.746, P<0.05).
Table 2.
Descriptive statistics of scores for junior high school students
|
Q1 |
Q2 |
Q3 |
Q4 |
Q5 |
Q6 |
Q7 |
Reading score |
Writing score |
| Mean |
9.9 |
9.9 |
9.5 |
8.5 |
9.1 |
164.2 |
139.4 |
46.9 |
75.9 |
| SD |
0.7 |
0.6 |
0.8 |
1.9 |
1.2 |
45.3 |
36.2 |
3.4 |
19.2 |
| Median |
10 |
10 |
10 |
9 |
9 |
165 |
140 |
48 |
76 |
| Range |
0–10 |
1–10 |
6–10 |
0–10 |
2–10 |
0–315 |
0–249 |
29–50 |
0–132.3 |
When the basic distributions were compared between elementary and junior high schools,
significant differences in distributions were observed between the school types for both
reading and writing scores, with higher scores in junior high schools than in elementary
schools (Z=20.69, P<0.05; Z=22.25, P<0.05; respectively). Therefore, it was decided to
set a cut-off value for each school type. Table
3 shows the candidate cut-off values for elementary schools and the percentage of
children identified, and Table 4 shows the
candidate cut-off values for junior high schools and the percentage of students identified,
calculated based on the set criteria.
Table 3.
Percentage of elementary school children identified by candidate cut-off
values
| Criteria |
Q1 to Q5 Reading score |
|
Q6 and Q7 Writing score |
| Cut-off value |
Percentage |
|
Cut-off value |
Percentage |
| −2 SD |
27 |
3.5% |
|
12 |
1% |
| −1.5 SD |
30 |
7.8% |
|
19 |
4.2% |
| −1 SD |
33 |
16.2% |
|
27 |
15.1% |
| 5% |
29 |
5.6% |
|
20 |
4.5% |
| 7% |
30 |
7.8% |
|
21 |
6.6% |
| 10% |
32 |
11.8% |
|
23 |
9.2% |
| 15% |
33 |
16.2% |
|
27 |
15.1% |
Table 4.
Percentage of junior high school students identified by candidate cut-off
values
| Criteria |
Q1 to Q5 Reading score |
|
Q6 and Q7 Writing score |
| Cut-off value |
Percentage |
|
Cut-off value |
Percentage |
| −2 SD |
40 |
6.5% |
|
37 |
2.9% |
| −1.5 SD |
41 |
7.8% |
|
47 |
5.5% |
| −1 SD |
44 |
17.9% |
|
56 |
12% |
| 5% |
40 |
6.5% |
|
45 |
4.8% |
| 7% |
41 |
7.8% |
|
49 |
6.8% |
| 10% |
42 |
10.1% |
|
53 |
9.3% |
| 15% |
44 |
17.9% |
|
59 |
14.8% |
DISCUSSION
This study developed a screening test to identify Japanese school students that have
difficulty in reading and writing in English. Such an assessment tool has not been
previously established in Japan. The study also presented a cut-off value and extraction
rate from the test.
The screening test relied on the theory of cognitive neuropsychological models. In the
assessment of reading ability, Q1 to Q3 evaluated the ability of letter identification and
morphological recognition, Q4 evaluated the understanding of orthographic input lexicon, and
Q5 evaluated semantic knowledge. In the assessment of writing ability, Q6 evaluated the
ability to write letters through semantic knowledge and Q7 evaluated the ability to write
letters without semantic knowledge. In other words, all the items were structured in
accordance with the order of the letter-symbol information processing system, from reading
to writing.
For the assessment of reading ability, the total score of all five questions (Q1 to Q5) was
considered representative score to evaluate the basic ability to read, based on character
identification to the meaning system of the cognitive neurological model. The results showed
significant differences among school types, with junior high school students scoring higher
than elementary school students. This suggests that the basic skills related to reading
develop or become more proficient as the grade advances. In particular, there was a large
difference in the scores of Q4 and Q5. However, given that these were questions about
distinguishing real words from non-real words (Q4) and about the meaning of real words (Q5),
it is assumed that proficiency in the orthographic input lexicon and the semantic system
stage played a large role in this difference. By analyzing each task in detail, it is
possible to evaluate the stage of the reading process at which the students show
difficulty.
For the assessment of individuals’ writing ability, the average number of letters written
per minute in Q6 and Q7 was calculated as the writing score. Kono et al.16) reported that the results of a
Japanese writing task administered to elementary school students showed that the number of
written letters was significantly higher for all grades when compared with previous grades
(e.g., more for sixth graders than for fifth graders), and that the number of written
letters was higher in the meaningful sentence task than in the nonsensical sentence task. In
our study, junior high school students also wrote significantly more, suggesting that
developmental differences in writing speed also occurred in the English visual copying task.
In addition, the scoring patterns differed among school types, with elementary school
students scoring higher on the nonsensical sentence task than on the meaningful sentence
task. In contrast, junior high school students scored higher on the meaningful sentence task
than on the nonsensical sentence task. This could have been caused by their decision to use
the semantic system to efficiently memorize and write sentences and words. At the elementary
school stage, when the students were not proficient in learning English, both the meaningful
and nonsensical sentence tasks went through a nonlexical route that did not involve the
semantic system. In addition, the meaningful sentence task was performed first, which may
have increased the efficiency of the nonsensical sentence task because of the effect of
order. In contrast, in the junior high school stage, where students are more proficient in
learning English, the meaningful sentence task was conducted via the lexical route through
the semantic system, which may have enabled them to transcribe more efficiently. There was a
strong correlation between Q6 and Q7 in both elementary and junior high schools. In the
future, we would consider omitting one of the questions and administering only one task.
In this study, seven values were established as candidate cut-off values. Based on these
candidate values, 1%–16% of children were identified. We examined which of these values were
appropriate as a cut-off value. Dyslexia is diagnosed when reading achievement is 1.5 SD
below grade level, which is seen in approximately 7% of the population.2,3,4) In Japanese literacy screening tests, such as the Standardized
Test for Assessing the Reading and Writing (Spelling) Attainment of Japanese Children and
Adolescents: Accuracy and Fluency (STRAW-R),17) a score that falls 1.5 SD below the grade level is considered
a possible abnormality and a score that falls 2 SD below is considered a clearly abnormal
value. In the results of the present study, using the 7th percentile as the cut-off value of
reading scores identified 7%–8% of the students as the risk group, and the same was true at
the reading score cut-off value of −1.5 SD. These extraction rates were consistent with
previous studies. In contrast, using the 7th percentile as the cut-off value for writing
scores identified 6%–7% of students, whereas −1.5 SD identified 4%–6% of students and was
consistent with a previous study.17) Literature values for the incidence of writing disorder are
7%–15%, but using these cut-off values, a lower percentage was obtained. There are several
possible reasons for this, and one of them is the difference in the abilities assessed. In
general, writing disorder includes spelling, grammar, and punctuation accuracy along with
spelling representation and organization skills. The writing task in this study focused on
basic visual skills and did not include grammatical or sentence structure skills. It is
possible that this was reflected in the results. However, given that it is considered
desirable to assess more basic skills for early screening, this selection rate is
appropriate at this point. From the above, we believe that it is appropriate to use the 7th
percentile or −1.5 SD as a cut-off value for both reading and writing scores.
In this Japanese study, we developed a screening test to identify students who show
difficulties in reading and writing in English and presented data on the cut-off values
based on the basic distribution. Such a test has not been established to date in Japan.
However, this was a preliminary study, and further investigation of the task structure and
extraction rate is needed. In addition, this screening test was designed to be an assessment
tool that can be implemented as part of a regular class, focusing on the assessment of
visual cognitive functions related to letter-symbol information processing (reading and
writing). However, given that phonological awareness has also been pointed out to be
involved in dyslexia,18) it is
necessary to assess phonological awareness and the decoding ability of children to
comprehensively understand students who face difficulties in reading and writing. In
addition, there are many students who have difficulties in reading and writing in English
even if they do not have a special functional background. It is important to clarify the
cognitive background of students who face difficulties in reading and writing in English
from various perspectives to quickly provide instructions that address the difficulties of
each individual student. In the next and subsequent surveys, the target area and target
students should be expanded, the reliability of the task should be tested, and the validity
of this screening test should be verified. In addition, comparisons should be made not only
between school types but also between grades to identify differences in development or
proficiency between grades. A careful analysis of cut-off values would also be necessary. We
will continue to assess the feasibility of identifying students who truly show difficulties
in learning English.
CONFLICTS OF INTEREST
The authors have no conflicts of interest to disclose.
REFERENCES
- 1. DSM-5 American Psychiatric Association:
Diagnostic and statistical manual of mental disorders, 5th ed. Arlington, American
Psychiatric Publishing; 2013.
- 2. Shaywitz SE, Shaywitz BA, Fletcher JM, Escobar
MD: Prevalence of reading disability in boys and girls. Results of the Connecticut
Longitudinal Study. JAMA 1990;264:998–1002. PMID:2376893,
DOI:10.1001/jama.1990.03450080084036
- 3. Peterson RL, Pennington BF: Developmental
dyslexia. Lancet 2012;379:1997–2007. PMID:22513218,
DOI:10.1016/S0140-6736(12)60198-6
- 4. Hulme C, Snowling MJ: Reading disorders and
dyslexia. Curr Opin Pediatr 2016;28:731–735. PMID:27496059,
DOI:10.1097/MOP.0000000000000411
- 5. Shaywitz S, Shaywitz J: Overcoming dyslexia, 2nd ed.
New York, Alfred A. Knopf; 2021.
- 6. Katusic SK, Colligan RC, Weaver AL, Barbaresi WJ:
The forgotten learning disability: epidemiology of written-language disorder in a
population-based birth cohort (1976–1982), Rochester, Minnesota. Pediatrics
2009;123:1306–1313. PMID:19403496, DOI:10.1542/peds.2008-2098
- 7. Sparks RL, Patton J, Ganschow L: Profiles of more
and less successful L2 learners: a cluster analysis study. Learn Individ Differ
2012;22:463–472. DOI:10.1016/j.lindif.2012.03.009
- 8. Wydell TN, Butterworth B: A case study of an
English–Japanese bilingual with monolingual dyslexia. Cognition 1999;70:273–305.
PMID:10384738, DOI:10.1016/S0010-0277(99)00016-5
- 9. Uno A, Haruhara N, Kaneko M, Awaya N: Cognitive
dysfunction in developmental dyslexia [in Japanese]. Jpn J Logop
2007;48:105–111.
- 10. Goto T, Uno A, Haruhara N, Kaneko M, Awaya N,
Kozoka J, Katano S: Visual function, visual perception and visual recognition in Japanese
children with developmental dyslexia [in Japanese]. Jpn J Logop
2010;51:38–53.
- 11. Kay J, Lesser R, Coltheart M: Psycholinguistic
assessments of language processing in aphasia (PALPA): an introduction. Aphasiology
1996;10:159–180. DOI:10.1080/02687039608248403
- 12. Kay J, Lesser R, Coltheart M: PALPA;
Psycholinguistic Assessments of Language Processing in Aphasia. Hove, Lawrence Erlbaum
Associates; 1992.
- 13. Woodcock RW: Woodcock Reading Mastery Tests, 3rd ed.
(WRMT-III). Pearson; 2011.
- 14. Bryant BR, Wiederholt JL, Bryant DP: GDRT-2; Gray
Diagnostic Reading Tests, 2nd ed. Pro-ed; 2004.
- 15. National Institute for Japanese Language
Education Policy: Research on English education in elementary schools report [in
Japanese]. https://www.nier.go.jp/shoei_h20/shoei.html. Accessed 30 May
2022.
- 16. Kono T, Hirabayashi R, Nakamura K: Handwriting
speed of primary school students in Japan [in Japanese]. Jpn J Spec Educ 2008;46:223–230.
DOI:10.6033/tokkyou.46.223
- 17. Uno A, Haruhara N, Kaneko M, Wydell TN: Standardized
test for assessing the reading and writing (spelling) attainment of Japanese children and
adolescents: accuracy and fluency (STRAW-R) [in Japanese]. Interuna;
2017.
- 18. Hara K: Problems and support for developmental
dyslexia in native Japanese speaking children [in Japanese]. J Study Jpn Lang Educ Pract
2017;4:3–15.