Outcome Prediction by Combining Corticospinal Tract Lesion Load with Diffusion-tensor Fractional Anisotropy in Patients after Hemorrhagic Stroke
2024 Volume 9 Article ID: 20240001
Details
2024 Volume 9 Article ID: 20240001
Objectives: The objective of this study was to evaluate the predictive precision of combining the corticospinal tract lesion load (CST-LL) with the diffusion-tensor fractional anisotropy of the corticospinal tract (CST-FA) in the lesioned hemispheres regarding motor outcomes.
Methods: Patients with putaminal and/or thalamic hemorrhage who had undergone computed tomography (CT) soon after onset in our hospital were retrospectively enrolled. The CST-LL was calculated after registration of the CT images to a standard brain. Diffusion-tensor imaging was performed during the second week after onset. Standardized automated tractography was employed to calculate the CST-FA. Outcomes were assessed at discharge from our affiliated rehabilitation facility using total scores of the motor component of the Stroke Impairment Assessment Set (SIAS-motor total; null to full, 0 to 25). Multivariate regression analysis was performed with CST-LL and CST-FA as explanatory variables and SIAS-motor total as a target value.
Results: Twenty-five patients participated in this study. SIAS-motor total ranged from 0 to 25 (median, 17). CST-LL ranged from 0.298 to 7.595 (median, 2.522) mL, and the lesion-side CST-FA ranged from 0.211 to 0.530 (median, 0.409). Analysis revealed that both explanatory variables were detected as statistically significant contributory factors. The estimated t values indicated that the contributions of these two variables were almost equal. The obtained regression model accounted for 63.9% of the variability of the target value.
Conclusions: Incorporation of the CST-LL with the lesion-side CST-FA enhances the precision of the stroke outcome prediction model.
Outcome prediction is critically important when scheduling appropriate rehabilitative treatment for patients after stroke.1) It is well known that assessment of the neural integrity of the corticospinal tract (CST) is essential for the prediction of functional outcome in patients after stroke.2) Recent reviews discussed two typical neuroimaging methodologies for assessment of the neural integrity of the CST3,4); one is conventional structural imaging such as computed tomography (CT) and the other is magnetic resonance diffusion-tensor imaging (DTI).
The clinical utility of assessing CST integrity using conventional structural imaging has been investigated in several studies.5,6,7,8,9) Using magnetic resonance images collected from stroke patients in the chronic phase, Zhu et al.10) first revealed that the volumes of overlapping portions of the lesion and the CST (CST lesion load, CST-LL) correlated with upper extremity functions. To enhance clinical utility during the acute phase, Feng et al.5) collected data from patients treated in acute care and conducted analyses similar to those of Zhu et al.10) These studies demonstrated that CST-LL moderately correlated with impairment levels of extremity functions. In general, patients with a CST-LL greater than 2.0 mL tended to suffer from severe hemiparesis.
DTI is a unique technique for evaluating neural fibers.11,12) Numerous studies have highlighted the potential of DTI tractography in the assessment of hemiparesis.3) Among various parameter estimates derived from DTI tractography, fractional anisotropy (FA), which is considered to index Wallerian degeneration, is often used to evaluate neural integrity of the CST. However, the vast majority of existing DTI studies have utilized labor-intensive, manually defined tractography with lower reproducibility. It is partly because of this inefficient process that the widespread integration of DTI tractography in real-world clinical settings has been limited. Recently, an automated tractography known as XTRACT13) has been developed, employing standardized protocols to automatically extract neural tracts. Our previous studies using XTRACT indicated that lesion-side CST-FA correlated with the levels of extremity functions.14,15) In general, patients with a CST-FA lower than 0.40 were associated with severe hemiparesis.14)
Some studies have used CST-LL9) or CST-FA3) for the prediction of outcome in stroke patients. Nevertheless, only a few studies have explored the clinical applicability of integrating these two neuroimaging techniques. In this study, our objective was to evaluate, through multivariate regression analysis, the clinical usefulness of combining CST-LL and CST-FA in the hemisphere affected by the lesion.
This retrospective study sampled patients who were diagnosed as having hemorrhagic stroke and were admitted to Nishinomiya Kyoritsu Neurosurgical Hospital during the period spanning April 2021 to March 2023. Typically, patients were transferred to our hospital soon after the onset of stroke and received conservative treatment, which involved the administration of antihypertensive medications. Surgical hematoma removal was performed when necessary. In addition, patients underwent rehabilitative therapy, including physical therapy, occupational therapy, and speech therapy, with a combined daily duration of up to 180 min, in accordance with the 2021 revisions to the Japanese Guidelines for Stroke Management.16)
To minimize potential variations stemming from disparities in pre-stroke health status and lesion location, the study population was restricted to patients experiencing their first stroke, specifically those with thalamic and/or putaminal hemorrhage, who had demonstrated the ability to walk unassisted and were functionally independent in their activities of daily living (ADL) before the stroke.17,18,19,20,21) Patients with a history of previous neurological diseases, such as Parkinson’s disease or Alzheimer’s disease, were excluded from the study. Additionally, patients who experienced a subsequent deterioration in consciousness or had other severe comorbid conditions were also excluded. To standardize the rehabilitative procedures, the study exclusively incorporated data from patients who were transferred to our affiliated long-term rehabilitation facility at Nishinomiya Kyoritsu Rehabilitation Hospital. The research protocol received approval from the Ethics Committee of Hyogo Medical University (approval number 4453). Informed consent was acquired by the opt-out method via the hospital website.
CT Acquisition and Image ProcessingThe details of CT acquisition and its image processing were published in our previous report.7) In brief, patients presenting with suspected stroke underwent head CT scans upon arrival at our hospital. These scans were conducted using a 320-row-detector CT scanner (Aquilion ONE, Cannon Medical Systems Corporation, Tochigi, Japan). The CT images were acquired in a helical manner using a standard imaging protocol. The specific imaging parameters used were 120 kVp and 300 mAs, resulting in an in-plane resolution of 0.43 × 0.43 mm (512 × 512 matrix). The slice thickness for each image was set at 5 mm.
Subsequent analyses were carried out using the FMRIB Software Library (FSL) brain image analysis package, version 6.0.6.22) The CT images underwent processing involving the thresholding of Hounsfield units (HU) within the range of 0–100, and the resulting CT data were spatially normalized with reference to a previously established standard CT template.23) For each patient, the spatial normalization was visually inspected, and rectangular-shaped volumes of interest (VOI) that encompassed the hematoma’s edge in the right-to-left (x), posterior-to-anterior (y), and bottom-to-top (z) dimensions were defined.7) Voxels within the VOI that exhibited HU values exceeding 50% were extracted and binarized to create a lesion mask.7) The left and right CST were delineated from a standard brain mapping template (JHU-ICBM-tracts-maxprob-thr0-1mm.nii.gz, integrated into the FSL suite) and were then projected onto the CT data registered in the standard space (Fig. 1). Voxels displaying an overlap between the CST and the lesion mask were isolated, representing the CST-LL.5,10,24) The volume (in milliliters) of these CST-LL voxels was calculated for each patient (Fig. 1).
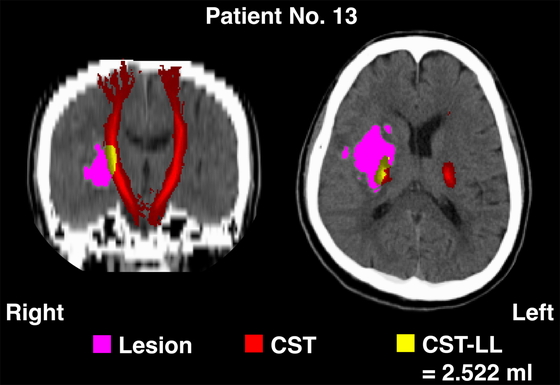
An example of computed tomography brain images after spatial transformation into the standard brain (patient 13 in Table 1).
The details of DTI acquisition and its image processing were published in our previous reports.14,15,25) In brief, the DTI scans were typically conducted during the second week after admission to our acute care service. These scans were performed using a 3.0-Tesla scanner (MAGNETOM Trio, Siemens, Erlangen, Germany), which was equipped with a 32-channel head coil. To acquire DTI data, a single-shot echo-planar imaging sequence was utilized in the anterior-to-posterior direction. This sequence included 30 images with non-collinear diffusion gradients (b = 1500 s/mm2) and one non-diffusion-weighted image (b = 0 s/mm2). For each patient, a total of 80 contiguous axial slices were obtained. These slices had a field of view measuring 256 × 256 mm, an acquisition matrix of 128 × 128, and a slice thickness of 2 mm. The imaging parameters included an echo time of 96 ms, a repetition time of 10,900 ms, and a flip angle of 90°. To correct for distortions caused by eddy currents and echo-planar imaging, two additional non-diffusion-weighted images were acquired in the anterior-to-posterior direction, along with two more in the posterior-to-anterior direction. In addition, to capture anatomical details of the patients’ brains, T1-weighted images were obtained using a three-dimensional fast gradient imaging sequence. For each patient, a total of 176 contiguous sagittal slices were acquired, with a field of view of 256 × 256 mm, an acquisition matrix of 256 × 256, and a slice thickness of 1 mm. The imaging parameters for the T1-weighted images included an echo time of 2.52 ms, a repetition time of 1900 ms, and a flip angle of 10°.
The image processing pipeline for the DTI scans involved the use of the MRtrix26) and the FSL22) software packages. For the first step, the Gibbs ringing artifact was eliminated, and corrections for distortions induced by eddy currents and echo-planar imaging were then performed. Bias field corrections were then conducted. Brain masks were generated from the bias field-corrected images. After the preparation stage, fiber tracking was performed using the XTRACT function implemented in the FSL.13) This allowed the construction of tractography for predetermined neural bundles, with a focus on the right and left CST (Fig. 2). In this step, spatial transformations of the seed and target masks were visually inspected for their appropriateness. Parameter estimates including FA values were extracted using a threshold set at 0.01, in accordance with our previous studies.14,15,25)
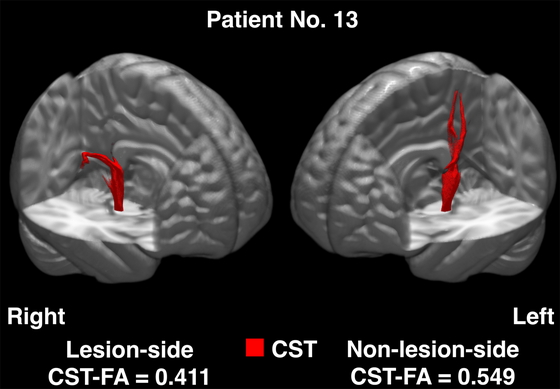
An example of diffusion-tensor tractography illustrated in the standard brain (patient 13 in Table 1).
Motor function impairment in the upper and lower extremities (hemiparesis) caused by stroke was assessed using the motor component of the Stroke Impairment Assessment Set (SIAS-motor).27) This evaluation assesses functions of the arm, finger, hip, knee, and ankle on a scale from null to full (0 to 5). In this study, the total sum of the SIAS-motor scores was computed for each patient to quantify gross motor function on the paralyzed side, following the method outlined in our previous study.7) Additionally, the motor component scores of the Functional Independence Measure (FIM-motor), which range from total dependence to full independence (null to full, 13 to 91),28) were collected for each patient. The SIAS-motor and the FIM-motor scores were assessed every 2 weeks, and data were collected at the time of discharge from our long-term rehabilitation facility. The total length of hospital stay (LOS), which included the period of acute medical care, was also documented.
Statistical AnalysisTo assess the relationships among the CST-LL, the lesion-side CST-FA, and the SIAS-motor total, we performed Pearson’s correlation tests on all possible pairs. To evaluate the predictive accuracy of combination of the CST-LL and the lesion-side CST-FA for motor outcomes, a multivariate regression analysis was conducted. This analysis used the CST-LL and the lesion-side CST-FA as explanatory variables and the SIAS-motor total as the target value. All statistical analyses were conducted using the JMP software package (SAS Institute, Cary, NC, USA). A P value of less than 0.05 was considered statistically significant. Further analyses on the FIM-motor data and LOS data, which will involve a larger number of participants, will be reported separately in a future publication.
The patient profiles are summarized in Table 1. The study included a total of 25 patients, consisting of 17 men and 8 women. Among these patients, 15 had lesions in the right hemisphere, and 10 had lesions in the left hemisphere. The age ranged from 42 to 86 years, with a median age of 62 years. The SIAS-motor total varied from 0 to 25 (median, 17), the FIM-motor score ranged from 27 to 91 (median, 84), and the LOS ranged from 42 to 227 days (median, 121 days). The CST-LL volumes varied from 0.298 to 7.595 mL (median, 2.522 mL). The CST-FA values in the lesion-side hemisphere ranged from 0.211 to 0.530 (median, 0.409), whereas those in the non-lesion-side hemisphere ranged from 0.469 to 0.653 (median, 0.572).
| Patient no. | Sex | Age (years) | Lesion site | SIAS-motor | FIM-motor | LOS (days) | CST-LL (mL) | CST-FA | |||
| Raw score | Total | Lesion side | Non-lesion side | ||||||||
| 1 | M | 53 | L | Put | 1-1-3-3-1 | 9 | 84 | 153 | 0.289 | 0.371 | 0.600 |
| 2 | F | 77 | L | Thal | 5-5-5-5-5 | 25 | 89 | 52 | 0.606 | 0.438 | 0.557 |
| 3 | F | 68 | R | Thal | 5-4-5-5-5 | 24 | 79 | 76 | 0.632 | 0.523 | 0.549 |
| 4 | M | 55 | R | Thal | 5-5-5-5-5 | 25 | 91 | 42 | 0.670 | 0.447 | 0.554 |
| 5 | M | 64 | L | Thal/Put | 5-5-4-4-4 | 22 | 80 | 169 | 1.050 | 0.496 | 0.510 |
| 6 | M | 57 | R | Thal | 5-5-5-5-5 | 25 | 89 | 55 | 1.121 | 0.490 | 0.606 |
| 7 | M | 58 | R | Put | 5-5-5-5-5 | 25 | 91 | 43 | 1.149 | 0.501 | 0.568 |
| 8 | M | 62 | L | Thal | 5-4-5-4-4 | 22 | 90 | 61 | 1.306 | 0.472 | 0.540 |
| 9 | F | 73 | L | Thal | 4-4-5-4-4 | 21 | 90 | 55 | 1.374 | 0.375 | 0.554 |
| 10 | M | 65 | L | Put | 2-0-3-3-1 | 9 | 85 | 145 | 1.817 | 0.400 | 0.653 |
| 11 | M | 69 | R | Thal | 4-3-4-3-4 | 18 | 76 | 76 | 2.058 | 0.411 | 0.556 |
| 12 | M | 42 | R | Put | 4-4-4-4-4 | 20 | 90 | 78 | 2.278 | 0.529 | 0.593 |
| 13 | M | 54 | R | Put | 3-2-4-4-4 | 17 | 87 | 203 | 2.522 | 0.411 | 0.549 |
| 14 | F | 57 | L | Put | 0-0-0-0-0 | 0 | 38 | 120 | 2.546 | 0.288 | 0.610 |
| 15 | M | 65 | R | Thal | 5-5-5-5-5 | 25 | 91 | 94 | 2.653 | 0.530 | 0.612 |
| 16 | F | 86 | R | Thal | 3-2-4-4-4 | 17 | 61 | 227 | 2.776 | 0.407 | 0.567 |
| 17 | M | 62 | L | Put | 3-1-3-3-2 | 12 | 84 | 102 | 2.942 | 0.375 | 0.611 |
| 18 | F | 53 | L | Put | 4-4-5-5-4 | 22 | 90 | 121 | 3.126 | 0.397 | 0.615 |
| 19 | F | 43 | R | Put | 2-1-3-4-4 | 14 | 66 | 162 | 3.665 | 0.320 | 0.556 |
| 20 | M | 73 | R | Thal/Put | 1-1-2-2-1 | 7 | 70 | 149 | 4.082 | 0.339 | 0.572 |
| 21 | M | 75 | R | Thal | 1-0-1-2-0 | 4 | 27 | 139 | 4.376 | 0.369 | 0.601 |
| 22 | M | 75 | R | Thal | 3-2-3-3-3 | 11 | 58 | 200 | 4.741 | 0.415 | 0.469 |
| 23 | M | 57 | L | Put | 2-1-3-2-1 | 9 | 81 | 122 | 5.369 | 0.211 | 0.615 |
| 24 | M | 80 | R | Thal | 0-1-2-1-0 | 4 | 59 | 176 | 6.011 | 0.409 | 0.598 |
| 25 | F | 61 | R | Put | 0-0-0-0-0 | 0 | 39 | 205 | 7.595 | 0.307 | 0.574 |
Patients are sequenced according to CST-LL (lowest to highest). Five patients (1, 13, 19, 23, and 25) underwent surgical
removal of hematoma. Raw SIAS-motor scores are sequenced as arm–finger–hip–knee–ankle.
M, male; F, female; L, left; R, right; Put, putamen; Thal, thalamus.
Figure 3 illustrates the results obtained from the correlation analyses conducted in this study. The relationships among the CST-LL, the lesion-side CST-FA, and the SIAS-motor total were found to be statistically significant. The strengths of these correlations are summarized as follows: 1) the relationship between the CST-LL and the CST-FA was statistically significant, with a correlation coefficient (R) of −0.572, indicating a moderate negative correlation; 2) the correlation between the CST-LL and the SIAS-motor total was statistically significant, with an R value of −0.706, indicating a strong negative correlation; 3) the correlation between the CST-FA and the SIAS-motor total was notably strong, with an R value of 0.743, indicating a high positive correlation.

Scatterplots and correlations among CST-LL, lesion-side CST-FA, and SIAS-motor total. Red lines indicate density ellipses (0.90).
Table 2 presents the results obtained from the multivariate regression analysis. Both the CST-LL and the lesion-side CST-FA were identified as statistically significant contributory variables that explain the variability in the SIAS-motor total. As shown in Table 2 and Fig. 4, the regression model accounted for as much as 63.9% of the variability in the target value. The estimated t values were −2.78 for the CST-LL and 3.38 for the lesion-side CST-FA, indicating that these two variables almost equally contributed to the SIAS-motor total.
| Explanatory variable | SIAS-motor total | |||
| Estimate | SE | t | P | |
| CST-LL | −1.87 | 0.67 | −2.78 | 0.011 |
| Lesion-side CST-FA | 53.02 | 15.69 | 3.38 | 0.003 |
| Intercept | −1.22 | 7.66 | −0.16 | 0.875 |
| Adjusted R2 | 0.639 | <0.001 | ||
SE, standard error.
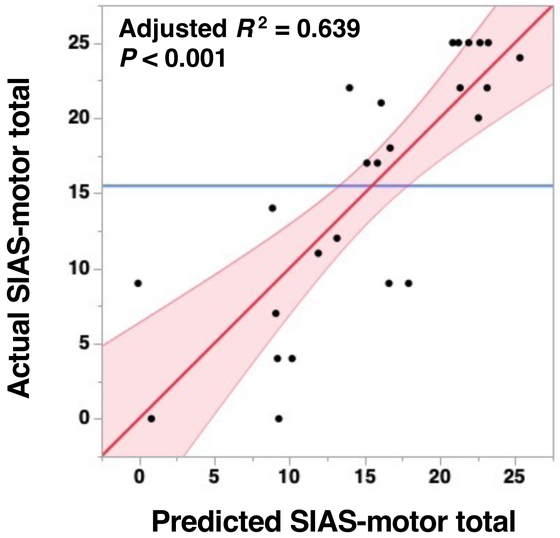
Scatterplot of actual measured values of SIAS-motor total on the vertical axis plotted against the predicted values obtained through multivariate regression analysis (refer to Table 2). Red line with a slope of 1 indicates a perfect fit (where predicted and actual values are identical). Pink region, 95% confidence interval; blue line, mean of actual values.
The findings of this study indicate that the combination of CST-LL derived from regular CT scans during the acute phase and the lesion-side CST-FA obtained approximately 2 weeks after onset can explain a significant portion of the variability in the severity of hemiparesis among patients with hemorrhagic stroke. As shown in Fig. 3, the correlation between CST-LL and the lesion-side CST-FA was moderate. However, as demonstrated in Table 2 and Fig. 4, the results from the multivariate regression analysis indicated that both of these factors were independent predictors of stroke outcomes. Consequently, this study, for the first time, has revealed that the combination of these two neuroimaging techniques better predicts the outcomes of patients after hemorrhagic stroke.
Clinical utility of the CST-LL was first reported by Zhu et al.,10) who sampled patients in their chronic phase after stroke. In their study, Zhu et al. assessed the CST-LL from T1 images. To expand the clinical utility during the acute phase, Feng et al.5) sampled patients treated in an acute care service, and performed analyses similar to those of Zhu et al.10) In the study of Feng et al.,5) assessment of the CST-LL was based on diffusion-weighted images, which are widely used for the diagnosis of ischemic stroke during acute care. In each of the aforementioned studies, the majority of patients has suffered ischemic stroke. To enhance the applicability of the CST-LL for predicting outcomes, some research teams have conducted studies involving patients who had experienced hemorrhagic stroke during acute care.7,29) In our previous study,7) using the same methodology for the current study, we evaluated the CST-LL using CT images. The results obtained in our previous study7) were very similar to the results for patients with ischemic stroke as reported by Feng et al.5) and Zhu et al.10) In the current study, we have confirmed that the results are reproducible in a different dataset, suggesting that the internal validity of our methodology has been confirmed. Although the external validity still needs to be confirmed, our methodology for obtaining the CST-LL is potentially useful in clinical settings.
In this study, for the image processing of diffusion-tensor data, we applied standardized automated tractography. Tractography is traditionally based on manual definition of a starting point (seed) and an endpoint (target),30) making it a time-consuming and subjectively challenging process with lower reproducibility compared with other DTI analysis methods.17,18,19,20,21) To address these limitations, an automated approach called XTRACT has been developed.13) This process utilizes predefined parameter settings for tractography analyses, including seed points, target points, exclusion masks, and the number of samples. This automated method routinely extracts 42 tracts, such as the CST, superior longitudinal fasciculus, and uncinate fasciculus. The simplicity of this method makes it suitable for clinical applications. We have explored the clinical utility of this automated tractography tool in planning rehabilitative treatments during the acute phase following a stroke at a community-based hospital in Japan. The clinical utility and applicability of the method were reported in our recent publications.14,15,25)
Among neuroimaging techniques used in outcome prediction studies, DTI is employed to detect Wallerian degeneration caused by stroke lesions. As a result, DTI data acquisition is often scheduled for approximately 2 weeks after the onset of stroke when reliable signal changes become apparent.31) In contrast, CT scans reveal high-density areas at the time of stroke onset in patients with intracerebral hemorrhage, eliminating the need to wait for significant signal changes. Taking these issues into consideration, it is reasonable to predict stroke outcomes through CT imaging on the day of onset, followed by confirmation through DTI several weeks later. Nevertheless, additional research is necessary to elucidate the clinical efficacy of combining CT and DTI for predicting stroke outcomes.
This study has several limitations. First, to minimize variability arising from lesion cites, this study included only patients with hemorrhage in the thalamus and/or putamen. However, in real-world clinical practice, there are many patients with hemorrhages occurring in different brain regions, including subcortical structures and sub-tentorial areas like the pons. Further studies that include patients with lesions of various brain regions are needed to evaluate the effectiveness of the proposed methodology. Second, the study population was limited to first-stroke patients who were functionally independent before the onset of their stroke. Consequently, the extent to which the findings can be applied to geriatric patients who needed assistance in ADL before stroke is uncertain. Third, the sample size in the current study was 25 participants, which may be considered relatively small in the context of research studies. However, it is worth highlighting that a recent systematic review that examined a wide range of studies found that the median sample size among 71 studies was 28, with an interquartile range of 15 to 50.3) Although a larger sample size can offer increased statistical power and potentially improve the generalizability of findings, it is important to acknowledge that working with smaller sample sizes is not uncommon in clinical neuroimaging studies.
The combination of the CST-LL derived from CT scans during the acute phase and the lesion-side CST-FA obtained approximately 2 weeks after onset could account for much of the variability in the severity of hemiparesis among patients with intracerebral hemorrhage. This suggests that neuroimaging techniques used in daily clinical practice have potential as useful tools for predicting outcomes in these patients. While further research is needed to validate and expand upon these findings, this study contributes to our understanding of how imaging data can be used for outcome prediction in clinical practice, particularly in the context of hemorrhagic stroke.
This work was supported in part by a Grant-in-Aid for Scientific Research (C) from the Japan Society for the Promotion of Science (JSPS KAKENHI Grant Number JP22K11356) and by a Grant-in-Aid for Transformative Research Areas—Platforms for Advanced Technologies and Research Resources “Advanced Bioimaging Support” (JSPS KAKENHI Grant Number JP22H04926).
The authors declare no conflict of interest.