A 70-year-old man presented to the ER with a fever of >38°C and edema of his face and extremities. Four days prior, he had noticed general fatigue and a loss of appetite. On examination, his consciousness level was normal. His body temperature was 37.3°C, pulse rate was 88 beats/min, respiration rate was 18 breaths/min, blood pressure was 156/75 mmHg, and arterial oxygen saturation was 93%. The patient was admitted to the hematology department after an emergency laboratory test disclosed marked leukocytosis.
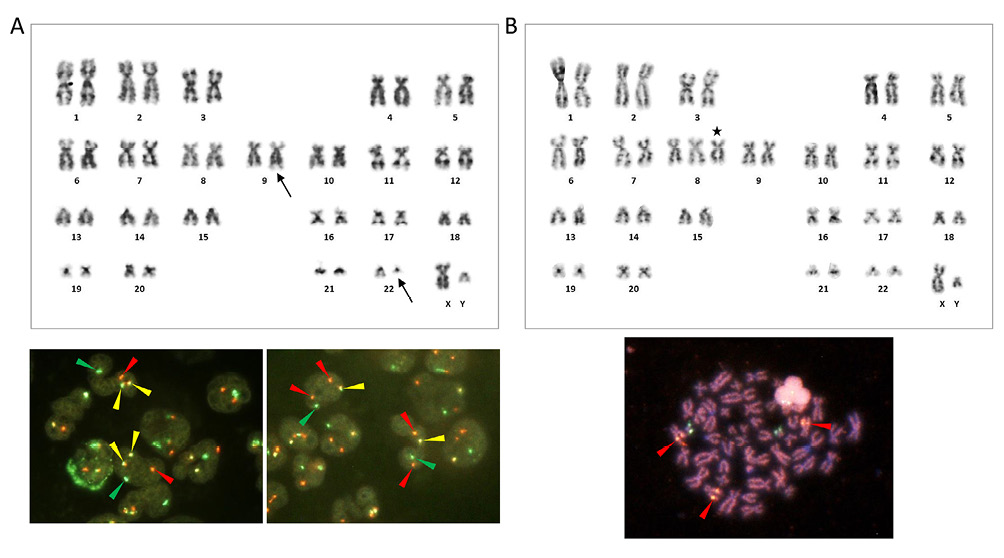
The patient first presented to our department 7 years earlier, at the age of 63, with leukocytosis. Hematological, cytogenetic, and molecular studies confirmed that he had chronic myeloid leukemia (CML) in chronic phase: bone marrow (BM) showed marked hypercellularity with granulocyte and megakaryocyte series hyperplasia; G-banding karyotype was 46,XY,t(9;22)(q34;q11.2)[10] (Figure 1A, top); fluorescence in situ hybridization (FISH) detected the presence of BCR-ABL1 fusion signals, confirming t(9;22)(q34;q11.2) (Figure 1A, bottom); and BCR-ABL1 fusion mRNA had the e13a2 (formerly b2a2) breakpoints, producing the p210-type chimeric protein. The liver and spleen were palpable at 3 fingerbreadths below the right and left costal margins, respectively. The spleen index, estimated by ultrasound (on longitudinal images, distance between the splenic hilum and the most superomedial point [cm] × length of its perpendicular line from the hilum [cm]), was 56.7 (normal range, <20).
We initially treated him with dasatinib; however, the drug was switched to nilotinib after he developed pulmonary edema. One year after the initial presentation, the patient was subjected to the International Scale-standardized BCR-ABL1 mRNA (BCR-ABL1IS) test after it had been approved by the medical service fee system, returning a value of 0.0314%. This value dropped below the level of detection after 3 years. Subsequently, the patient maintained a state of deep molecular response (DMR) with a daily dose of 300 mg nilotinib. However, during DMR, the patient had a red cell count that ranged between 3.14 and 3.96 × 10⁶/μL, with reticulocytes accounting for between 4.5 and 10.2%, elevated indirect bilirubin, and reduced haptoglobin. Coombs test was negative. Peripheral blood (PB) pictures consistently showed spherocytes, indicating that the patient also had hereditary spherocytosis even though his family history was not available. Spleen indices reported during DMR were 62.4 and 44.4. No gallstone was found.
The patient’s hemoglobin level at admission was 10.0 g/dL, white cell count was 141.72 × 10³/μL, and platelet count was 162 × 103/μL. The level of lactate dehydrogenase (LD) was 2,225 U/L, aspartate aminotransferase was 66 U/L, alanine aminotransferase was 42 U/L, total bilirubin was 1.5 mg/dL, total protein was 6.6 g/dL, albumin was 4.3 g/dL, globulin was 2.3 g/dL, creatinine was 1.4 mg/dL, uric acid was 10.7 mg/dL, C-reactive protein was 1.21 mg/dL, and fibrin degradation product (FDP)/D-dimer was 25.0 μg/mL (reference range, ≤ 1 μg/mL). The value of BCR-ABL1IS was below the lower limit of detection. Splenomegaly, evaluated by computed tomography, had worsened when compared with its severity during DMR.
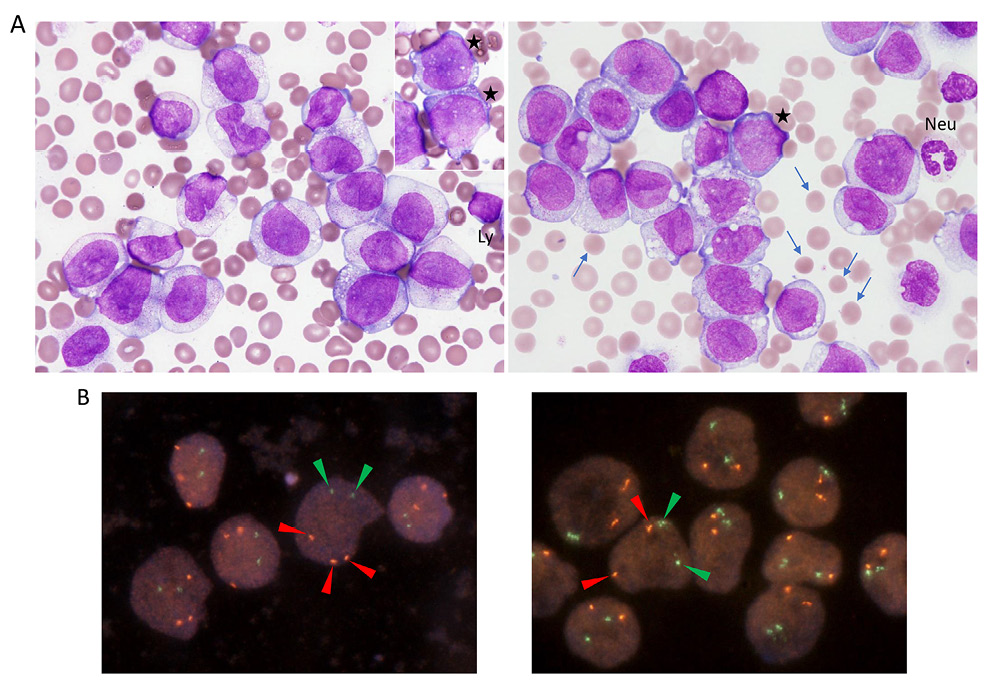
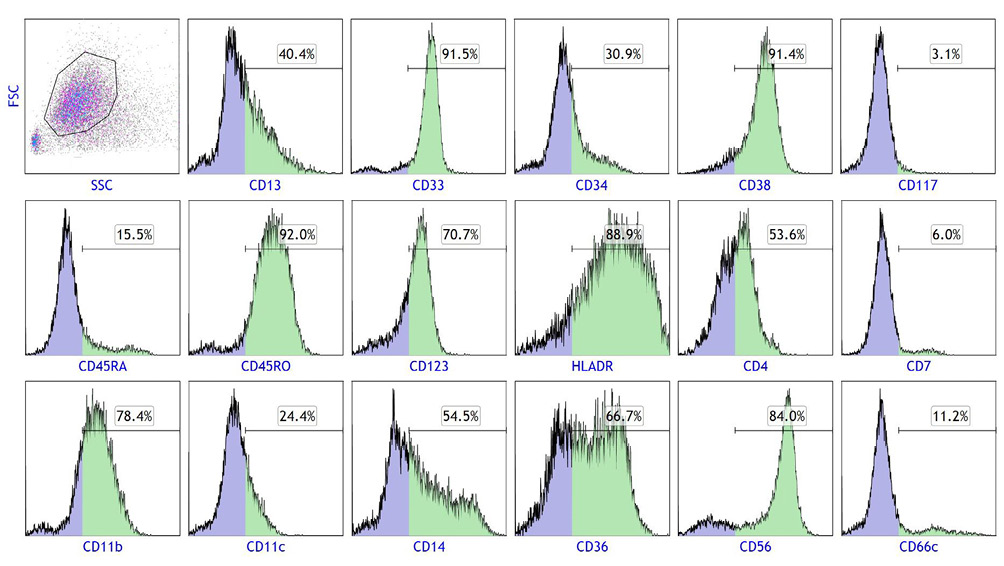
Microscopic examination of a PB smear revealed marked proliferation of leukemia cells with morphologies of promonocytes, i.e., variably indented or folded nuclei with lacy chromatin and indistinct nucleoli and abundant cytoplasm containing fine azurophilic granules (Key Figure, A). Cytoplasmic vacuoles were also seen. The cells were CD34−/+, CD117−, CD13−/+, CD14+/−, CD33+, CD36++/+, CD11b+, CD11c−/+, CD4−/+, CD7−, CD38+, CD45RA−, CD45RO+, CD56+, CD123+, and HLA-DR+, thus displaying a phenotype congruent with that of maturing monocytes (Figure 2). Cytochemical data were not available.
Metaphase cells obtained from PB carried trisomy 8 but lacked t(9;22)(q34;q11.2) by G-banding (karyotype: 47,XY,+8[11]) (Figure 1B, top). We then applied FISH to the PB smear slide using the RUNX1-RUNX1T1 and BCR-ABL1 dual-color dual-fusion (DF) probes. The results showed 3 red (RUNX1T1 at 8q21.3) and 2 green (RUNX1 at 21q22) signals with the former probe and 2 red (ABL1 at 9q34.1) and 2 green (BCR at 22q11,2) signals with the latter probe in the nuclei of the leukemia cells, confirming +8 and the lack of t(9;22)(q34.q11.2)/BCR-ABL1 (Key Figure, B). Finally, we obtained a metaphase spread from the cytogenetic preparation in which 3 chromosome homologues were labeled by the RUNXT1 red signal (Figure 1B, bottom).
On the fourth day of hospitalization, the patient’s white cell count rose to 251.49 × 10³/μL with 86.4% leukemia cells, while his hemoglobin level was 6.9 g/dL and platelet count was 84 × 103/μL. LD was 6,191 U/L, FDP was 201.0 μg/mL (reference range, ≤ 5 μg/mL), D-dimer was 65.3 μg/mL (reference range, ≤1 μg/mL), and ferritin was 13,329 ng/mL (reference range, 10–260 ng/mL). He became unresponsive to noxious stimuli and was found to have developed widespread intracranial hemorrhage involving the brain parenchyma and both subarachnoid and subdural spaces. He died shortly thereafter.
This report describes the development of acute monocytic leukemia (AMoL) in a patient with CML who had achieved a stable DMR with nilotinib. As the cells lacked t(9;22)(q34;q11.2) by G-banding and BCR-ABL1 fusion signals by FISH, it is evident that the leukemia originated from Philadelphia chromosome-negative (Ph−) hematopoietic cells.
In a significant proportion of patients with CML treated with tyrosine kinase inhibitors (TKIs), including nilotinib, clonal chromosomal abnormalities emerge in the Ph− metaphases (CCA/Ph−).1-4 The most frequent abnormality is –Y, followed by +8, –7/del(7q), and del(20q).1,2,4 Although the underlying mechanism for the emergence of CCA/Ph− remains to be elucidated, the presence of CCA/Ph− other than –Y during TKI treatment have been reported to be associated with decreased failure-free, event-free, transformation-free, and overall survivals.2,3 Cases of myelodysplastic syndrome (MDS) and acute myeloid leukemia (AML) that developed from –7/del(7q) CCA/Ph− clones have also been described.1,2,4,5 Accordingly, the European LeukemiaNet recommendations for the management of CML (2013) list the presence of –7/del(7q) CCA/Ph− in the warning category.6 Thus, regular BM examinations and conventional G-banding are suggested to be performed at least during the early stages of TKI treatment;2 however, the BM test is not performed as often as it used to be because of the increasing reliance on the BCR-ABL1IS test for disease monitoring.
In the current case, since the leukemia cells carried +8, which is the second most common CCA/Ph–,1,2,4 it is possible that the leukemia clone had emerged earlier and in association with nilotinib treatment. However, as AMoL has not been described in CCA/Ph– MDS/AML in literature and no prodromic hematologic abnormalities indicative of myelodysplasia were observed during treatment, it is more likely that the leukemia occurred de novo and independently from nilotinib treatment; the presence of +8 is not against this likelihood because +8 is observed in various myeloid neoplasms. Nevertheless, T-cell dysfunction due to nilotinib-induced immunosuppression may account for the markedly rapid proliferation of leukemia cells associated with disseminated intravascular coagulation syndrome seen in this case.7