Abstract
We herein described a female patient in her 60s with metastatic breast cancer who concomitantly developed stage IV follicular lymphoma (FL). Lymph node biopsy revealed FL grade 3A histopathology. Lymphoma cells were positive for CD10, CD20, CD79a, BCL2, and BCL6 and negative for CD3. G-banding and fluorescence in situ hybridization showed a major cytogenetic clone marked with t(14;18)(q32;q21)/IGH::BCL2 and a minor clone with a 3-break translocation, t(3;14;18)(q27;q32;q21), involving BCL6, IGH, and BCL2. We amplified the DNA fragments encompassing the BCL2::IGH and BCL6::IGH junctions by a long-distance polymerase chain reaction and found that the former fragment comprised sequences of the far 3′ major breakpoint region cluster of BCL2 followed by IGHJ6 and those of IGHG1, while the latter fragment comprised sequences of the major translocation cluster of BCL6 and those of IGHG2. In der(3)t(3;14;18), the coding exons of BCL2 and BCL6 aligned in the same transcriptional orientation and the intronic Eμ enhancer of IGH was present between the two genes. We proposed that t(3;14;18) was generated by two-step translocations and BCL2::IGH and BCL6::IGH involved the same IGH allele.
Translated Abstract
症例は60代女性.転移性乳癌の治療中にステージIVの濾胞性リンパ腫(FL)を併発した.リンパ節生検でFL grade 3Aの組織像を示し,リンパ腫細胞はCD10,CD20,CD79a,BCL2,BCL6陽性,CD3陰性であった.Gバンディングと蛍光in situハイブリダイゼーションにより,t(14;18)(q32;q21)/IGH::BCL2を示すメジャークローンと,BCL6,IGH,BCL2を含むトリプル転座t(3;14;18)(q27;q32;q21)のマイナークローンを認めた.BCL2::IGHとBCL6::IGHの切断点を含むDNA領域をlong-distance PCRにより増幅したところ,前者はBCL2のfar 3′ major breakpoint region clusterとIGHJ6,IGHG1の配列からなり,後者はBCL6のmajor translocation clusterとIGHG2の配列からなっていた.従って,der(3)t(3;14;18)では,BCL2とBCL6のコーディングエクソンが同じ転写方向に並び,IGHのイントロンEμエンハンサーが2つの遺伝子の間に存在していると考えられた.t(3;14;18)はt(14;18)とt(3;14)の2段階転座によって生じ,BCL2::IGHとBCL6::IGHは同じIGHアリルが関与していることが示唆された.
INTRODUCTION
Follicular lymphoma (FL) is the most common subtype of low-grade B-cell lymphomas.1 The majority of FL cases carry t(14;18)(q32;q21) that fuses BCL2 on 18q21 to IGH on 14q32,1 leading to the deregulated overexpression of the anti-apoptotic protein BCL2. On the other hand, BCL6 was initially identified in the proximity of the breakpoint of t(3;14)(q27;q32) and its light chain variant t(3;22)(q27;q11).2, 3 This gene encodes a zinc-finger transcriptional repressor, which plays a critical role in the initiation and maintenance of germinal centers in lymphoid follicles.4BCL6 is rearranged with not only immunoglobulin (IG) genes, but also diverse non-IG genes, and rearrangements have been reported in between 5 and 15% of FL cases and between 18 and 25% of diffuse large B-cell lymphoma cases.1, 5-8
In this case report, we present a patient who developed advanced-stage FL during treatment for breast cancer. A cytogenetic analysis of lymphoma cells revealed a typical t(14;18)(q32;q21) and BCL2::IGH fusion; however, in some cells, chromosomal materials, including BCL2, were translocated to chromosome 3 at band q27, at which BCL6 is located, instead of 14q32/IGH, indicating the 3-break translocation, t(3;14;18)(q27;q32;q21). The clinical, histopathological, and cytogenetic features of this patient and DNA studies to reveal the anatomy of t(3;14;18) are described herein.
CASE REPORT
Case presentation
A woman in her 60s presented to the Department of Hematology with lymphocytosis. She had been treated for metastatic breast cancer for more than 10 years and her most recent treatment was the estrogen receptor antagonist, fulvestrant. Her hemoglobin level was 11.8 g/dL, white cell count was 12.30 × 10³/μL, and platelet count was 260 × 103/μL. The white cell differential included 21.5% lymphocytes and 27.5% atypical lymphocytes with a high nuclear/cytoplasmic ratio and nuclear clefts. The level of lactate dehydrogenase was 160 U/L, total protein was 7.1 g/dL, albumin was 4.6 g/dL, uric acid was 3.5 mg/dL, C-reactive protein was 0.11 mg/dL, soluble interleukin-2 receptor was 1,190 U/mL (reference range, 122 to 496 U/mL), and β2 microglobulin was 1.90 μg/mL (reference range, 0.8 to 1.9 μg/mL). 18F-fluorodeoxyglucose-positron emission tomography combined with computed tomography performed 14 days after a dose of fulvestrant revealed tracer-avid multiple lymph nodes in the cervical, supraclavicular, axillary, lung hilar, liver portal, paraaortic, iliac, and inguinal regions. The spleen was homogeneously stained. Her ECOG performance status was 1.
A biopsy specimen obtained from the cervical lymph nodes comprised follicles with the back-to-back pattern that effaced the nodal architecture (Figure 1A). Tingible body macrophages were absent, whereas mitotic figures were frequent. Lymphoma cells were medium to large and centroblasts were predominant (>15 per high-power microscopic field), corresponding to the grade 3A category of FL (Figure 1B). An immunohistochemical examination showed that cells were positive for CD10, CD20, CD79a, BCL2, and BCL6 and negative for CD3 (Figures 1C to H). The Ki-67 labeling index was 60% (Figure 1I). Bone marrow showed the paratrabecular pattern of the infiltration of lymphoma cells. Lymphoma cells in LN and BM were CD19+/dim, CD20+, CD21−/+, CD22+, CD23−, CD24+/−, CD5−, CD10+, CD38+, and HLA-DR+ and expressed IgG/κ by flow cytometry, while circulating atypical lymphocytes showed similar cell-surface antigen expression.

The patient was treated with 6 cycles of the combination of bendamustine and rituximab, which resulted in the complete resolution of lymphoma lesions. However, she died of systemic metastasis of breast cancer 2 years and 4 months after presenting to the Department of Hematology.
Cytogenetic analysis
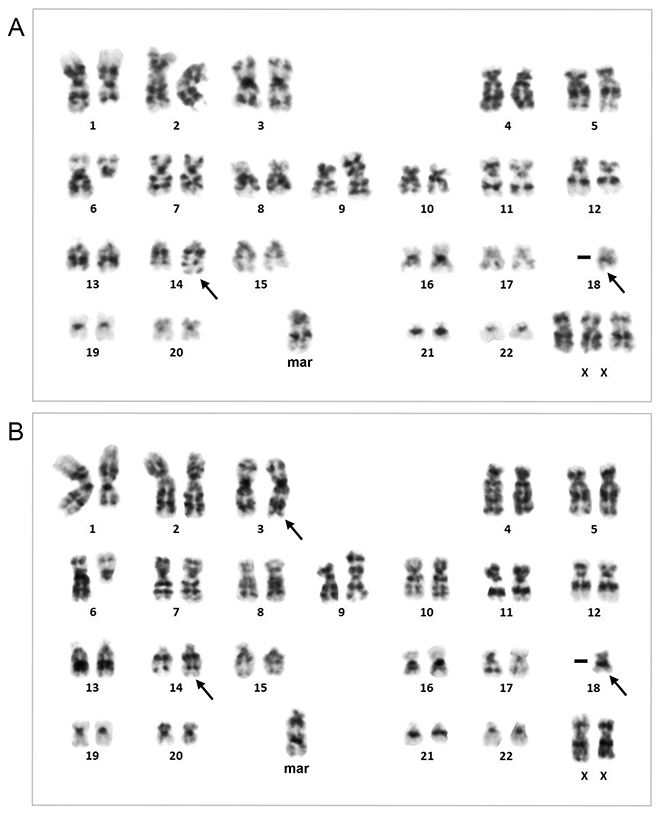
G-banding of metaphase spreads prepared from the biopsy sample revealed two related cytogenetic clones that shared del(1)(q31), del(6)(q13), add(9)(p22), and −18 and an unidentified marker chromosome containing segments of the long arm of chromosome 1 (Figure 2). The karyotype of the major clone consisted of t(14;18)(q32;q21) recognized by the typical 14q+ and 18q− morphology (Figure 2A). In the minor clone karyotype, the segment of chromosome 18 distal to q21 was translocated to chromosome 3 at band q27 and the segment of chromosome 3 distal to q27 was translocated to chromosome 14 at band q32, representing the 3-break translocation, t(3;14;18)(q27;q32;q21) (Figure 2B). Fluorescence in situ hybridization (FISH) using the BCL2 break apart (BA) probe showed that the red-labeled telomeric 5′ BCL2 probe was localized in der(14)t(14;18) at the band q32 in the major clone, while it was detected in der(3)t(3;14;18) at the band q27 in the minor clone (Figures 3A and 4), confirming that the chromosomal materials including BCL2 were translocated to der(14)t(14;18) and der(3)t(3;14;18), respectively, in each clone.

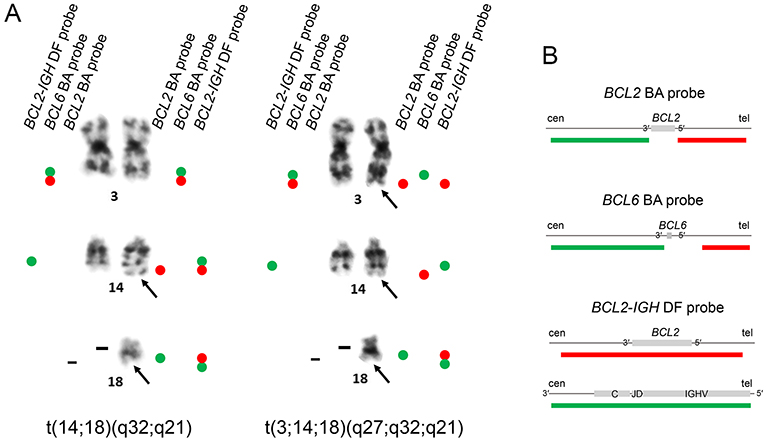
FISH with the BCL6 BA probe demonstrated that the two chromosome 3 homologues in the major clone were labeled by unrearranged BCL6 signals, while der(3) and der(14) in the minor clone were labeled by the green-labeled centromeric 3′ BCL6 and red-labeled telomeric 5′ BCL6 probes, respectively (Figure 4). der(14) and der(18) in the major clone were labeled by the BCL2::IGH fusion signals using the BCL2-IGH dual fusion (DF) probe, while der(3) in the minor clone was labeled by the BCL2 red signal alone and no IGH green signal was visible in der(3) (Figure 4). Accordingly, interphase nuclei exhibited zero red (BCL2), one green (IGH), and two yellow (BCL2::IGH fusion) hybridization signals (0R1G2Y), representing the major clone, or one red, two green, and one yellow signals (1R2G1Y), representing the minor clone (Figure 3B).
Anatomy of t(3;14;18)(q27;q32;q21)
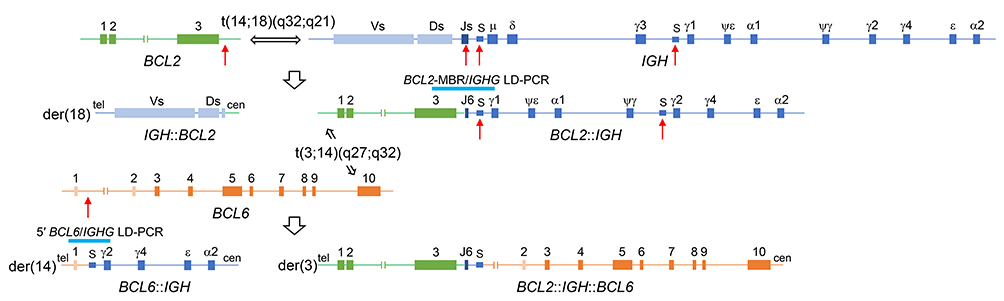
G-banding and FISH suggested that t(14;18)(q32;q21)/IGH::BCL2 occurred first, followed by t(3;14)(q27;q32)/BCL6::IGH involving the same IGH allele, thereby leading to the generation of t(3;14;18)(q27;q32;q21). To confirm the BCL2::IGH and BCL6::IGH fusion sequences, we isolated genomic DNA from the biopsy sample and performed a long-distance polymerase chain reaction (LD-PCR) amplifying the DNA encompassing the junctions.9 Combinations of the BCL2-major breakpoint cluster (MBR), IGH enhancer (En), and IGHG primers generated 8.1- and 12.0-kb LD-PCR products (Figure 5A, arrows). Nucleotide sequencing of the BCL2 side of the products using a series of sequencing primers revealed BCL2 sequences ~3.0 kb downstream of the 3′ end of exon 3, which was defined as the far 3′ MBR cluster,10 followed by IGHJ6 (Figure 5B). The sequences of the IGH side of the products closely matched IGHG1 (Figures 5C). Combinations of a primer for upstream of BCL6 exon 1 and those for IGHG generated 9.5- and 7.0-bp LD-PCR products (Figure 6A, arrows) and nucleotide sequencing of the BCL6 side of products revealed the junction between the major translocation cluster (MTC) downstream of BCL6 exon 1 and intronic sequences between IGHGP and IGHG2 (Figure 6B). The sequences of the IGH side of the products closely matched IGHG2 (Figure 6C).
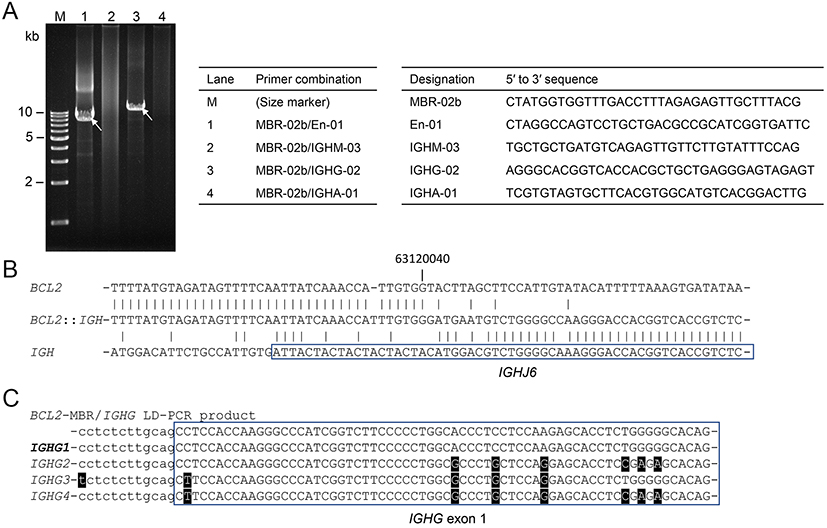
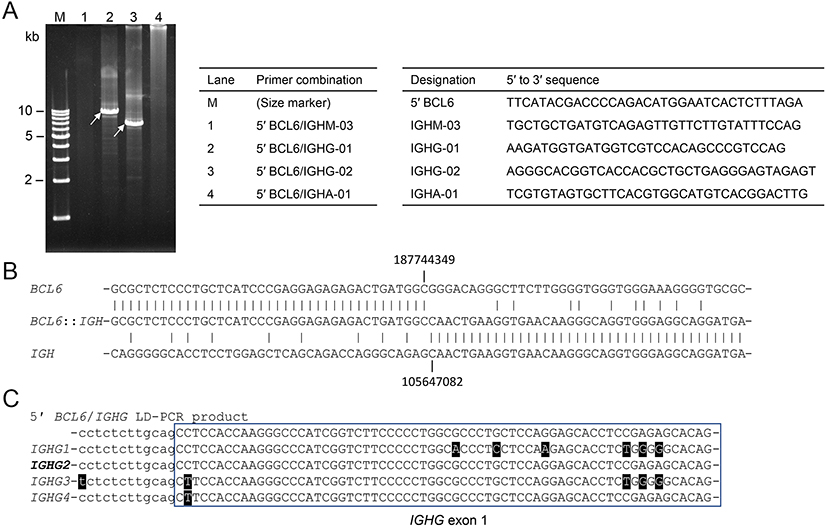
Figure 7 shows the two-step translocation model that involves a single IGH allele to create t(3;14;18)(q27;q32;q21). The first t(14;18)(q32;q21)/IGH::BCL2 occurred between the far 3′ MBR cluster of BCL2 and IGHJ6, and the downstream constant gene was class-switched from IGHM to IGHG1. The second t(3;14)(q27;q32)/BCL6::IGH occurred between the MTC of BCL6 and the switch region associated with IGHG2, and again through the class switch recombination (CSR) mechanism, BCL6 was joined to IGH in the same transcriptional orientation. Since IGHG1 is the second-most upstream IGHG and IGHG2 is located ~100 kb downstream of IGHG1, this model may account for the development of BCL2::IGH followed by IGH::BCL6 involving the same IGH allele. The lack of a hybridization signal with the IGH probe in der(3)t(3;14;18) suggested that the intervening sequences from IGHG1 to IGHPG were deleted during the CSR process and the remaining IGH segment was too small to be detected by FISH with the IGH probe (Figures 3B, 4, and 7). According to this model, this translocation is more precisely described as der(3)t(3;14)(q27;q32)t(14;18)(q32;q21),der(14)t(3;14)(q27;q32),der(18)t(14;18)(q32;q21).
To examine the distribution of lymphoma cells carrying the rearrangement of BCL2 (BCL2-R) and those carrying the rearrangement of BCL6 (BCL6-R) within neoplastic follicles, we applied the BCL2 BA and BCL6 BA probes to tissue sections prepared from LN biopsy. Follicles were identified by DAPI staining, and BCL2 BA and BCL6 BA signal-positive cell nuclei were counted (Figure 8). Among the 10 follicles counted in each FISH preparation, BCL2-R+ nuclei accounted for 89.5, 85.0, and 78.6% in the central, intermediate, and peripheral zones of the follicles, respectively (Friedman non-parametric test, P = 0.132), while BCL6-R+ nuclei accounted for 9.4, 11.6, and 14.8%, respectively (P = 0.150) (Table 1). Therefore, BCL2-R+ and BCL6-R+ nuclei within BCL2-R+ nuclei were estimated to account for 10.5, 11.6, and 14.8% in the 3 zones of the follicles.
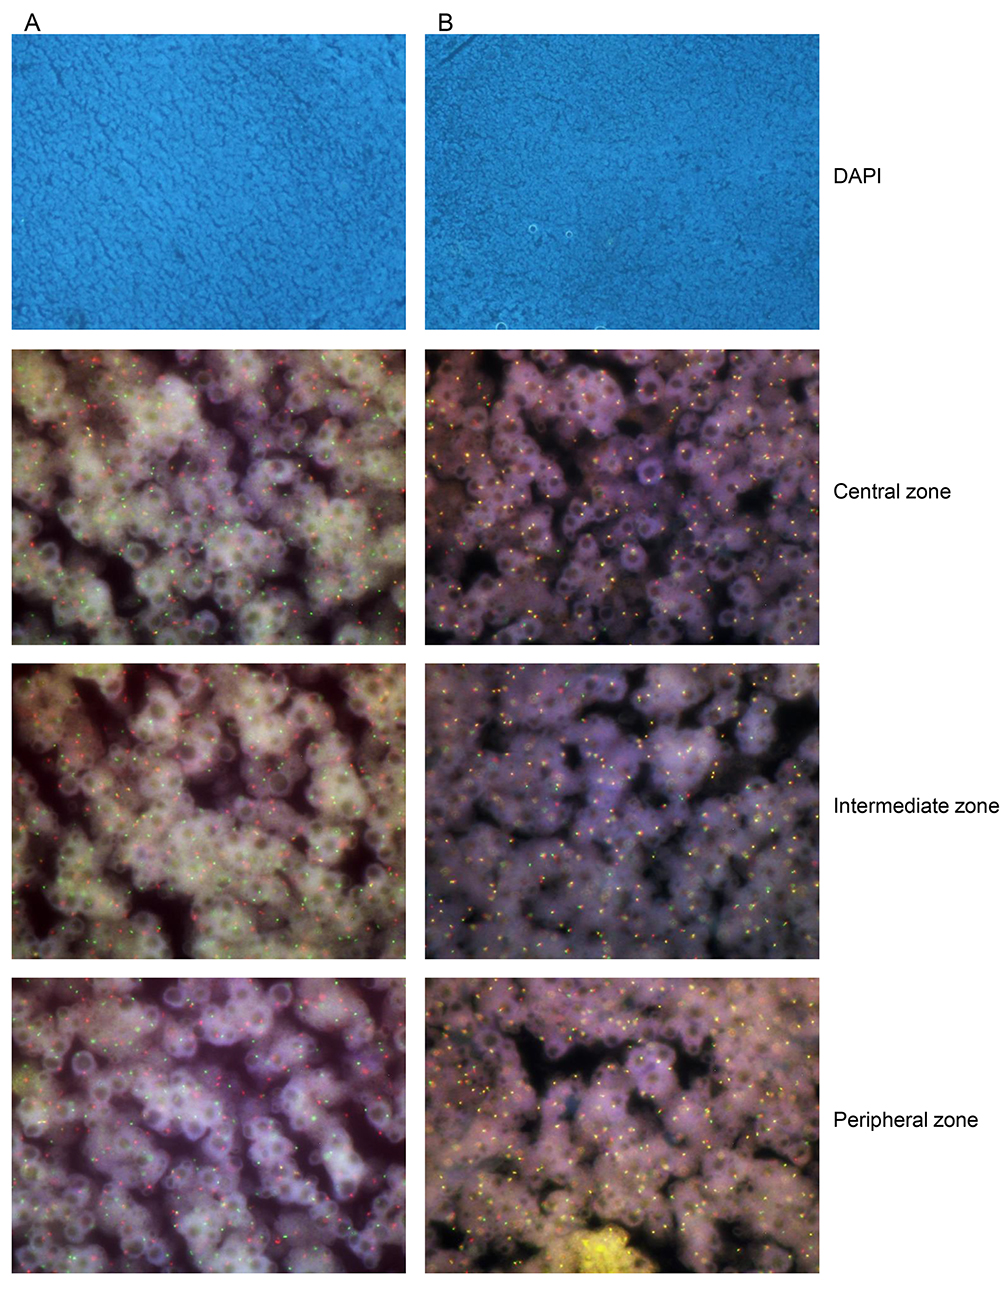
Table 1.
Distribution of
BCL2 and
BCL6 BA signal-positive nuclei within neoplastic follicles
|
Probe
|
Follicle
|
No. of BA signal-positive nuclei/no. of nuclei counted (%)
|
|
Central zone
|
Intermediate zone
|
Peripheral zone
|
|
BCL2 BA
|
A
|
48/50 (96.0)
|
50/50 (100.0)
|
35/51 (68.6)
|
|
B
|
34/50 (68.0)
|
20/57 (35.1)
|
34/54 (63.0)
|
|
C
|
48/50 (96.0)
|
48/50 (96.0)
|
50/50 (100.0)
|
|
D
|
42/52 (80.8)
|
47/52 (90.4)
|
38/50 (76.0)
|
|
E
|
59/65 (90.8)
|
68/70 (97.1)
|
54/58 (93.1)
|
|
F
|
48/69 (69.6)
|
21/54 (38.9)
|
19/67 (28.4)
|
|
G
|
54/55 (98.2)
|
53/55 (96.4)
|
46/54 (85.2)
|
|
H
|
63/66 (95.5)
|
58/58 (100.0)
|
55/60 (91.7)
|
|
I
|
69/69 (100.0)
|
55/57 (96.5)
|
56/58 (96.6)
|
|
J
|
55/55 (100.0)
|
60/62 (96.8)
|
62/69 (89.9)
|
|
BCL2 BA total
|
520/581 (89.5)
|
480/565 (85.0)
|
449/571 (78.6)
|
|
BCL6 BA
|
1
|
3/40 (7.5)
|
3/50 (6.0)
|
6/50 (12.0)
|
|
2
|
3/50 (6.0)
|
2/50 (4.0)
|
6/53 (11.3)
|
|
3
|
4/50 (8.0)
|
7/50 (14.0)
|
9/55 (16.4)
|
|
4
|
6/66 (9.1)
|
4/54 (7.4)
|
8/58 (13.8)
|
|
5
|
6/70(8.6)
|
13/60 (21.7)
|
11/68 (16.2)
|
|
6
|
8/64 (12.5)
|
8/72 (11.1)
|
9/73 (12.3)
|
|
7
|
13/72 (18.1)
|
11/71 (15.5)
|
6/77 (7.8)
|
|
8
|
6/77 (7.8)
|
7/77 (9.1)
|
8/77 (10.4)
|
|
9
|
3/61 (4.9)
|
5/72 (6.9)
|
5/73 (6.8)
|
|
10
|
8/89 (9.0)
|
4/93 (4.3)
|
8/72 (11.1)
|
| |
BAL6 BA total
|
60/639 (9.4)
|
64/649 (9.9)
|
76/656 (11.6)
|
Nuclei with a single green signal were counted as positive.
BA, break apart.
DISCUSSION
We herein described a female patient with metastatic breast cancer who concomitantly developed stage IV FL with blood and bone marrow involvement. Lymphoma cells were clonally marked with t(14;18)(q32;q21)/IGH::BCL2 and a fraction of lymphoma cells carried a second IGH translocation, t(3;14)(q27;q32)/BCL6::IGH, indicating that the latter translocation occurred as a karyotypic evolution in a single tumor. Most importantly, the two translocations involved the same IGH allele, creating the 3-break translocation, t(3;14;18)(q27;q32;q21), which has been reported in a small number of cases in the literature.11-14 It currently remains unclear whether the effects of t(3;14;18)(q27;q32;q21) on the expression of BCL2 and BCL6 are the same as or different from those of concurrent t(14;18)(q32;q21) and t(3;14)(q27;q32) involving separate IGH alleles.
Since the IGH gene is active throughout B-cell development and differentiation, the expression of partner genes involved in 14q32/IGH translocations may be affected by the juxtaposed IGH. The best characterized IGH enhancers are the intronic Eμ enhancer located between IGHJ and IGHM and 3′ enhancers located downstream of IGHA, which are referred to as the 3′ regulatory region (3′-RR).15 In t(14;18)(q32;q21)/IGH::BCL2, the translocated BCL2 coding region was close to Eμ and 3′-RR, most likely accounting for the overexpression of BCL2.16 On the other hand, the coding region of BCL6 in t(3;14)(q27;q32)/BCL6::IGH remained in der(3)t(3;14) and upstream sequences of IGH, including Eμ, were joined to 5′ of BCL6.17, 18 In the present case, der(3)t(3;14;18)(q27;q32;q21) theoretically contained the BCL2, IGH, and BCL6 triple fusion element, coding exons of BCL2 and BCL6 were aligned in the same transcriptional orientation, and an IGH segment containing Eμ, but lacking 3′-RR, was present between the two genes (Figure 7). Therefore, in terms of the IGH enhancer alone, the expression of BCL2 in t(3;14;18)(q27;q32;q21) may be less active than that in t(14;18)(q32;q21) and the expression of BCL6 may be similar to that in t(3;14)(q27;q32).
We reviewed BCL2, BCL6, and Ki-67 immunostaining from this point of view and found that although BCL6+ cells were evenly distributed within the follicles (Figure 1H), BCL2+ cells were distributed in the central zone of the follicles and staining intensity decreased in the periphery (Figure 1G). In contrast, Ki-67+ cells were present in the peripheral zone of the follicles (Figure 1I). Therefore, we postulated that central BCL2+ cells represented lymphoma cells with t(14;18)(q32;q21), while peripheral BCL2dim cells represented those with t(3;14;18)(q27;q32;q21) and the latter were more proliferative than the former. Accordingly, BCL2-R+ and BCL6-R+ nuclei, theoretically representing t(3;14;18)(q27;q32;q21)-carrying nuclei, increased in the peripheral zone of the follicles (Table 1). However, since the number of BCL6-R+ nuclei was unexpectedly small (Table 1, Figure 8), the distribution of t(14;18)(q32;q21)- and t(3;14;18)(q27;q32;q21)-carrying lymphoma cells within the follicles did not appear to affect the reverse immunostaining of BCL2 and Ki-67.
Although BCL2-R is the hallmark of FL, BCL6-R was previously detected in a significant fraction of FL cases and rearrangements of the two genes often coexisted in a single tumor.19, 20 Therefore, in terms of BCL2-R and BCL6-R, FL cases are divided into the BCL2-R+/BCL6-R−, BCL2-R−/BCL6-R+, BCL2-R+/BCL6-R+, and BCL2-R−/BCL6-R− groups. BCL2-R−/BCL6-R+, in which t(3;14)(q27;q32)/BCL6::IGH is the most common,21 has been associated with the grade 3B histopathology and negative expression of CD10.21-23 On the other hand, cases with BCL2-R+/BCL6-R+ exhibit similar clinical and histopathological features to those of BCL2-R+/BCL6-R− FL cases.19, 20 In one series, the authors concluded that BCL6-R affected the phenotype of FL only when BCL2-R was absent.24 In the present case, centroblasts were predominant and mitotic figures were frequent, suggesting a more aggressive pathobiology than BCL2-R+/BCL6-R− FL. Further studies are warranted to clarify the role of BCL6-R in the development and progression of FL.
ETHICAL STATEMENT
All procedures performed in the present study involving the patient were conducted in accordance with the 1964 Declaration of Helsinki. The Institutional Review Board does not require an ethical review of case reports if sufficient anonymity is ensured.
ACKNOWLEDGMENTS
This study was supported by Tenri Foundation.
Reference List
- 1. Jaffe ES, Harris NL, Swerdlow SH, et al. Follicular lymphoma. In: Swerdlow SH, Campo E, Harris NL, et al., eds. WHO Classification of Tumours of Haematopoietic and Lymphoid Tissues (Revised 4th edition). Lyon: IARC; 2017:266-273.
- 2. Ye BH, Rao PH, Chaganti RS, et al. Cloning of bcl-6, the locus involved in chromosome translocations affecting band 3q27 in B-cell lymphoma. Cancer Res 1993;53:2732-2735.
- 3. Miki T, Kawamata N, Arai A, et al. Molecular cloning of the breakpoint for 3q27 translocation in B-cell lymphomas and leukemias. Blood 1994;83:217-222.
- 4. Basso K, Dalla-Favera R. Roles of BCL6 in normal and transformed germinal center B cells. Immunol Rev 2012;247:172-183.
- 5. Kridel R, Sehn LH, Gascoyne RD. Pathogenesis of follicular lymphoma. J Clin Invest 2012;122:3424-3431.
- 6. Iqbal J, Greiner TC, Patel K, et al. Distinctive patterns of BCL6 molecular alterations and their functional consequences in different subgroups of diffuse large B-cell lymphoma. Leukemia 2007;21:2332-2343.
- 7. Barrans SL, O'Connor SJ, Evans PA, et al. Rearrangement of the BCL6 locus at 3q27 is an independent poor prognostic factor in nodal diffuse large B-cell lymphoma. Br J Haematol 2002;117:322-332.
- 8. Shustik J, Han G, Farinha P, et al. Correlations between BCL6 rearrangement and outcome in patients with diffuse large B-cell lymphoma treated with CHOP or R-CHOP. Haematologica 2010;95:96-101.
- 9. Akasaka T, Akasaka H, Ohno H. Polymerase chain reaction amplification of long DNA targets: application to analysis of chromosomal translocations in human B-cell tumors (review). Int J Oncol 1998;12:113-121.
- 10. Akasaka T, Akasaka H, Yonetani N, et al. Refinement of the BCL2/immunoglobulin heavy chain fusion gene in t(14;18)(q32;q21) by polymerase chain reaction amplification for long targets. Genes Chromosomes Cancer 1998;21:17-29.
- 11. Roumier C, Galiègue-Zouitina S, Bastard C, et al. FISH analysis with a YAC probe improves detection of LAZ3/BCL6 rearrangement in non-Hodgkin's lymphoma. Hematol J 2000;1:117-125.
- 12. Okano A, Nakano S, Namura K, et al. Unique three-way translocation, t(3;14;18)(q27;q32;q21), in follicular lymphoma. Cancer Genet Cytogenet 2005;159:174-176.
- 13. Rack K, Delannoy A, Ravoet C, et al. Translocation of BCL2 and BCL6 to the same immunoglobulin heavy chain locus in a case of follicular lymphoma,. Leuk Lymphoma 2005;46:1513-1516.
- 14. Yamamoto K, Ono K, Katayama Y, et al. Derivative (3)t(3;18)(q27;q21)t(18;16)(q21;?) involving the BCL2 and BCL6 genes in follicular lymphoma with t(3;14;18)(q27;q32;q21). Cancer Genet Cytogenet 2007;179:69-75.
- 15. Roy AL, Sen R, Roeder RG. Enhancer-promoter communication and transcriptional regulation of Igh. Trends Immunol 2011;32:532-539.
- 16. Duan H, Xiang H, Ma L, et al. Functional long-range interactions of the IgH 3' enhancers with the bcl-2 promoter region in t(14;18) lymphoma cells. Oncogene 2008;27:6720-6728.
- 17. Ruminy P, Jardin F, Picquenot JM, et al. Two patterns of chromosomal breakpoint locations on the immunoglobulin heavy-chain locus in B-cell lymphomas with t(3;14)(q27;q32): relevance to histology. Oncogene 2006;25:4947-4954.
- 18. Ohno H, Fukuhara S. Significance of rearrangement of the BCL6 gene in B-cell lymphoid neoplasms. Leuk Lymphoma 1997;27:53-63.
- 19. Keller CE, Nandula S, Fisher J, et al. The spectrum of B-cell non-Hodgkin lymphomas with dual IgH-BCL2 and BCL6 translocations. Am J Clin Pathol 2008;130:193-201.
- 20. Muramatsu M, Akasaka T, Kadowaki N, et al. Rearrangement of the BCL6 gene in B-cell lymphoid neoplasms: comparison with lymphomas associated with BCL2 rearrangement. Br J Haematol 1996;93:911-920.
- 21. Jardin F, Gaulard P, Buchonnet G, et al. Follicular lymphoma without t(14;18) and with BCL-6 rearrangement: a lymphoma subtype with distinct pathological, molecular and clinical characteristics. Leukemia 2002;16:2309-2317.
- 22. Katzenberger T, Ott G, Klein T, et al. Cytogenetic alterations affecting BCL6 are predominantly found in follicular lymphomas grade 3B with a diffuse large B-cell component. Am J Pathol 2004;165:481-490.
- 23. Karube K, Guo Y, Suzumiya J, et al. CD10−MUM1+ follicular lymphoma lacks BCL2 gene translocation and shows characteristic biologic and clinical features. Blood 2007;109:3076-3079.
- 24. Gollub W, Stassek B, Huckhagel T, et al. BCL6-translocations affect the phenotype of follicular lymphomas only in the absence of t(14;18)IgH/BCL2. Anticancer Res 2009;29:4649-4655.