Review
Structural analysis of filamentous complexes by cryo-electron microscopy
2022 年 4 巻 3 号 p. 68-75

詳細
2022 年 4 巻 3 号 p. 68-75
Cryo-electron microscopy (cryo-EM) has become one of the main tools in structural biology over the last decade. Nonetheless, the details of cryo-EM remain unknown to many researchers. Cryo-electron microscopes are very expensive. Therefore, owning, maintaining, or renewing a cryo-EM instrument in a single laboratory or university is often challenging. As has been done for synchrotrons, it is rational to introduce cryo-EM in shared facilities and allocate cryo-EM beamtimes to research teams. Shared cryo-EM systems have been established in several countries. However, sound knowledge of sample preparation is essential for achieving results using shared facilities, where the availability of beamtime is limited. In this review, we present the current state of cryo-EM for general users who do not have direct access to a cryo-electron microscope by reviewing the achieved structures (mainly filamentous complexes) and the ways to determine them.
Although several cryo-electron microscopes have already been installed as shared systems, the details of cryo-electron microscopy remain unfamiliar to many researchers. In this review, we present examples of results and the ways to determine structures using cryo-electron microscopy from the viewpoint of a general user who does not have direct access to a cryo-electron microscope.
All life phenomena depend on the properties of the molecules involved in their occurrence. The properties of molecules, especially those of proteins, are essentially dependent on their three-dimensional structure. Therefore, to understand life phenomena, we must understand the three-dimensional structure of the proteins involved in these phenomena. Cryo-electron microscopy (cryo-EM) is a tool for analyzing the three-dimensional structure of biomacromolecules.
Molecules observed by electron microscopy must be exposed to vacuum. Thus, a liquid solution cannot be observed. Cryo-EM was introduced by Jacques Dubochet and Alasdair McDowall [1] in the 1980s, in which a protein in a solution was rapidly frozen and observed at a low temperature. Ice does not sublimate at low temperatures, even under vacuum conditions. By quick freezing, ice crystallization was prevented, and the structure of biomolecules close to the native state in the solution could be observed. The three-dimensional structure of the protein was obtained by analyzing the cryo-EM data using computers. However, the resolution was limited to approximately 7 Å by the turn of the 21st century.
This changed completely in 2012. High-speed imaging with a complementary metal oxide semiconductor (CMOS) camera became possible, and it was found that when a cryo-EM sample was exposed to an electron beam [2], the ice was distorted, and the molecules moved. Blurring caused by this movement limited the resolution. By producing a movie with high-speed imaging and correcting for the movement of molecules [3], the resolution of cryo-EM data has improved dramatically, and it is now possible to obtain near-atomic resolution with data collected at resolutions easily exceeding 4 Å. Similar to X-ray crystallography, cryo-EM is now a major tool in structural biology.
Researchers have analyzed the structures of fibers using cryo-EM since the 1980s, when it was difficult to obtain high-resolution data. It is very difficult to use X-ray crystallography to solve the structures of fibrous complexes, except for linear, twist-free polymers such as MreBs [4], and this has been carried out by structural analysis using electron microscopy. In this review, the characterization of three fibrous structures using cryo-EM is presented as an example of this technique. Then, I will introduce how our group, which does not have direct access to a cryo-EM instrument, performs cryo-EM data collection and analysis using shared, central facilities.
In this section, three fibrous structures analyzed by cryo-EM are briefly presented as examples.
The actin-cofilin complexActin is a 42 kDa protein present in all currently known eukaryotic cells and polymerizes to form filaments [5]. Actin performs a wide range of functions, such as moving cells, determining the shape of cells, connecting cells, and being involved in endocytosis and exocytosis. Most actin filaments in the cell are constantly polymerized and depolymerized [6, 7]. Owing to these dynamics, actin filaments respond flexibly to changes to cells caused by external and internal stimuli and play various roles. However, if unnecessary actin filaments are not rapidly decomposed to monomer species, the actin monomer pool is depleted rapidly, and these important dynamic processes become inactive. Proteins termed as actin-depolymerizing factors (ADF)/cofilin are primarily responsible for the decomposition of actin filaments [8]. The rate of isolated actin filament depolymerization is slow [9] (up to 0.04 µm/min, with ADP) and significantly slower than that observed in cells (up to 10 µm/min or more at high speeds), indicating that the decomposition of actin filaments by ADF/cofilin accelerates the dynamics of intracellular actin by more than 200-fold. To understand the mechanism of actin filament decomposition by ADF/cofilin, we used cryo-EM to determine the structure of actin filaments decorated with cofilin, which is an ADF/cofilin [10].
Cofilin decomposes actin filaments by severing actin filaments and accelerating depolymerization from the filament ends (Fig. 1B and 1C). Cofilin binds to actin filaments in a 1:1 ratio with actin molecules (Fig. 1A). Cofilin binding is cooperative, with cofilin readily binding to the next cofilin-binding site to form clusters on actin filaments (Fig. 1B). The severing of actin filaments occurs at the pointed-end-side border of the cofilin cluster (Fig. 1B). The structure of actin filaments changes significantly, causing the helix to tighten upon cofilin binding (Fig. 1A). Actin binds to one ATP or ADP molecule and ATP-bound actin forms filaments. When these filaments are formed, actin ATPase is activated and converts ATP to yield ADP-bound actin. Cofilin only binds to this ADP-bound actin filament (Fig. 1B and 1C).

The actin-cofilin complex. A: the actin filament is a two-stranded filament. Cofilin binding induces a large structural change. The distance for which one strand rotates 180° is called a crossover, which is 36–38 nm for actin filaments. The crossover decreases in length to 27–28 nm when cofilin (yellow) binds. B: schematic diagram of severing by cofilin. Cofilin binds to ADP-actin subunits, forms a cluster and severs the filament at the pointed-side boundary of the cofilin binding cluster. C: schematic diagram of depolymerization induced by cofilin binding. D: density map of a cofilin-bound actin filament. E, F: enlarged views of D.
Although we have explained all these functional events based on the structure (Fig. 1D–1F) in [10], the regulation of cofilin is still not well understood [11].
Bacterial actin ParMActin is specific to eukaryotes and has homologs in prokaryotes. One homolog is ParM. ParM, along with ParR and parC, contributes to the distribution of the plasmid to both daughter cells during cell division as a part of the ParMRC system [12, 13]. ParM, ParR, and parC are all encoded on one plasmid, and therefore, the ParMRC system is specific to each plasmid and not to each species. This system partly explains why plasmids continue to be inherited when incorporated into the cells of other species.
ParM has a molecular and strand structure similar to that of actin. However, there are clear differences in how the strands combine into filaments [14]. Two strands form polar filaments in actin, similar to ParM-R1 in E. coli. However, Clostridium tetani ParM produces a filament consisting of four strands, and another ParM produces a non-polar filament comprising two strands. Among these, CbH-ParM, published in 2019, has an extremely peculiar shape [15]. CbH-ParM forms a filament consisting of 15 strands: a central strand, six strands in the intermediate layer, and eight strands in the outer layer (Fig. 2). The central strand and outer layers have the same polarity, whereas the intermediate layer has the opposite polarity (Fig. 2C). The question arises as to how such a complex shape is constructed from a single species of molecules of mass only 40 kDa.

CbH-ParM. A: the density map. B: a top view of the fitted atomic model. C: the three strands are indicated by the black arrow in B. The polarity of each layer is indicated by the lower arrows. D: a single cross-section with positively (red) and negatively (blue) charged regions.
As shown in Fig. 2D, no interactions between the strands are the same, but the positively and negatively charged regions face each other. Thus, the interactions between strands are mainly electrostatic. Electrostatic interactions are not a specific type of interaction. However, only the 15-strand structure forms a stable structure based on the charge distribution pattern. In other words, a stable, large structure can be constructed using a combination of non-specific interactions.
The Archaea tubulin homologTubulin polymerizes into microtubules, which are also eukaryotic-specific fibrous structures, with homologs present in prokaryotes [16] and archaea. Prokaryotic homologs are called FtsZ, and form structure like a contraction ring in eukaryotes. Recently, we analyzed the tubulin homolog from the archaea Odin, determined the polymerization conditions, and performed cryo-EM analysis [17]. The results were surprising. Tubulin formed tubes as large as 100 nm in diameter (Fig. 3A). Additionally, unlike microtubules, the strands were not parallel to the axial direction, but arcs of a particular length stacked and formed a coil-like structure (Fig. 3B and 3C). X-ray crystallography was also performed, and the structure was very similar to that of eukaryotic microtubules (Fig. 3D). Odin microtubules are likely evolutionarily located between prokaryotic FtsZ (ring) and eukaryotic microtubules (tube).
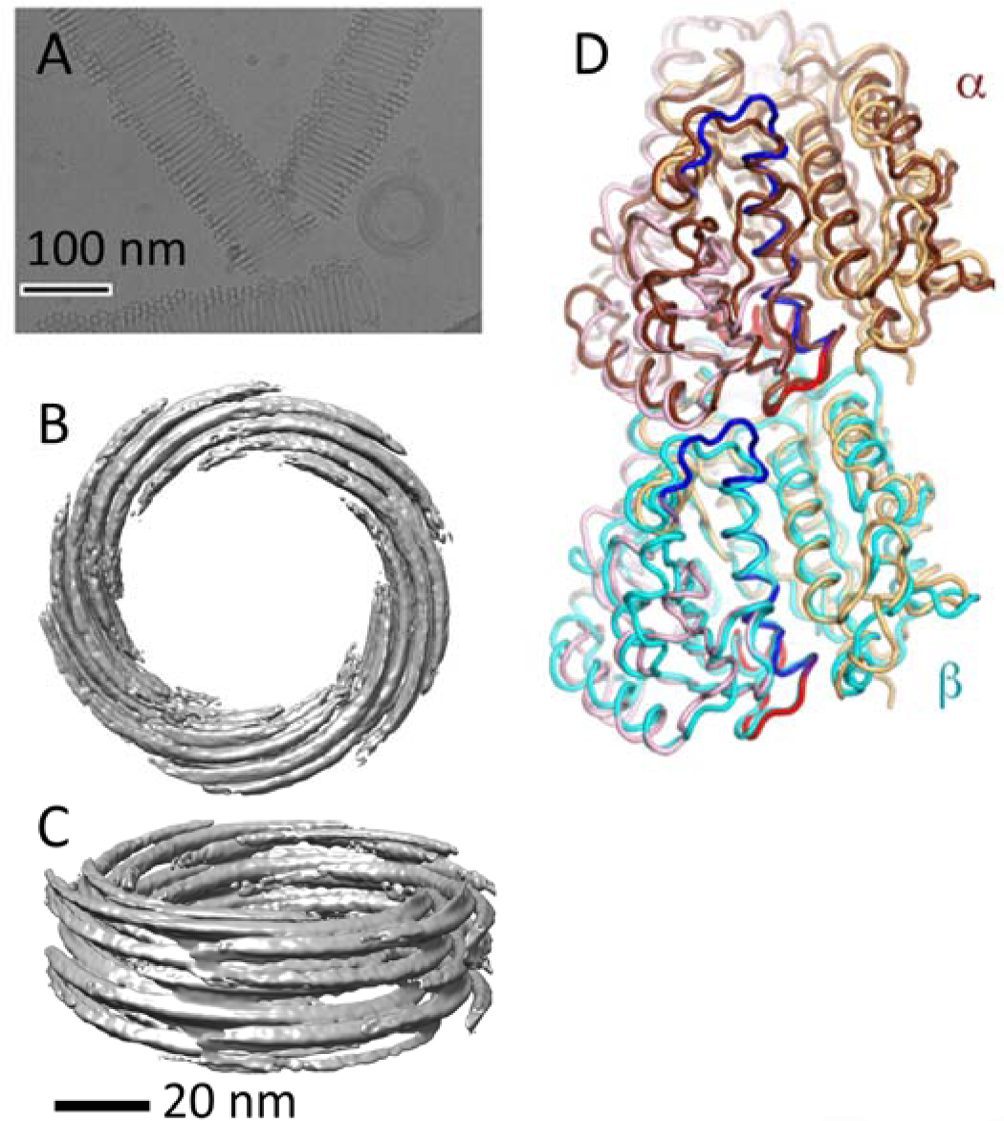
Odin tubulin. A: a cryo-electron micrograph of Odin tubulin. B: a top view of the density map. C: another view of the density map. D: the crystal structures of Odin tubulin were superposed on human microtubules.
As described earlier, cryo-EM is an important technique that has led to many valuable discoveries. Cryo-EMs are shared in several countries, and the beamtime is assigned to researchers relatively quickly. However, limited beamtime is assigned to each project because cryo-EM instruments are shared. The question arises as to how we can maximize results with a limited beamtime allocation.
My group does not have direct access to a cryo-EM instrument, and we are assigned beamtime to perform our research. As an example, I describe the methods adopted by my research group to maximize the output using the allocated cryo-EM beamtime.
OverviewAchieving good results with limited beamtime requires determining suitable conditions for preparing a cryo-grid (sample to be observed in cryo-EM). Currently, a good cryo-grid sample typically ensures the collection of sufficient data within two days.
A protein sample should be of sufficient purity and have a structure that is as homogeneous as possible. Good quality data collection can be achieved if one of the components of the complex is occasionally missing from a fraction of the complexes. However, it is challenging to analyze the cryo-EM data of a complex when the complete complex represents the minor species (or small fraction) of the sample. The state of the complex can be confirmed by negative-staining electron microscopy, which allows direct observation of the approximate shape of the molecule. The conditions for the expression, purification, and reconstruction of the complex should be reviewed when the shape is not uniform (Fig. 4). Cryoscreening can be performed when the structure is homogeneous. Even when good negative staining is observed, the structure is often disrupted, or a molecular image is not observed under cryo-conditions. Therefore, it is necessary to screen the conditions for preparing cryo-grids. Such screening is possible with any type (including old instruments) of cryo-electron microscope that is available. Here, conditions where the ice is as thin as possible, the structure is not broken, and the molecular image is observed at an appropriate density are considered suitable for cryo-EM data collection.

A schematic flowchart describing the approach for structural analysis by cryo-EM.
Under such conditions, images can be collected within the assigned beam time in a shared facility. Depending on the imaging conditions, it is now possible to capture more than one-thousand images overnight, and if a good cryo-grid is available, sufficient data can be collected rapidly.
Subsequently, image analysis and model construction are performed, and the structural analysis is completed. Each step of determining the structure of protein complexes by cryo-EM is described in greater detail next.
Negative stainingNegative staining involves replacing the solution with uranyl acetate, drying, and observation under an electron microscope [18]. Although the resolution is limited to approximately 2 nm, the uniformity of the complex or polymer can be checked. Moreover, this method also provides an approach to ensure that sufficient material is available and that the stability of the sample is good. Negative staining with uranyl acetate has also been reported to fix the structure within ten milliseconds [19], similar to the fixing time by freezing in cryo-EM. Three-dimensional structural analysis is also possible [20].
Negative staining is the simplest method for electron microscopic observation of biological samples, and is strongly recommended for researchers interested in understanding the molecular structure. The sample preparation method is briefly summarized in Fig. 5 and the supplementary movie. However, readers are advised to refer to the literature [18, 21] for further details. The negatively stained grid can be observed using a transmission electron microscope.

Negative staining procedures. See also Supplementary Movie. A, B: glow discharge [23]. Carbon-coated grids are commonly used. Commercially available grids are satisfactory for sample checking. We use elastic carbon film grids provided by STEM, Tokyo, Japan. However, these grids are typically too hydrophobic for use for negative staining. Glow discharge is widely used to make the grids hydrophilic. C–G: negative staining procedures. Supplementary Movie corresponds to C–F. C: initially, three droplets of staining solution (2% uranyl acetate) are prepared on parafilm (in total 10 µl). D: sample solution (1.5–3 µl) is applied to a glow discharged carbon-coated grid. According to the sample status, the grid is kept for 0–30 s. Longer incubation times are required when the sample concentration is low. The same amount of staining solution is applied gently to the grid without pipetting or mixing. E: blotting by filter paper. F: one droplet of the staining solution in C is applied to the grid by touching it and then blotting again. This procedure is repeated three times to replace the initial solution completely with the staining solution. G: the sample is placed in an open grid box, and the grid box is kept in a desiccator for more than 1 h (overnight is recommended) to dry the grid slowly.
A limitation of this method is that uranium treatment requires a permit in many countries. Most older medical schools have permission because uranyl acetate is often used for staining when observing tissue sections under an electron microscope. To identify a location that uses uranyl acetate, a good starting point is to contact a medical school that manages an electron microscope.
Other staining substances are also available, but uranyl acetate remains the best choice because it affords a short fixing time and large contrast.
Cryo-screeningThe grid used in cryo-EM typically has a carbon film with regular µm-ordered holes (holey carbon grid). The solution containing the sample for observation forms a thin liquid film in the hole, which is frozen and observed. Cryo-conditions are usually considered as physiological conditions, but the sample complex is often broken or not observed in the hole when a cryo-grid is prepared. The observation of a homogeneous complex under negative staining conditions but not under cryo-conditions indicates that the issue arises from the cryo-grid preparation conditions. Thus, cryoscreening is used to determine the optimum cryo-grid preparation conditions.
The complex is typically disrupted because it contacts the air-liquid interface [22]. Better image quality is obtained when the ice in the hole is as thin as possible. However, if the ice is extremely thin, there is a greater probability of the complex contacting the air-liquid interface, leading to disruption of the complex. Although the thickness of the ice is not entirely controllable, the amount of sample solution placed on the grid (smaller amounts typically form a thinner film of ice) and the length of blotting time with filter paper are important parameters that affect the ice thickness. Longer periods of blotting are more likely to yield a thinner ice film, but this approach is less effective than varying the sample amount.
Two possible causes arise when there are essentially no molecules in the holes, even though a sufficient number of molecules are observed by negative staining. One possible cause is that when the ice is overly thin for the size of the complex, the complex cannot enter the ice film in the hole. In such a case, the ice thickness can be increased. Additionally, the complex has a high affinity for the carbon film and is adsorbed onto the carbon film. In this case, the simplest solution is to increase the sample concentration. The part that is not adsorbed resides in the hole. In situations where the concentration cannot be increased, changing the hydrophilization method of the carbon film may help. Usually, the holey carbon grid is hydrophilized by glow discharge [23] before use (Fig. 5A and 5B). Some devices can change their discharge mode. Another approach involves introducing some gas into the glow discharge chamber to change the properties of the carbon film. Alternatively, good sample preparation can be ensured by placing a very thin carbon film, graphene [24] or graphene oxide [25] film, over the holes. Sample molecules are adsorbed on the film in the holes to enable their observation. This method is also efficient when the sample concentration is insufficient for the standard cryo-EM. However, this method can cause other problems, one is slightly noisy images by the addition of the film and another is that molecules are oriented in only a few directions, which may hamper 3D structural analysis.
As mentioned above, good cryo-grid preparation conditions can be achieved in many cases. However, to examine the conditions, it is necessary to prepare a grid several times and observe it using cryo-EM, which requires time. Performing this step in a shared facility requires a large amount of beamtime. It is clear that the number of electron microscopes for cyro-screening should be 2–3 times greater than that for high-resolution data collection. In Japan, limited access to cryo-screening hinders the widespread use of cryo-EM. Considering the information from our collaborators in Singapore and Finland, the situation appears to be similar in many countries, although in some countries, such as the United States, the situation is more favorable. Importantly, cryo-screening does not require a state-of-the-art electron microscope, and any cryo-EM can be used. To increase the use of cryo-EM, it is necessary to increase the number of shared facilities for cryo-screening using old or inexpensive cryo-EMs.
Data collectionThe next step is to collect high-resolution data using a shared facility. Titan Krios (Thermo Fischer) and CRYO ARM (Jeol) are mainly used for high-resolution data collection. Both have acceptable performance. Imaging is almost automated, and after selecting the hole to be captured, the electron microscope captures the images according to the set conditions. The rate-determining factor is the drift accompanying the movement of the stage. Thus, it is necessary to wait for the drift to subside. However, in combination with image shift, multiple holes can be captured with one movement, thereby reducing the number of stage movements [26]. Multiple locations in one hole can also be captured, and depending on the settings, more than 100 images can be acquired per hour. Good-quality samples enable the acquisition of sufficient data in several hours, and in many cases, two days are adequate.
Image analysisPreviously, several groups had their own image processing systems, but now two are used as standards: RELION [27] and cryoSPARC [28]. It is possible to set the parameters in detail using RELION, and cryoSPARC is selected for high-speed processing. RELION is used to examine fiber complexes because cryoSPARC is still in the beta stage of fiber analysis. The tutorials for RELION and cryoSPARC are well prepared, and once a user completes the tutorial, they can use these programs.
Model buildingThe final step involves building an atomic coordinate model. The main chain can be traced accurately when the resolution exceeds an alpha helix pitch of 5.5 Å. Side chains begin to appear when the resolution exceeds 4 Å, and they can be assigned almost completely when the resolution exceeds 3 Å. Residues can be directly assigned to the density map for initial modeling when the resolution exceeds 3 Å. However, when the resolution is below 3 Å, it is preferable to create an initial structural model and refine the model. Previously, homology modeling was used to create the initial structural model, but AlphaFold2 [29] is the first choice nowadays.
Figure 6 shows an example of using AlphaFold2 for a ParM whose structure was recently solved by cryo-EM and X-ray crystallography. The structure modeled using AlphaFold2 was in excellent agreement with the ParM filament structure. In particular, the structure inside each domain was accurately predicted. However, the structure was significantly different from the domain arrangement of the monomer structure without binding the nucleotide determined by X-ray crystallography. This was in spite of predictions by AlphaFold2 of the monomer without nucleotides. Although it was satisfactory as an initial structural model for electron microscopy and X-ray crystallography, caution should be exercised when examining the output of AlphaFold2, especially the relative arrangement among domains.

AlphaFold2 predictions. A: predictions by AlphaFold2 for the target ParM. Five predictions are superposed in different colors. B: one subunit model in a filament with GDP determined by cryo-EM. C: a crystal structure of the monomeric state of ParM without the nucleotide.
After obtaining the initial structural model, it can be modified using a density map-biased molecular dynamics simulation. Isolde [30], which is an extension of ChimeraX [31], is very useful. It is easy to move only the inter-domain arrangement while keeping each domain fixed. Then, the structure should be refined using Coot [32] and Phenix [33] as performed for X-ray crystallography.
In this paper, three structures determined by cryo-EM are presented as examples, and the schemes used for structural analysis are described. Cryo-screening is a limiting factor for the spread of cryo-EM in Japan, and many other countries. The number of shared cryo-EM instrument facilities for cryo-screening should be increased.