FORMATH
Online ISSN : 2188-5729
ISSN-L : 2188-5729
Volume 4
Displaying 1-10 of 10 articles from this issue
Original Article
  • T. Suzuki
    Article type: research-article
    2005 Volume 4 Pages 1-24
    Published: 2005
    Released on J-STAGE: June 25, 2020
    JOURNAL FREE ACCESS

    Consider a tree trunk. One may imagine a broken line consisting of two straight segments. The one is a perpendicular ascending from the centre of its base disk to the centre of the disk at the height z, and the other a horizontal stretching from there to the stem surface of radius r. We will call the line a "S-S broken line". If the distance between two points A and B on the same S-S broken line is defined in terms of time necessary for the tree tissue to spread over the interval (A, B), all the points of the stem surface are equidistant from the centre of the base disk. This means a stem surface a kind of a sphere. We will call it a stem quasisphere Q. An equation of the quasisphere Q at age t is


    in which H, R(z) are limiting values of the stem height and of the radius r of the height z, and 
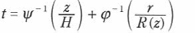
, the inverses of the growth curves of the stem height z and of the radius r at the height z, respectively. Let us define a kind of index function u (t, z, r) of three variables age t , height z and the radius r as

    We call it a stem Heaviside function. Then u is a 'weak solution' of a linear homogeneous partial differential equation

    in which is a gradient of its stem curve, and the stem surface is a characteristic surface of the equation. In other words, the solution u = 1 jumps into another solution u = 0 discontinuously on the stem surface. Therefore the stem surface can be regarded as a kind of 'wave front' of its growth.

    Download PDF (3135K)
  • Growing Stock Illustration
    H. Tokimitsu
    Article type: research-article
    2005 Volume 4 Pages 25-47
    Published: 2005
    Released on J-STAGE: June 25, 2020
    JOURNAL FREE ACCESS

    To ward off defined algebraic expression I illustrated growing stock with three figures o􀁖o. 0 was to exist, 􀀽 was to turn to something, and 0 was mortal. A growing stock was illustrated with a crown and a growing stem. Growing stems were illustrated with individual stands and a fully stocked stand. Extinguished stems and the upper limit of stand volume could be observed in the space of the illustration. And a yield table was illustrated with main crop and some growing stock. The illustration was a clear sketch with many temporary factors around the subject, growing stock. Therefore it was easy to show increase instead of decrease. The result said that the form of increasing figures was valuable and good as a growing stock model. And the acute decrease risk which followed a defined expression was shown, and it might not be said that the illustration with many temporary factors was proper to be sensible of the risk or to ward off it.

    Download PDF (3805K)
  • H. Yanagihara, A. Yoshimoto
    Article type: research-article
    2005 Volume 4 Pages 49-69
    Published: 2005
    Released on J-STAGE: June 25, 2020
    JOURNAL FREE ACCESS

    A growth pattern of an individual tree differs due to such effects as a local geography condition and competition among trees. In such a case, clustering growth patterns of individual trees becomes effective to describe a whole forest stand growth. We proposed a clustering method for tree growth in an even-aged forest stand. Our method consists of I) estimating parameters of a growth curve, 2) clustering a set of estimated parameters by the k-means method, 3) multivariate analysis of variance (MANOVA) on a set of the parameters, and 4) searching for an optimal number of clusters by the smallest information criterion.

    Download PDF (2864K)
  • A. Yoshimoto, H. Yanagihara, M. Nomoto
    Article type: research-article
    2005 Volume 4 Pages 71-91
    Published: 2005
    Released on J-STAGE: June 25, 2020
    JOURNAL FREE ACCESS

    In this paper, by constructing a forest stand optimization model called DP-KYSS within the dynamic programming framework, we conducted an analysis on carbon sequestration through the derived optimal thinning regime. Our analysis showed that if thinning is regarded as carbon sequestering activity, the optimal solution derived under the PNV (present net value) maximization criterion would not be much different from that derived under the carbon maximization criterion. In other words, the PNV maximization solution would be valid not only for maximizing the total profits from thinning and final harvest, but also for sequestering carbon under the derived regime. It was also shown that if thinning is treated as carbon release, under the carbon maximization criterion, no thinning became an optimal solution.

    Download PDF (3182K)
  • F. Onishi
    Article type: research-article
    2005 Volume 4 Pages 93-108
    Published: 2005
    Released on J-STAGE: June 25, 2020
    JOURNAL FREE ACCESS

    This study intends to satisfy the goal, which imposed on the environmental planning such as "The sustainable development". From the standpoint of ecological planning, quantitative cognition of interrelationship between blessing of nature and favor of scientific technology and also demand of man is important for this goal. For this purpose, five parameters such as I) Capacity of C02 fixation, 2) Capacity of cooling, 3) Capacity of space, 4) Capacity of water resource, 5) Capacity of wooden resource are assumed in this study, and the environmental capacity and mechanisms of fluctuations of environmental capacity of river basin as Eco-system on the three metropolitan areas in Japan are analyzed by using mathematical modeling and also Geographical Information System.

    Download PDF (2459K)
  • K Shimasaki, K. Tanaka
    Article type: research-article
    2005 Volume 4 Pages 109-124
    Published: 2005
    Released on J-STAGE: June 25, 2020
    JOURNAL FREE ACCESS

    The information of actual working time on harvesting operation is indispensable to estimate yarding cost, because personnel expenses affect profitability of timber production. In this paper, we made relational models of access time when using vehicle and on foot, and estimated actual working time on harvesting operation. Actual access times of sample courses were measured by GPS and analyzed by GIS. In addition, we estimated yarding cost of fixed amount of thinnings by using relational models of access time.

    Download PDF (2592K)
  • S. Kawata, N. Matsumura
    Article type: research-article
    2005 Volume 4 Pages 125-134
    Published: 2005
    Released on J-STAGE: June 25, 2020
    JOURNAL FREE ACCESS

    Forest zoning system are expected to propose a new scheme of regional forest management. Applicability of GIS techniques for such new scheme was discussed based on the forest information system introduced in Mie Prefecture. The zoning system is based on the two categories of forest type, i.e. production forest and environmental forest. For environmental forest, a new thinning and management design called "Forest Environment Creation Project" was introduced. This project is conducted by full subsidy. The major two conditions are long term contract with certified forest association in 20 years and total area more than 30 ha. It is discussed that merit and demerit of this project from the view point of building target compartments more than 30 ha using GIS techniques as a case study in Misugi Village under the consideration of zoning types, number of forest owners, forest compartment area.

    Download PDF (1767K)
  • H. Kondoh, K. Ikeda, T. Koizumi, T. Murakami, S. Yoshida
    Article type: research-article
    2005 Volume 4 Pages 135-146
    Published: 2005
    Released on J-STAGE: June 25, 2020
    JOURNAL FREE ACCESS

    The purpose of this study is to consider the special distribution of sika deer (Cervus nippon) population density applied lhe kriging interpolator. The study area was sika deer habitat on the side of Mt. Hiko in Fukuoka Prefecture, Kyushu, Japan. Sika deer population density was surveyed by pellet count method from November, 1999 to March, 2000. We made a database of site information collected at the population density survey plots, which were distributed discretely in the study area. So, using the database, the geographic information which was the continuous data aggregate of the population density, was drawn as the map with the kriging interpolator on Geographic Information System (GIS). This map considered the distribution of the sika deer population density in the study area.

    Download PDF (1653K)
  • Investigation by a multi-country, multi-commodity comparative cost model, including intermediate goods
    Y. Ejiri
    Article type: research-article
    2005 Volume 4 Pages 147-173
    Published: 2005
    Released on J-STAGE: June 25, 2020
    JOURNAL FREE ACCESS

    A model of linear programming with variables which express the outputs of each sector of Japan and the US and with the objective function which consists of the sum of GDP including the total amount of the public benefits from forestry in each country is developed. Then the international pattern of the specialization which maximizes the objective function is investigated. First, the relation between the theory of comparative costs for two goods and two countries and the problem of linear programming is considered. Secondly, using this relation as a clue, the way how the multi-country, multicommodity problem of the comparative costs should be formulated concisely taking the intermediate goods into consideration as a problem of linear programming is developed. Then the coefficients of the objective function are modified in order to internalize these public benefits from forestry. Lastly, these problems of linear programming are constructed using the economic data on the 21 sectors (goods) in Japan and the US, and the desirable pattern of the international specialization of these countries is investigated. The conclusions may be summarized as follows: lf the amount of the public benefits from forestry in each country is estimated properly within a range of several hundred billion - several ten trillion (yen/year), respectively, it is beneficial under the properly estimated values that Japan replace its forest products import by the own production and the US suppress its output.

    Download PDF (4230K)
  • T. Murakami
    Article type: research-article
    2005 Volume 4 Pages 175-191
    Published: 2005
    Released on J-STAGE: June 25, 2020
    JOURNAL FREE ACCESS

    Although the Minnaert constant of the Minnaert topographic correction method would be decided depending on each landcover, there is almost no example which compared how much it would change according to an observation scene. The purpose of this study is comparing the Minnaert constants among three forest types at each scene using multitemporal remote sensing image. The Minnaert constant for each forest type was computed by the sampling data from the same topographical feature conditions (slope angle and slope azimuth), and significant difference test was performed. Furthermore, the Minnaert constants from the stratified random sampling data only on topographical feature conditions were obtained without specifying a forest type and I discussed their identity. The study area is forested area of the Sangun mountainous region, the environs of Fukuoka city, Japan. The satellite images were SPOT/HRV data of seven scenes observed during 1997. As a result of the comparing the Minnaert constant among three forest types from the sample of the same topographic conditions, significant differences were not recognized on some scenes. The Minnaert constants from the random sampling data only stratified on topographic conditions indicated no significant differences in all scenes and bands. Consequently, even if the sample changed, when stratifying on topographical feature conditions, stable Minnaert constant may be acquired.

    Download PDF (2707K)
feedback
Top